Top Free Data Visualization Tools - Page 11

How Many Data Visualization Tools Products Does G2 Track?

Total Products under this Category: 697

Category Stats (Nov 2026)

  • Average Rating: 4.44/5 The average rating of products in this category, based on all submitted ratings
  • Top Trending Product: Upsolve AI (+1.75%) - Among all products in this category, Upsolve AI recorded the largest rating increase compared to last month

Last updated: November 01, 2026

How Does G2 Rank Data Visualization Tools Products?

Why You Can Trust G2's Software Rankings:

  • 30 Analysts and Data Experts
  • 20,400+ Authentic Reviews
  • 697+ Products
  • Unbiased Rankings

G2's software rankings are built on verified user reviews, rigorous moderation, and a consistent research methodology maintained by a team of analysts and data experts. Each product is measured using the same transparent criteria, with no paid placement or vendor influence. While reviews reflect real user experiences, which can be subjective, they offer valuable insight into how software performs in the hands of professionals. Together, these inputs power the G2 Score, a standardized way to compare tools within every category.

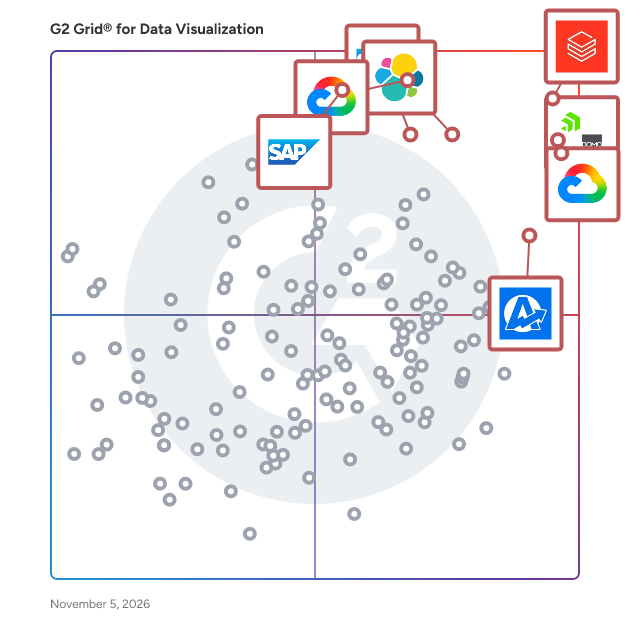
G2 Grid® for Data Visualization Tools

G2 Grid® for Data Visualization Tools plotting products by satisfaction and market presence

Highlighted products: Databricks, Domo, Looker, Data Studio, Elastic Stack, AgencyAnalytics, SAP HANA Cloud, and SAP Analytics Cloud.

Underlying data: [Grid® JSON](https://www.g2.com/categories/data-visualization-tools/grids.json?focus%5B%5D=databricks&focus%5B%5D=domo&focus%5B%5D=looker&focus%5B%5D=data-studio&focus%5B%5D=elastic-stack&focus%5B%5D=agencyanalytics&focus%5B%5D=sap-hana-cloud-2025-10-01&focus%5B%5D=sap-analytics-cloud)

Datafi

Datafi unlocks enterprise data with AI — changing how everyone can find and use the business information they need, regardless of where or how it is stored across the enterprise data ecosystem. Our AI-powered platform connects data from all sources, while our AI-powered Agent transforms plain language questions into requests that find the information needed, while enforcing granular security and data quality controls. We empower everyone, from entry-level to executive-level, with their own personalized AI Agent. Our AI Agent is context aware, intent aware, and user aware, becoming smarter with each use while eliminating unwanted hallucinations. Join Datafi customers, partners and solution providers already powering their business with AI. Learn more at datafi.co

Average Rating: 4.9/5.0

Total Reviews: 4

How Do G2 Users Rate Datafi?

  • Has the product been a good partner in doing business?: 9.6/10 (Category avg: 9.0/10)

Who Is the Company Behind Datafi?

  • Seller: Datafi
  • Year Founded: 2020
  • HQ Location: Seattle, US
  • LinkedIn® Page: www.linkedin.com
    15 employees on LinkedIn®

Who Uses This Product?

  • Company Size: 50% Large, 25% Medium

What Are Recent G2 Reviews of Datafi?

DataLakeHouse.io

DataLakeHouse is a 100% Snowflake-focused, advanced end-to-end Analytics platform that offers a suite of Data tools including ELT, industry-specific pre-built Models, Analytics combined with Machine Learning to offer Actionable Insights and Predictions for extremely effective business decision-making, and Managed Snowflake Support.

Average Rating: 4.3/5.0

Total Reviews: 4

How Do G2 Users Rate DataLakeHouse.io?

  • Has the product been a good partner in doing business?: 6.7/10 (Category avg: 9.0/10)

Who Is the Company Behind DataLakeHouse.io?

Who Uses This Product?

  • Company Size: 75% Large, 25% Medium

What Are Recent G2 Reviews of DataLakeHouse.io?

Datameer

Datameer revolutionizes data transformation with a low-code approach, trusted by top global enterprises. Craft, transform, and publish data seamlessly with no code and SQL, simplifying complex data engineering tasks. Empower your data teams to make informed decisions confidently while saving costs and ensuring responsible self-service analytics.

Average Rating: 4.2/5.0

Total Reviews: 24

How Do G2 Users Rate Datameer?

  • Has the product been a good partner in doing business?: 8.5/10 (Category avg: 9.0/10)

Who Is the Company Behind Datameer?

  • Seller: Datameer
  • Year Founded: 2009
  • HQ Location: San Francisco, CA
  • LinkedIn® Page: www.linkedin.com
    168 employees on LinkedIn®

Who Uses This Product?

  • Top Industries: Information Technology and Services
  • Company Size: 63% Large, 21% Medium

What Are Recent G2 Reviews of Datameer?

What Are G2 Users Discussing About Datameer?

AI can help you find the answers. G2 helps you trust them.

Connect G2 to Claude or ChatGPT for answers grounded in G2's trusted reviews, comparisons, and pricing from real user insights.

How it works

DataOwn

DataOwn offers a full Business Intelligence platform: connect easily to data from databases or behind apis. Transform data and make your semantic layer which stores definitions to be used in every dashboard. Then make dashboards in the easy to use editor, or - just as the transformations - use your AI agent for it. The dashboards offers lots of self service. The whole platform is both ready to start and ready to scale. DataOwn is a steward owned EU company, the whole product is an excellent choice for digital sovereignty.

Who Is the Company Behind DataOwn?

DataViRe

DataViRe is a powerful reporting automation tool built specifically for Grafana and Kibana. It converts dashboards into visually structured, professional grade reports and automatically delivers them to stakeholders on a scheduled basis via email, Slack, WhatsApp, Microsoft Teams, and more. Designed with operational teams in mind such as SIEM, SecOps, CyOps, DevOps, and ITOps DataViRe helps streamline reporting workflows so teams can stay focused on their core responsibilities. By automating the reporting process, DataViRe saves valuable time, reduces manual effort, and ensures consistent, reliable communication of critical insights.

Who Is the Company Behind DataViRe?

  • Seller: DataViRe
  • Year Founded: 2023
  • HQ Location: Madurai, IN
  • LinkedIn® Page: www.linkedin.com
    1 employees on LinkedIn®

Datylon

Design, create & share engaging, reusable, on-brand data stories. Datylon is a data visualization platform for designers and teams to create charts, graphs, reports, dashboards, infographics, and other data-rich visualizations. Create the most captivating on-brand data visualizations right within Adobe Illustrator®. Without coding. Boost your charting power with full freedom of design: add annotations, titles, or any illustration, and create stunning reports, inside the Adobe workflow. Design the most beautiful and engaging report templates and export them to the Datylon web app for the rest of the team to re-use. Datylon gives you full creative control with tons of styling options for charts. Datylon comes with a growing library of fully customizable charts to unleash your full creativity.

Who Is the Company Behind Datylon?

  • Seller: Datylon
  • Year Founded: 2013
  • HQ Location: Antwerp, BE
  • LinkedIn® Page: www.linkedin.com
    6 employees on LinkedIn®

Easy Reports & Data Export

Easy Reports & Data Export is a Built for Shopify app by DevCloud for building custom reports on your store’s orders, products, customers and inventory. Select any fields, apply filters and structure each report the way you need, or describe a report in plain English and let AI generate it instantly. Ready-made templates help you start fast and can be customized as needed. Reports can run automatically on a daily, weekly or monthly schedule and be delivered by email or exported to Google Sheets, Slack, Microsoft Teams, Zapier, Make or SFTP. Every plan includes all features, with pricing based on your Shopify plan (from $4.99/month) and a 7-day free trial.

Who Is the Company Behind Easy Reports & Data Export?

  • Seller: DevCloud
  • Year Founded: 2015
  • HQ Location: Newark, US
  • LinkedIn® Page: www.linkedin.com
    2 employees on LinkedIn®

EMASPHERE

EMASPHERE is the intelligent data foundation that modern businesses rely on every day. Finance and leadership teams at mid-market and multi-entity companies use EMASPHERE to bring fragmented financial and operational data into one trusted model. The platform connects to accounting, ERP, CRM, HR, payroll, banking and operational systems through 250+ connectors, then collects, cleans and models the data. Business logic, mappings and a semantic layer make sure every figure means the same thing across entities, departments and countries. On that foundation, teams work in four ways: - Explore: ask questions in plain language and analyze validated data with AI. - Structured reporting: KPI definitions, consolidation, validation and historization of each closing. - API: push clean, enriched data to the tools the company already uses. - Forecasting: budgets, forecasts and scenarios that share the same definitions as the actuals. More than 10,000 companies work on the platform, directly and through partners. EMASPHERE has offices in Ghent and Louvain-la-Neuve and serves companies across the Benelux, France and the UK.

Average Rating: 3.0/5.0

Total Reviews: 1

Who Is the Company Behind EMASPHERE?

  • Seller: EMASPHERE
  • Year Founded: 2015
  • HQ Location: Louvain-la-Neuve, BE
  • LinkedIn® Page: www.linkedin.com
    80 employees on LinkedIn®

Who Uses This Product?

  • Company Size: 100% Small

EquityRT

EquityRT is an innovative investment research platform that empowers finance and investment professionals with accurate data and intuitive tools to make research easier, faster and smarter. Get access to comprehensive global financial market data which includes rich fundamental analytics, shareholder analysis, stock estimates, sector analysis and much more. To complete your view of the world markets we have included access to global economic data for 200 countries in the same platform. It’s all about experience. With access to such a wide range of data, it is essential that you have the right tools on hand to analyze the data. Working with analysts across the globe, we have created a range of easy-to-use tools geared for analysis with speed and precision. Stay on top of your model portfolios, create eye-catching visualizations with advanced charting and grid capabilities, or do more advanced analysis using our excel addin. EquityRT - The easiest way to do investment research. Reach out to sales@equityrt.com for more information, or sign up for a free trial at equityrt.com.

Average Rating: 4.9/5.0

Total Reviews: 11

How Do G2 Users Rate EquityRT?

  • Has the product been a good partner in doing business?: 10.0/10 (Category avg: 9.0/10)

Who Is the Company Behind EquityRT?

  • Seller: EquityRT
  • Year Founded: 2018
  • HQ Location: Marietta, Georgia
  • LinkedIn® Page: www.linkedin.com
    42 employees on LinkedIn®

Who Uses This Product?

  • Company Size: 55% Small, 36% Medium

What Do G2 Reviewers Say About EquityRT?

AI-generated summary from verified user reviews

Pros
  • Users value the accuracy of EquityRT, finding it reliable for clear and easy comparisons of complex data.
  • Users value the effortless comparison capabilities of EquityRT, appreciating its clear layout and reliable data.
  • Users value the effortless data accessibility of EquityRT, making complex comparisons simple and reliable.
  • Users value the effortless comparison provided by EquityRT, as it presents complex data clearly and reliably.
  • Users appreciate the effortless comparison of companies and markets with clear, organized research data in EquityRT.
Cons
  • Users find that difficult learning is required to navigate EquityRT's many features effectively, which can be time-consuming.

What Are Recent G2 Reviews of EquityRT?

What Are G2 Users Discussing About EquityRT?

GraphAsk - Chat with your Data using AI

GraphAsk is an AI-powered tool that transforms your data into interactive dashboards and visual insights with just a few simple queries. Whether your data comes from Excel, CSV, or databases, GraphAsk makes it easy to understand and visualize complex information without needing technical skills. Just upload your data or connect to your database, ask your questions in plain language, and receive instant, actionable results. GraphAsk suggests the best charts and graphs based on your data — whether it's trends over time, comparisons across regions, or other patterns — and helps you make smarter, data-driven decisions faster.

Who Is the Company Behind GraphAsk - Chat with your Data using AI?

Hatica

Engineering Analytics to boost developer productivity -- Hatica equips engineering teams with work visibility dashboards, actionable insights, and effective workflows to drive team productivity and engagement in remote and in-office environments alike. Free forever plans to help you get started quickly.

Average Rating: 4.7/5.0

Total Reviews: 61

How Do G2 Users Rate Hatica?

  • Has the product been a good partner in doing business?: 9.1/10 (Category avg: 9.0/10)

Who Is the Company Behind Hatica?

  • Seller: Hatica
  • Year Founded: 2019
  • HQ Location: San Francisco, US
  • LinkedIn® Page: www.linkedin.com
    13 employees on LinkedIn®

Who Uses This Product?

  • Top Industries: Computer Software, Information Technology and Services
  • Company Size: 44% Small, 42% Medium

What Do G2 Reviewers Say About Hatica?

AI-generated summary from verified user reviews

Pros
  • Users value the robust breakdown of Dev metrics in Hatica, enhancing monitoring and improving team productivity.
  • Users value the effective tracking of Dev metrics, gaining actionable insights to enhance team performance and productivity.
  • Users appreciate the detailed productivity insights from Hatica, enhancing team performance and workflow management.
  • Users appreciate the seamless collaboration features of Hatica, which enhance productivity and streamline team communication.
  • Users appreciate the dashboard customization in Hatica, enabling tailored insights and improved team productivity analysis.
Cons
  • Users note the limited features of Hatica, indicating a need for more advanced options and user management capabilities.
  • Users often face poor customer support, leading to frustrations with data inaccuracies and necessary assistance for changes.
  • Users find the complex configuration challenging, especially when integrating multiple mobile apps into their tech stack.
  • Users report significant data inaccuracy due to sync problems, compounded by unresponsive customer support.
  • Users find the difficult configuration challenging, especially with multiple mobile apps integrated into their tech stack.

What Are Recent G2 Reviews of Hatica?

What Are G2 Users Discussing About Hatica?

i-net Clear Reports

i-net Clear Reports is a reporting and document generation platform for business reports, dashboards, and electronic invoices. It connects databases, files, and web services, supporting business users who need self-service reporting and developers who embed reporting into business applications. Users create ad hoc reports in the browser, with optional AI assistance. The i-net Designer desktop application combines drag-and-drop report design with more than 40 chart types, crosstabs, formulas, and conditional formatting. Existing Crystal Reports templates can be imported to reuse report designs. Dashboards bring reports, charts, and indicators together for shared overviews. Reports can be exported to PDF, Excel, DOCX, ODT, and CSV. An e-invoicing plugin generates ZUGFeRD/Factur-X and Peppol output. Java, .NET, and WebAPI interfaces integrate report generation into existing applications and automated workflows. The Plus edition adds Drive for storing and sharing reports, scheduled report processing, PDF signing, and advanced caching. Organizations can deploy the software on their own Windows, Linux, or macOS server or in their own cloud environment with the appropriate license. User and permission management controls access, with authentication options including LDAP, Active Directory, OAuth, and two-factor authentication. A 90-day trial is available. Version 26.10 adds direct ODT, Factur-X, and Peppol output through URL and API calls, with the e-invoicing plugin required for invoice formats. The Ad Hoc AI assistant can complete selected follow-up actions directly, and OneDrive integration extends Drive in the Plus edition.

Who Is the Company Behind i-net Clear Reports?

InstaCharts

InstaCharts is a powerful online chart maker designed to transform complex spreadsheets into professional, interactive visualizations in seconds. Built for businesses, web publishers, and researchers, it eliminates the learning curve of complex BI tools, offering a streamlined, no-code solution for data storytelling. Whether you are looking to embed live data into a website or generate high-resolution reports, InstaCharts bridges the gap between raw data and actionable insights. Some key features include: * Instant Data Import & Sync - Stop manually updating static images. InstaCharts supports CSV, Excel, and JSON uploads, but its standout feature is its Google Sheets integration. Connect a sheet once, and your published charts will automatically update whenever you modify your data source. * Smart Visualization Engine - The platform uses intelligent algorithms to analyze your dataset and recommend the best visualization type. Choose from over 10 varieties, including Bar, Line, Area, Scatterplot, Pie, Radar, and Heatmap charts. * Fully Interactive Embeds - Engage your audience with interactive charts rather than flat pictures. When you embed an InstaChart on your website (via a simple Iframe or script), users can hover to see exact values, toggle legends to filter data series, and zoom in on specific timelines. All charts are fully responsive, ensuring they look perfect on mobile and desktop devices. * Deep Customization - Maintain brand consistency with ease. InstaCharts allows you to customize color palettes, fonts, axis labels, and tooltips. You can also create reusable chart templates to speed up your workflow for recurring reports. * Versatile Sharing Options : Embed: Copy-paste code for WordPress, Ghost, or any HTML site. Export: Download high-quality PNG or SVG files for presentations and PDFs. Public/Private: Share public links for broad distribution or secure, password-protected links for internal stakeholders. Why Choose InstaCharts? Unlike traditional spreadsheet software that produces static, clunky graphs, InstaCharts is built for the modern web. It combines the power of a data visualization tool with an easy to use interface. With features like Zapier automation and Google Drive integration, it is the ideal tool for anyone needing to visualize data fast.

Who Is the Company Behind InstaCharts?

Keen.io

Keen.io is the complete event data management solution. Our platform can handle all aspects of your event data management, from collection to application. Stream, store, query, and present your data all in one place and get a competitive advantage over the competition. Keen allows you to get a true view of your product usage and interaction through event-based data. We make it easy to dive into the product data you need, allowing you to identify and solve product issues, enhance user experiences, and ship product rollouts faster.

Average Rating: 4.4/5.0

Total Reviews: 12

How Do G2 Users Rate Keen.io?

  • Has the product been a good partner in doing business?: 9.3/10 (Category avg: 9.0/10)

Who Is the Company Behind Keen.io?

  • Seller: Keen IO
  • Year Founded: 2011
  • HQ Location: San Antonio, Texas
  • LinkedIn® Page: www.linkedin.com
    18 employees on LinkedIn®

Who Uses This Product?

  • Top Industries: Computer Software
  • Company Size: 75% Small, 25% Medium

What Are Recent G2 Reviews of Keen.io?

What Are G2 Users Discussing About Keen.io?

Kyubit Business Intelligence

Kyubit Business Intelligence is a self-hosted BI and analytics platform for organizations that want secure, flexible reporting without relying on cloud-only infrastructure or per-user licensing. Kyubit connects directly to existing Microsoft SSAS / OLAP multidimensional and Tabular models, while also allowing organizations to turn SQL databases, Excel, and CSV data into analytics-ready semantic models using a visual, no-code modeling environment. Business users and analysts can quickly explore data with drag-and-drop grid analysis, drill-downs, slicers, calculated measures, time intelligence, ad hoc reporting, interactive dashboards, KPIs, and scheduled report delivery. Kyubit is designed for organizations that want to keep their analytics and business data within their own infrastructure while still providing modern self-service analytics across teams. Key capabilities include: • Self-hosted and on-premise BI deployment • Deep support for Microsoft SSAS / OLAP and Tabular models • Visual semantic modeling for SQL databases, Excel, and CSV data • Advanced grid analysis and ad hoc reporting • Interactive dashboards, charts, KPIs, and scorecards • Time intelligence and period comparison • Scheduled reports and email subscriptions • Embedded analytics using HTML and JavaScript • Role-based security and centralized governance • Multitenant deployment for serving multiple organizations • White-label options for enterprise deployments • Perpetual and annual subscription licensing Kyubit is particularly well suited to organizations already using Microsoft Analysis Services or relational databases that want to extend their existing data infrastructure with a lightweight, web-based analytics layer. Unlike many cloud BI platforms, Kyubit can be deployed entirely within the customer's own environment and uses server/edition-based licensing rather than requiring a separate cloud subscription for every report consumer. The result is a practical BI platform for self-service analytics, operational reporting, dashboarding, embedded BI, and governed enterprise analytics — while maintaining control over data, infrastructure, and licensing.

Average Rating: 4.4/5.0

Total Reviews: 12

How Do G2 Users Rate Kyubit Business Intelligence?

  • Has the product been a good partner in doing business?: 9.4/10 (Category avg: 9.0/10)

Who Is the Company Behind Kyubit Business Intelligence?

Who Uses This Product?

  • Company Size: 42% Medium, 42% Small

What Are Recent G2 Reviews of Kyubit Business Intelligence?

Bijou Barry
BB
Researched and written by Bijou Barry
Updated June 24, 2026