Best Data Preparation Tools and Software - Page 3

How Many Data Preparation Software Products Does G2 Track?

Total Products under this Category: 124

Category Stats (Sep 2026)

  • Average Rating: 4.53/5 (↑0.01 vs Aug 2026) The average rating of products in this category, based on all submitted ratings
  • Top Trending Product: Palantir Foundry (+1.94%) - Among all products in this category, Palantir Foundry recorded the largest rating increase compared to last month

Last updated: September 01, 2026

How Does G2 Rank Data Preparation Software Products?

Why You Can Trust G2's Software Rankings:

  • 30 Analysts and Data Experts
  • 11,800+ Authentic Reviews
  • 124+ Products
  • Unbiased Rankings

G2's software rankings are built on verified user reviews, rigorous moderation, and a consistent research methodology maintained by a team of analysts and data experts. Each product is measured using the same transparent criteria, with no paid placement or vendor influence. While reviews reflect real user experiences, which can be subjective, they offer valuable insight into how software performs in the hands of professionals. Together, these inputs power the G2 Score, a standardized way to compare tools within every category.

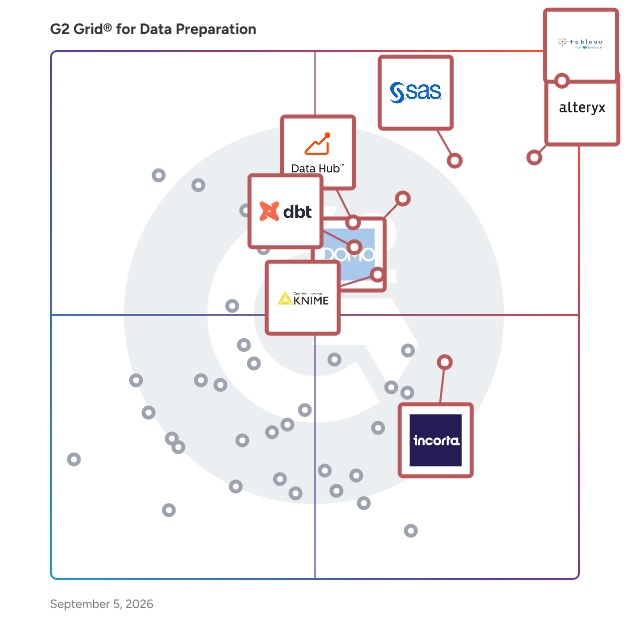
G2 Grid® for Data Preparation Software

G2 Grid® for Data Preparation Software plotting products by satisfaction and market presence

Highlighted products: Tableau, Alteryx, SAS Viya, Domo, HubSpot Data Hub, dbt, KNIME, and Incorta.

Underlying data: [Grid® JSON](https://www.g2.com/categories/data-preparation/grids.json?focus%5B%5D=tableau&focus%5B%5D=alteryx&focus%5B%5D=sas-sas-viya&focus%5B%5D=domo&focus%5B%5D=hubspot-data-hub&focus%5B%5D=dbt&focus%5B%5D=knime-analytics-platform&focus%5B%5D=incorta)

Omniscope Evo

Visokio builds Omniscope Evo, complete and extensible BI software for data processing, analytics and reporting. A smart experience on any device. Start from any data in any shape, load, blend, transform and explore it, extract insights through ML algorithms, then produce interactive reports and dashboards to share your findings. Omniscope is not only an all-in-one self-service BI tool with a responsive UX on all modern devices, but also a powerful and extensible platform: you can augment data workflows with Python / R scripts and enhance reports with any JS visualisation. Whether you’re a data manager, scientist or analyst, Omniscope is your complete solution: from data, through analytics to visualisation. 🧽 Data Prep, ETL: build workflows to load, stream, blend and transform any data. 🔍 Analytics: leverage machine learning, extract insights and perform visual exploration. 📊 Visualisation: design interactive reports, publish and share your results. 📜 Extensible: augment data pipelines with your Python / R scripts, enhance reports with any JS based visualisation. 🚀 Scalable: big data preparation and live query dashboards on SQL databases. 🤝 Collaboration: multi-user synchronised edits on workflows and dashboards. 🤖 Automation API: schedule parameterised data refresh & report updates, trigger tasks, alerts, edit & query data. 💐 Universal: a fresh and smart experience on any device: Windows, Mac, Linux, Android, iOS. 🏢 Deployment: on-premises or on your cloud. Built-in user permissions / OIDC / SSO 🎨 White-label: host branded data solutions and embedded analytics

Average Rating: 4.7/5.0

Total Reviews: 21

How Do G2 Users Rate Omniscope Evo?

  • Has the product been a good partner in doing business?: 9.5/10 (Category avg: 9.1/10)
  • Data Workflows: 9.7/10 (Category avg: 8.9/10)
  • Profiling and Classification: 8.5/10 (Category avg: 8.6/10)
  • Data Joining: 9.4/10 (Category avg: 8.9/10)

Who Is the Company Behind Omniscope Evo?

  • Seller: Visokio
  • Year Founded: 2002
  • HQ Location: London, GB
  • Twitter: @Visokio
    255 Twitter followers
  • LinkedIn® Page: www.linkedin.com
    9 employees on LinkedIn®

Who Uses This Product?

  • Top Industries: Information Technology and Services
  • Company Size: 65% Small, 17% Large

What Are Recent G2 Reviews of Omniscope Evo?

What Are G2 Users Discussing About Omniscope Evo?

TIMi

TIMi is the most efficient Data Science and Data Processing Platform. Since 2007, we have been creating and improving the most powerful framework to push the barriers of analytics, predictive analytics, AI and Big Data, while offering a helpful, fast and friendly environment. The TIMi Suite consists of four tools: 1. Anatella (Analytical ETL, Data Prep & Big Data), 2. Modeler (Auto-ML / Automated Predictive Modelling / Automated-AI), 3. StarDust (3D Segmentation) 4. Kibella (BI Dashboarding solution). TIMi dominates the Data Science market: In the "Summer 2022 - Momentum Report” from G2, in the “Data Science” category, TIMi has the #1 rank: TIMi is the Data Science solution with both the highest market growth and the highest customer-satisfaction! More about this subject here: https://timi.eu/blog/timi-the-number-one-data-science-platform/

Average Rating: 4.8/5.0

Total Reviews: 50

How Do G2 Users Rate TIMi?

  • Has the product been a good partner in doing business?: 9.1/10 (Category avg: 9.1/10)
  • Data Workflows: 9.0/10 (Category avg: 8.9/10)
  • Profiling and Classification: 8.5/10 (Category avg: 8.6/10)
  • Data Joining: 9.3/10 (Category avg: 8.9/10)

Who Is the Company Behind TIMi?

  • Seller: TIMi SPRL
  • Year Founded: 2007
  • HQ Location: Brussels
  • Twitter: @TIMiSuite
    3,532 Twitter followers
  • LinkedIn® Page: www.linkedin.com
    86 employees on LinkedIn®

Who Uses This Product?

  • Top Industries: Information Technology and Services, Banking
  • Company Size: 40% Small, 32% Large

What Do G2 Reviewers Say About TIMi?

AI-generated summary from verified user reviews

Pros
  • Users highlight the exceptional customer support from the TIMi team, noting their quick response times and helpfulness.
  • Users find TIMi easy to use, thanks to its intuitive design and quick learning curve.
  • Users appreciate TIMi's user-friendly interface and exceptional support, making data transformation quick and efficient.
  • Users value the fast and intuitive automation capabilities of TIMi, streamlining data transformations and analyses effectively.
  • Users value the intuitive charting features of TIMi, enabling efficient data visualization and analysis.

What Are Recent G2 Reviews of TIMi?

What Are G2 Users Discussing About TIMi?

Minitab Connect

Minitab Connect is a secure, cloud-based data integration and management platform that enables organizations to access, prepare, and combine data from across their business. It connects to a wide range of data sources such as databases, cloud applications, spreadsheets, and on-premise systems so that teams can create a single, reliable source of truth for analysis and reporting. With Minitab Connect, users can automate data pipelines, clean and transform data, and deliver ready-to-use datasets directly into Minitab solutions and other business tools. This helps eliminate manual data preparation, improve data accuracy, and accelerate time to insight, empowering teams to make faster, data-driven decisions.

Average Rating: 4.5/5.0

Total Reviews: 30

How Do G2 Users Rate Minitab Connect?

  • Has the product been a good partner in doing business?: 9.2/10 (Category avg: 9.1/10)
  • Data Workflows: 8.7/10 (Category avg: 8.9/10)
  • Profiling and Classification: 8.0/10 (Category avg: 8.6/10)
  • Data Joining: 8.3/10 (Category avg: 8.9/10)

Who Is the Company Behind Minitab Connect?

  • Seller: Minitab
  • Company Website:
  • Year Founded: 1972
  • HQ Location: State College, Pennsylvania, United States
  • Twitter: @Minitab
    5,017 Twitter followers
  • LinkedIn® Page: www.linkedin.com
    732 employees on LinkedIn®

Who Uses This Product?

  • Top Industries: Information Technology and Services
  • Company Size: 57% Large, 33% Medium

What Do G2 Reviewers Say About Minitab Connect?

AI-generated summary from verified user reviews

Pros
  • Users appreciate the ease of use of Minitab Connect, finding it accessible and intuitive for data analysis.
  • Users appreciate the efficient data integration of Minitab Connect, making seamless analysis and accessibility a breeze.
  • Users value the easy integrations of Minitab Connect, enhancing data access and efficiency across various sources.
  • Users value the seamless data integration and accessibility of Minitab Connect, enhancing their data analysis experience.
  • Users appreciate the efficiency of data integration with Minitab Connect, enabling seamless analysis and access to diverse sources.
Cons
  • Users face a high learning curve with Minitab Connect, requiring time and resources to master its features.
  • Users face a high learning difficulty with Minitab Connect, requiring time and patience to master the tool.
  • Users experience poor visualization with large datasets in Minitab Connect, finding it slow and challenging to use.
  • Users face visualization limitations with Minitab Connect, particularly regarding large datasets and complex transformations.
  • Users find the complexity of Minitab Connect frustrating, with slow transformations and a high cost relative to alternatives.

What Are Recent G2 Reviews of Minitab Connect?

What Are G2 Users Discussing About Minitab Connect?

Altair Monarch

An industry leader with over 30 years of experience in data discovery and transformation, Altair Monarch offers the fastest and easiest way to extract data from any source. Simple to construct workflows that require no coding enable users to collaborate as they transform difficult data such as PDFs spreadsheets, text files, as well as from big data and other structured sources, into rows and columns. Whether data is on premises or in the cloud, Altair can automate preparation tasks for expedited results and deliver data you trust for smart business decision making. To learn more about Altair Monarch or download a free version of its enterprise software, please click the links below.

Average Rating: 4.5/5.0

Total Reviews: 91

How Do G2 Users Rate Altair Monarch?

  • Has the product been a good partner in doing business?: 8.4/10 (Category avg: 9.1/10)
  • Data Workflows: 9.2/10 (Category avg: 8.9/10)
  • Profiling and Classification: 9.0/10 (Category avg: 8.6/10)
  • Data Joining: 9.1/10 (Category avg: 8.9/10)

Who Is the Company Behind Altair Monarch?

  • Seller: Altair
  • Year Founded: 1985
  • HQ Location: Troy, MI
  • LinkedIn® Page: www.linkedin.com
    2,630 employees on LinkedIn®
  • Ownership: NASDAQ:ALTR
  • Total Revenue (USD mm): $458

Who Uses This Product?

  • Top Industries: Financial Services, Hospital & Health Care
  • Company Size: 54% Large, 27% Medium

What Are Recent G2 Reviews of Altair Monarch?

What Are G2 Users Discussing About Altair Monarch?

Querri

Querri is your whole data stack in one platform: storage, preparation, analysis, and dashboards. Business teams ask questions in plain English and get answers grounded in their own data, with no SQL to write, no warehouse to provision, and no separate semantic layer to license. Querri manages every layer rather than sitting on top of one. A managed data lake and warehouse are built in, so there's nothing to provision. Cleaning, joins, dedupe, and type casting run as versioned, re-runnable work. Metrics, entities, and relationships are defined once, so a definition means the same thing in a chat answer, a dashboard, and an export. Connectors pull from databases, warehouses, CRMs, SaaS apps, files, and APIs on a schedule, including HubSpot, Salesforce, NetSuite, Google BigQuery, Amazon Redshift, PostgreSQL, MySQL, and Microsoft SQL Server. Querri can read from APIs where no native connector exists. The data library and semantic layer build themselves. Querri's agents connect your sources, clean and model the data, and define what your metrics mean, so the semantic layer is shaped by the people who know the business instead of waiting on an engineering project. It sharpens with every question your team asks. Results are inspectable. Every question generates and saves the underlying Python code, so an analysis can be refreshed, reused, and scheduled rather than rebuilt. You can read a step-by-step explanation of any answer, see the generated code, and check which calculations were applied. Dashboards stay connected to the analysis underneath, meaning any dashboard can become the starting point for a new question rather than just a fixed report. Governance is enforced everywhere. Querri is certified and audited against SOC 2, ISO 27001, and HIPAA. Access policies apply at the row and column level to every answer, including AI queries, so the assistant only ever sees exactly what the person asking it can see. Zero rows of customer data are ever used to train models, and your data, models, and business logic stay yours. Querri also works inside the AI-tools teams already use. A built-in MCP server brings governed Querri data into Claude, ChatGPT, or Gemini without moving data or the need to rebuild the analysis. For product teams and enterprises, Querri can be white-labeled and embedded inside your own application, with your branding, your context, and your access controls. Querri fits best for: - Business, finance, operations, and marketing teams - Organizations without a large data engineering function - Teams whose data lives across several disconnected systems - Buyers replacing a warehouse, a BI tool, and a semantic layer with one platform - Anyone who needs analyses to be transparent, governed, and repeatable

Average Rating: 4.0/5.0

Total Reviews: 12

How Do G2 Users Rate Querri?

  • Has the product been a good partner in doing business?: 7.8/10 (Category avg: 9.1/10)
  • Data Workflows: 7.2/10 (Category avg: 8.9/10)
  • Profiling and Classification: 7.3/10 (Category avg: 8.6/10)
  • Data Joining: 8.1/10 (Category avg: 8.9/10)

Who Is the Company Behind Querri?

  • Seller: Querri
  • Company Website:
  • Year Founded: 2023
  • HQ Location: Charleston, US
  • LinkedIn® Page: www.linkedin.com
    18 employees on LinkedIn®

Who Uses This Product?

  • Company Size: 58% Small, 33% Medium

What Do G2 Reviewers Say About Querri?

AI-generated summary from verified user reviews

Pros
  • Users appreciate the ease of use of Querri, finding it simple to interpret natural language queries effortlessly.
  • Users appreciate the natural language querying feature of Querri, making data insights easy to access and understand.
  • Users find Querri's interface intuitive, making it simple to interpret natural language queries effortlessly.
Cons
  • Users find the slow loading of Querri's data dashboarding features counterproductive, hindering efficient workflow with large datasets.
  • Users find the slow performance of Querri frustrating, especially due to its counterproductive two-step procedure.

What Are Recent G2 Reviews of Querri?

Datacoves

Datacoves is an enterprise DataOps platform with managed dbt Core and Airflow for data transformation and orchestration. We offer VS Code in the browser for dbt development with the ability to include preferred VS Code extensions and Python libraries such as the official Snowflake Extension and Snowpark. You may also optionally use our managed Airbyte and Superset for a full end-to-end solution.

Average Rating: 4.8/5.0

Total Reviews: 19

How Do G2 Users Rate Datacoves?

  • Has the product been a good partner in doing business?: 9.6/10 (Category avg: 9.1/10)
  • Data Workflows: 8.9/10 (Category avg: 8.9/10)
  • Profiling and Classification: 9.3/10 (Category avg: 8.6/10)
  • Data Joining: 9.4/10 (Category avg: 8.9/10)

Who Is the Company Behind Datacoves?

  • Seller: Datacoves Inc
  • Year Founded: 2021
  • HQ Location: Thousand Oaks, California
  • Twitter: @datacoves
    475 Twitter followers
  • LinkedIn® Page: www.linkedin.com
    12 employees on LinkedIn®

Who Uses This Product?

  • Company Size: 47% Large, 26% Medium

What Do G2 Reviewers Say About Datacoves?

AI-generated summary from verified user reviews

Pros
  • Users commend the ease of setup with Datacoves, appreciating its flexibility and responsive support during implementation.
  • Users appreciate the well-thought-out deployment system of Datacoves, which simplifies workflows and enhances team efficiency.
  • Users value the seamless integrations of Datacoves, enhancing collaboration and efficiency for data engineering teams.
  • Users commend the responsive and knowledgeable customer support of Datacoves, enhancing their implementation experience significantly.
  • Users commend Datacoves for providing exceptional data engineering tools, enhancing collaboration and data quality in organizations.
Cons
  • Users experience poor customer support due to lack of monitoring tools and assumptions about the default environment setup.
  • Users report alert overload, leading to challenges in managing system issues effectively without proper monitoring tools.
  • Users express a need for enhanced dashboard integrations to better monitor activity and manage service bottlenecks.
  • Users may find data limitations frustrating, as they feel constrained by the tools used for ELT integration.
  • Some users may feel frustrated by dependency on specific ELT tools, potentially limiting flexibility and choice.

What Are Recent G2 Reviews of Datacoves?

wynEnterprise

Discover the story behind your data with Wyn Enterprise. Wyn Enterprise is a seamless embedded business intelligence platform that provides BI reporting, interactive dashboards, scheduling, and distribution tools within any internal or commercial app. With easy-to-use designers, designed for self-service BI, Wyn offers limitless visual data exploration, allowing the everyday user to become data-driven while revealing trends and telling the story behind the data. Whether for your business or your commercial SaaS app, Wyn is an ideal solution for both. Embedded BI for your business provides a holistic view of your business and can lead to more insights, increased team collaboration, and overall business growth. Additionally, embedding Wyn in your SaaS app provides white-label reports and dashboards as part of your own app. Embed Wyn and empower your users with a seamless business intelligence solution. Features: • Seamlessly embedded Business Intelligence: Designed for embedded self-service BI, Wyn provides ad hoc reporting, interactive dashboards, scheduling, and distribution tools within any internal or commercial app. Our platform offers flexible deployment and integration. • Embedding BI with Wyn: Once installed, Wyn is 100% web-based. In your application, Wyn is embedded as a port to provide users the ability to easily create, design, share, export, and distribute dashboards and documents. Seamlessly embed Wyn via Rest API and DIV. Wyn also supports OEM installation and embedding. Additionally, you can integrate with development platforms such as Java, PHP, and .NET through GraphQL API. You can also embed inside customized .NET apps as well as JavaScript frameworks (Angular, React, Vue). • Self-service BI dashboard and reports: Eliminate your dependence on the IT departments and data analysts. Offer every end-user (from code-first to code-free) the ability to create custom ad hoc reports and interactive dashboards. Self-service BI allows users to run their own queries and create their own reports, even if they don’t have a background in statistical analysis, allowing them to turn data into valuable insights for better data driven decisions. • Data Monitoring: Create threshold based notifications and establish Wyn Alerts that are always on to monitor your data. Never miss an opportunity for improvement thanks to real-time monitoring and instant alerts. Integrate your push-notifications with the platform you use everyday - Slack, MS Teams, or email - ensuring that you never miss an alert. •Localization Support: With Custom Localization Support, you’re in control of your dashboard and report. Authors have the ability to localize titles and labels, text explanations, and data visualizations. There is more to localization than just translating words and sentences. Wyn’s custom localization also supports right to left (RTL) languages, regional language options, and number and date formats. •NEW! Natural Language Generation Text Scenario: Introducing InsightIQ, a revolutionary addition to our feature set that transforms the way you interact with your data. InsightIQ is a Natural Language Generation Text Scenario that takes data summarization and insights derivation to a whole new level. This powerful tool allows you to seamlessly distill the essence of your visuals into articulate and easy-to-understand natural language text, facilitating quick reviews and automatic insights extraction. • Built-in multi-tenant support: Wyn's multi-tenant capabilities provides a single centrally administered architecture to serve multiple customers (tenants). These tenants can be within an organization or different businesses, with all its data stored in the SaaS system. Data privacy and securing the data from other tenants are both critical in these deployment scenarios • Date governance and modeling: Wyn allows you to secure and model your raw data. With easy-to-use dashboard and report designers in the same web-based application, end-users can develop their own ad-hoc dashboards and reports based on the secured data. Wyn also allows allows admins to model business data in a structure familiar to users. • Extensible security: Wyn provides extensible security to match your access control needs. Filter and segregate your data and limit your tenant-specific data with the configurable role-based security and user-context definitions. User contexts provide row-level data security in a document or database-level security for a data source. User context acts as an additional layer of data security, extending the role-based security. • Specialized web portals: The software comes with three portals, the document portal; for business end-users, dashboard, and report authors, the admin portal; for admins that configure the server, manage account and security settings, and the resource portal; for data administrators or IT teams. • Pixel-perfect reports: For power users and business users, the report designer tools can help in developing pixel-perfect operational reports, as well as in creating invoices, letters, and account statements among many others. The software further allows you to use ad hoc reporting or the standard enterprise reports. • Efficient Report Sharing: The software also allows you to schedule automated delivery of reports to be sent to your team’s emails. File sharing in various document formats is also supported. Additionally, you can collaborate with your team on report and dashboard designs, and you can share the published versions with others in your enterprise. • Centralized storage; Apart from being a secured platform, Wyn Enterprise also provides centralized storage for all your reports, images, datasets, and configuration settings. Other server resources, such as dashboards, themes, models, users, and roles, are also stored in the same place. The software also allows you to compile data from relational databases, local Excel or CSV files, web sources, and NoSQL data sources. Say Goodbye to User Fees You need a scalable BI platform. You also need to know how much it will cost in the long run. Wyn's scalable licensing model allows room for your business to grow without growth in licensing fees. • No per-user fees • No limits on data size 20+ Years in the Industry Unleash the full potential of embedded ad hoc reporting, driven by the same ActiveReports engine that has led the industry for 20+ years.

Average Rating: 4.7/5.0

Total Reviews: 38

How Do G2 Users Rate wynEnterprise?

  • Has the product been a good partner in doing business?: 9.7/10 (Category avg: 9.1/10)

Who Is the Company Behind wynEnterprise?

  • Seller: wynEnterprise LLC
  • Company Website:
  • Year Founded: 2018
  • HQ Location: 7400 Beaufont Springs Dr., St 300, Richmond VA 23225
  • LinkedIn® Page: www.linkedin.com
    28 employees on LinkedIn®

Who Uses This Product?

  • Top Industries: Information Technology and Services
  • Company Size: 53% Small, 37% Medium

What Do G2 Reviewers Say About wynEnterprise?

AI-generated summary from verified user reviews

Pros
  • Users appreciate the excellent customer support of wynEnterprise, ensuring effective problem resolution and user satisfaction.
  • Users find wynEnterprise to be easy to use, allowing for quick implementation and impressive data visualizations.
  • Users love the flexibility of wynEnterprise, enabling tailored solutions and easy integration with existing systems.
  • Users value the impressive reporting and analytics capabilities of wynEnterprise, making it effective for various business needs.
  • Users value the high level of customization in wynEnterprise, enabling precise branding and tailored data visuals.
Cons
  • Users find the documentation lacking, making it challenging to navigate the system's in-depth options effectively.
  • Users find the complexity of wynEnterprise challenging, with a steep learning curve and the need for better documentation.
  • Users find the lack of detailed instructions for upgrades frustrating, impacting the overall experience with wynEnterprise.
  • Users express concern over the lack of documentation and features, suggesting it limits the product's potential and usability.
  • Users face challenges with update issues, requiring time-consuming backups before applying updates to Wyn Enterprise.

What Are Recent G2 Reviews of wynEnterprise?

What Are G2 Users Discussing About wynEnterprise?
Toad Data Point

Seamlessly access more than 50 data sources both on premises and in the cloud and switch between these data sources with near-zero transition times. Connect, query and prepare data for faster business insights. Easy data profiling and cleansing, simplified data federation slashes up to 50 percent of your time to routine data delivery and enables you to take a huge leap in being more data driven.

Average Rating: 4.0/5.0

Total Reviews: 21

How Do G2 Users Rate Toad Data Point?

  • Has the product been a good partner in doing business?: 7.1/10 (Category avg: 9.1/10)

Who Is the Company Behind Toad Data Point?

  • Seller: Quest Software
  • Year Founded: 1987
  • HQ Location: Austin, TX
  • Twitter: @Quest
    17,109 Twitter followers
  • LinkedIn® Page: www.linkedin.com
    3,507 employees on LinkedIn®
  • Ownership: NYSE: DGX

Who Uses This Product?

  • Company Size: 62% Large, 33% Medium

What Are Recent G2 Reviews of Toad Data Point?

EasyMorph

EasyMorph is a visual, no-code data automation tool designed to empower both business users and data engineers by simplifying complex data transformation and automation tasks. With its intuitive drag-and-drop interface, EasyMorph enables users to design and execute powerful data workflows without the need for programming skills. This approach significantly reduces reliance on IT departments and accelerates data processing, making it an ideal solution for organizations aiming to enhance their data productivity. Key Features and Functionality: - Drag-and-Drop Interface: Allows users to create data workflows effortlessly by dragging actions onto tables, facilitating easy data manipulation and transformation. - Extensive Action Library: Offers over 180 built-in actions, including data transformations, automation tasks, and integrations, enabling the handling of complex data scenarios. - Enterprise Integrations: Provides more than 50 integrations with various databases, cloud services, and business applications, ensuring seamless connectivity across platforms. - Advanced Automation Capabilities: Supports loops, conditions, and parameters to automate repetitive tasks such as file operations, email notifications, and web requests. - Comprehensive Data Visibility: Features built-in data profiling and analysis tools, allowing users to inspect and validate data at every step of the workflow. - In-Memory Processing Engine: Utilizes a proprietary in-memory columnar engine for fast and efficient data processing without the need for external databases. Primary Value and Problem Solved: EasyMorph addresses the common challenge of time-consuming and error-prone manual data processing by providing a user-friendly platform that automates data preparation and transformation tasks. By enabling non-technical users to perform complex data operations without coding, EasyMorph reduces dependency on IT resources, accelerates decision-making processes, and enhances overall data productivity within organizations. Its emphasis on data privacy ensures that sensitive information remains within the user's control, as all processing occurs locally without data leaving the user's environment.

Average Rating: 4.1/5.0

Total Reviews: 13

How Do G2 Users Rate EasyMorph?

  • Has the product been a good partner in doing business?: 9.6/10 (Category avg: 9.1/10)
  • Data Workflows: 8.5/10 (Category avg: 8.9/10)
  • Profiling and Classification: 8.0/10 (Category avg: 8.6/10)
  • Data Joining: 8.3/10 (Category avg: 8.9/10)

Who Is the Company Behind EasyMorph?

  • Seller: EasyMorph
  • Year Founded: 2014
  • HQ Location: Toronto, Ontario
  • Twitter: @easy_morph
    246 Twitter followers
  • LinkedIn® Page: www.linkedin.com
    12 employees on LinkedIn®

Who Uses This Product?

  • Company Size: 57% Medium, 36% Small

What Do G2 Reviewers Say About EasyMorph?

AI-generated summary from verified user reviews

Pros
  • Users commend EasyMorph for its excellent data quality, efficiently handling large CSV files with ease and stability.
  • Users value the ease of use in EasyMorph, enabling efficient processing of large CSV files effortlessly.
  • Users praise EasyMorph for its fast and stable performance, effectively handling large CSV files with ease.
  • Users highlight EasyMorph as a powerful ETL tool, excelling in speed and stability for large CSV files.
Cons
  • Users face system instability due to the lack of support for Linux and MacOS, limiting flexibility and usability.

What Are Recent G2 Reviews of EasyMorph?

Datameer

Datameer revolutionizes data transformation with a low-code approach, trusted by top global enterprises. Craft, transform, and publish data seamlessly with no code and SQL, simplifying complex data engineering tasks. Empower your data teams to make informed decisions confidently while saving costs and ensuring responsible self-service analytics.

Average Rating: 4.2/5.0

Total Reviews: 24

How Do G2 Users Rate Datameer?

  • Has the product been a good partner in doing business?: 8.5/10 (Category avg: 9.1/10)
  • Data Workflows: 7.7/10 (Category avg: 8.9/10)
  • Profiling and Classification: 8.3/10 (Category avg: 8.6/10)
  • Data Joining: 9.0/10 (Category avg: 8.9/10)

Who Is the Company Behind Datameer?

  • Seller: Datameer
  • Year Founded: 2009
  • HQ Location: San Francisco, CA
  • Twitter: @datameer
    11,208 Twitter followers
  • LinkedIn® Page: www.linkedin.com
    169 employees on LinkedIn®

Who Uses This Product?

  • Top Industries: Information Technology and Services
  • Company Size: 63% Large, 21% Medium

What Are Recent G2 Reviews of Datameer?

What Are G2 Users Discussing About Datameer?

IBM Databand

Detect and resolve your data issues faster than ever with Databand. The only continuous data observability platform that catches bad data before it impacts your business. Book a demo today --> https://www.ibm.com/account/reg/us-en/signup?formid=DEMO-dataaidataband CORE CAPABILITIES Incident Management Improve data reliability and quality under one roof with a single pane of glass for all your data incidents. Data Reliability Monitoring Monitor data pipeline errors such as failed runs, longer than expected durations, missing data operations, and unexpected schema changes. Data Quality Metrics Continuously validate data quality with dataset metrics for SLAs, column changes, and null records. Anomaly Detection Eliminate the unknown by seeing trends & detecting anomalies from your metadata in real time. DataOps Alerting and Routing Customize incident alerts and route notifications to impacted DataOps teams for faster resolution. End-to-end Lineage Visualize how data incidents impact upstream and downstream components of your data stack. Website www.ibm.com/products/databand

Average Rating: 4.3/5.0

Total Reviews: 65

How Do G2 Users Rate IBM Databand?

  • Has the product been a good partner in doing business?: 8.3/10 (Category avg: 9.1/10)
  • Data Workflows: 8.8/10 (Category avg: 8.9/10)
  • Profiling and Classification: 8.3/10 (Category avg: 8.6/10)
  • Data Joining: 8.8/10 (Category avg: 8.9/10)

Who Is the Company Behind IBM Databand?

  • Seller: IBM
  • Year Founded: 1911
  • HQ Location: Armonk, New York, United States
  • Twitter: @IBMSecurity
    74,660 Twitter followers
  • LinkedIn® Page: www.linkedin.com
    344,328 employees on LinkedIn®
  • Ownership: SWX:IBM

Who Uses This Product?

  • Who Uses This: Software Engineer, Data Analyst
  • Top Industries: Information Technology and Services, Computer Software
  • Company Size: 44% Medium, 33% Large

What Do G2 Reviewers Say About IBM Databand?

AI-generated summary from verified user reviews

Pros
  • Users appreciate the automated anomaly detection in IBM Databand, enhancing insights and monitoring capabilities effortlessly.
  • Users appreciate the end-to-end visibility offered by IBM Databand, simplifying ETL development and root cause analysis.
  • Users appreciate the automation features of IBM Databand, simplifying data management and enhancing workflow efficiency.
  • Users enjoy the dashboard customization in IBM Databand, facilitating ease of use and key metrics accessibility.
  • Users value the data management capabilities of IBM Databand, enabling efficient monitoring and error handling in data pipelines.
Cons
  • Users experience limited features, noting high pricing and a steep learning curve for new users.
  • Users find the pricing high for smaller teams, which can limit accessibility and overall value.
  • Users face integration issues with IBM Databand, finding limited compatibility with third-party services and complex navigation challenges.
  • Users face a steep learning curve with IBM Databand, making onboarding and navigation challenging for newcomers.
  • Users find missing features like self error resolution and limited integrations hinder their overall experience with IBM Databand.

What Are Recent G2 Reviews of IBM Databand?

Lightly

Lightly helps machine learning teams to build better models through better data. It allows companies to select the right data for model training by using active learning. Intelligently select the best samples for model training through advanced filtering and active-learning algorithms. Balance your class distributions, remove redundancies and dataset bias. Label only the best data for model training until you reach your target accuracy. Analyze the quality and diversity of your datasets. Better understand your data with Lightly's holistic views from the big picture down to the smallest nuances of your data. Uncover class distributions, dataset gaps, and representation biases before labeling to save time and money. Monitor your model performance in production. Spot outliers and failure cases. Select out-of-distribution data directly on the edge or cloud. Send data back for retraining and updating the model. Manage your dataset. Track different versions, and once your dataset is ready, simply share with labeling with the click of a button. That's Lightly: The end-to-end active learning solution.

Average Rating: 4.4/5.0

Total Reviews: 14

How Do G2 Users Rate Lightly?

  • Has the product been a good partner in doing business?: 7.5/10 (Category avg: 9.1/10)
  • Data Workflows: 9.3/10 (Category avg: 8.9/10)
  • Profiling and Classification: 8.3/10 (Category avg: 8.6/10)
  • Data Joining: 8.6/10 (Category avg: 8.9/10)

Who Is the Company Behind Lightly?

  • Seller: Lightly
  • Year Founded: 2019
  • HQ Location: Zurich, CH
  • LinkedIn® Page: www.linkedin.com
    36 employees on LinkedIn®

Who Uses This Product?

  • Company Size: 57% Medium, 29% Small

What Do G2 Reviewers Say About Lightly?

AI-generated summary from verified user reviews

Pros
  • Users find AI modeling capabilities invaluable for enhancing data labeling and improving AI training efficiency.
  • Users praise the performance speed of Lightly, ensuring quick data processing and efficient AI model training.
  • Users find that Lightly provides high-quality data selection, which enhances AI learning efficiency and effectiveness.
  • Users value the learning enhancement provided by Lightly, as it improves AI performance through quality data selection.
  • Users love the time-saving aspects of Lightly, with quick responses that enhance efficiency and reduce costs.
Cons
  • Users report a learning difficulty with Lightly, particularly for newcomers struggling to select quality data.
  • Users find the limited customization of Lightly frustrating, as it impacts adaptability and accuracy in responses.

What Are Recent G2 Reviews of Lightly?

Coginiti

Coginiti is a SQL-first collaborative data operations platform that empowers teams to build, publish, and consume quality data products, streamlining the data analytics lifecycle from inception to insights. Integrating with the widest variety of data platforms and tools, Coginiti enables analysts, engineers, and data scientists to collaborate in real-time, breaking down silos and fostering innovation. Its intuitive interface simplifies managing complex data workflows, ensuring governance and consistency across projects. Key Features: - Realtime Collaboration - Flexible Data Modeling - Data Quality Testing - Visualize Data Lineage - Native Scheduling - Powerful APIs - AI Assistant Coginiti facilitates a seamless transition from data preparation to actionable intelligence. It’s not just about refining your data strategy or scaling your analytics capabilities; it’s about empowering your organization to harness the full potential of data for informed decision-making. Discover the power of Coginiti and transform your data operations. Coginiti offers products for individual analysts, data teams, and enterprises.

Average Rating: 4.5/5.0

Total Reviews: 29

How Do G2 Users Rate Coginiti?

  • Has the product been a good partner in doing business?: 8.3/10 (Category avg: 9.1/10)

Who Is the Company Behind Coginiti?

  • Seller: Coginiti Corp
  • Year Founded: 2020
  • HQ Location: Atlanta , GA
  • Twitter: @coginiti
    71 Twitter followers
  • LinkedIn® Page: www.linkedin.com
    32 employees on LinkedIn®

Who Uses This Product?

  • Company Size: 66% Large, 28% Medium

What Are Recent G2 Reviews of Coginiti?

What Are G2 Users Discussing About Coginiti?

Prophecy

Prophecy is the agentic data prep and analysis platform that introduces a new data lifecycle—generate, refine, deploy—where AI agents and data teams collaborate through visual, code, and document interfaces to accelerate work and deliver trusted pipelines to production. Leading enterprises rely on Prophecy to power their most demanding data workloads. - Generate a first draft in minutes: Prophecy’s AI agents, built on specialized Claude Code, are experts at generating workflows for your data, accelerating tasks like data transformation and automating others like documentation. - Refine with ease and speed: Our visual analytics workflows (or code, document formats) enable users to quickly understand the AI generated output, and to refine them to 100% complete. Deploy robustly: We provide robust deployment to production built on software best practices. The deployed workflows run at scale, with governance, on your cloud data platform. What are the key features of Prophecy? - Market Leading Data Agents: Specialized Claude Code based AI agents that understand your data and apply data specific skills to generate the best results. - Visual Inspect & Refine: AI generates results as visual data workflows, so business users can quickly inspect the logic, refine it to match their intent, and validate the final output. - Integrated Data Execution: You schedule and monitor workflows. Each reads/writes data using built-in high-performance connectors, and run transforms in Prophecy or your SQL or Spark platforms. - Complete Data Lifecycle: The visual workflows can be deployed to production as high-performance code that runs at scale with governance on Databricks, Snowflake or BigQuery that can be shared. Prophecy finds application across industries such as finance, healthcare, and retail, where data-driven decisions are crucial. Analysts become more productive, and business users now self-serve. Learn more at https://www.prophecy.ai/

Average Rating: 4.6/5.0

Total Reviews: 31

How Do G2 Users Rate Prophecy?

  • Has the product been a good partner in doing business?: 9.3/10 (Category avg: 9.1/10)

Who Is the Company Behind Prophecy?

  • Seller: Prophecy
  • Year Founded: 2017
  • HQ Location: Palo Alto, CA
  • Twitter: @Prophecy_io
    370 Twitter followers
  • LinkedIn® Page: www.linkedin.com
    173 employees on LinkedIn®

Who Uses This Product?

  • Who Uses This: Senior Data Engineer
  • Top Industries: Financial Services, Insurance
  • Company Size: 68% Large, 19% Medium

What Do G2 Reviewers Say About Prophecy?

AI-generated summary from verified user reviews

Pros
  • Users find Prophecy's ease of use appealing, thanks to its elegant UI and flexible, low-code features.
  • Users value the high-quality code generation of Prophecy, enhancing productivity and simplifying data pipeline design.
  • Users value the exceptional customer support from Prophecy, appreciating timely assistance and knowledgeable staff for technical issues.
  • Users commend Prophecy for its powerful data pipeline features, enhancing productivity and simplifying complex ETL processes.
  • Users benefit from the automation in Prophecy, simplifying pipeline design and enhancing collaboration throughout the process.
Cons
  • Users note feature limitations, including missing complex extensions and a slow interface that hinder overall usability.
  • Users find the learning curve steep, requiring time to master Prophecy's interface and best practices for optimized pipelines.
  • Users express concerns over missing features in Prophecy, highlighting the need for better customization and data source support.
  • Users note a steep learning curve with Prophecy, requiring time to master best practices for optimized pipelines.
  • Users find the difficulty in identifying root causes and understanding syntax a barrier to effectively using Prophecy.

What Are Recent G2 Reviews of Prophecy?

Anzo

Altair® Graph Studio™ (formerly Anzo) is a comprehensive data discovery and integration toolset that applies a semantic, graph-based data fabric layer over diverse enterprise data sources. This semantic layer adds real-world meaning to data – structured and unstructured alike – making insights clearer and previously unseen connections explicit. Graph Studio creates a single pane of glass for an enterprise's data, eliminates data silos, activates unused data, and enables exciting new levels of on-demand business insight.

Average Rating: 4.3/5.0

Total Reviews: 11

How Do G2 Users Rate Anzo?

  • Data Workflows: 10.0/10 (Category avg: 8.9/10)
  • Profiling and Classification: 9.7/10 (Category avg: 8.6/10)
  • Data Joining: 9.0/10 (Category avg: 8.9/10)

Who Is the Company Behind Anzo?

Who Uses This Product?

  • Company Size: 45% Small, 36% Medium

What Are Recent G2 Reviews of Anzo?

Shalaka Joshi
SJ
Researched and written by Shalaka Joshi
Updated October 29, 2024