Best Application Performance Monitoring (APM) Tools for Medium-Sized Businesses - Page 4

How Many Application Performance Monitoring (APM) Tools Products Does G2 Track?

Total Products under this Category: 227

Category Stats (Sep 2026)

  • Average Rating: 4.44/5 The average rating of products in this category, based on all submitted ratings
  • Top Trending Product: BMC Helix Operations Management with AIOps (+10.34%) - Among all products in this category, BMC Helix Operations Management with AIOps recorded the largest rating increase compared to last month

Last updated: September 01, 2026

How Does G2 Rank Application Performance Monitoring (APM) Tools Products?

Why You Can Trust G2's Software Rankings:

  • 30 Analysts and Data Experts
  • 16,600+ Authentic Reviews
  • 227+ Products
  • Unbiased Rankings

G2's software rankings are built on verified user reviews, rigorous moderation, and a consistent research methodology maintained by a team of analysts and data experts. Each product is measured using the same transparent criteria, with no paid placement or vendor influence. While reviews reflect real user experiences, which can be subjective, they offer valuable insight into how software performs in the hands of professionals. Together, these inputs power the G2 Score, a standardized way to compare tools within every category.

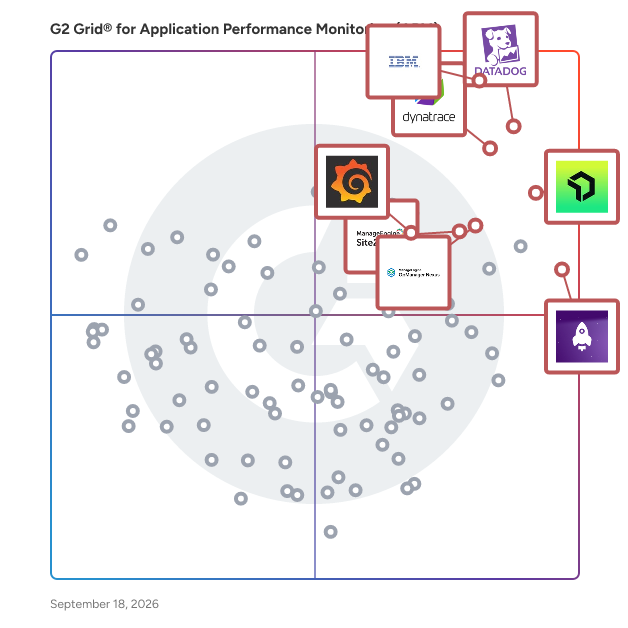
G2 Grid® for Application Performance Monitoring (APM) Tools

G2 Grid® for Application Performance Monitoring (APM) Tools plotting products by satisfaction and market presence

Highlighted products: Datadog, IBM Instana, New Relic, LogRocket, OpManager Nexus, Grafana Labs, Site24x7, and Dynatrace.

Underlying data: [Grid® JSON](https://www.g2.com/categories/application-performance-monitoring-apm/grids.json?focus%5B%5D=datadog&focus%5B%5D=ibm-instana&focus%5B%5D=new-relic&focus%5B%5D=logrocket&focus%5B%5D=opmanager-nexus&focus%5B%5D=grafana-labs&focus%5B%5D=site24x7&focus%5B%5D=dynatrace&segment=mid-market)

OpenText SiteScope

Micro Focus SiteScope is an agentless application monitoring software that provides heterogeneous and hybrid support, quick time to value, and ease of installation, configuration, and use.

Average Rating: 4.0/5.0

Total Reviews: 24

How Do G2 Users Rate OpenText SiteScope?

  • Performance Metrics: 9.2/10 (Category avg: 8.3/10)
  • Root Cause Analysis (RCA): 9.6/10 (Category avg: 8.4/10)
  • Real User Monitoring (RUM): 9.3/10 (Category avg: 8.3/10)
  • Has the product been a good partner in doing business?: 8.2/10 (Category avg: 8.9/10)

Who Is the Company Behind OpenText SiteScope?

  • Seller: OpenText
  • Year Founded: 1991
  • HQ Location: Waterloo, ON
  • Twitter: @OpenText
    21,565 Twitter followers
  • LinkedIn® Page: www.linkedin.com
    22,835 employees on LinkedIn®
  • Ownership: NASDAQ:OTEX

Who Uses This Product?

  • Top Industries: Information Technology and Services, Banking
  • Company Size: 48% Large, 35% Medium

What Are Recent G2 Reviews of OpenText SiteScope?

What Are G2 Users Discussing About OpenText SiteScope?

NETSCOUT Network & Application Observability

NETSCOUT’s Network & Application Observability solution is engineered for IT practitioners who need deep, real-time visibility into complex hybrid environments. Whether you're managing a sprawling data center, a multi-cloud deployment, 5G deployment, or a remote workforce, this solution delivers the actionable intelligence required to maintain performance, availability, and user experience across every layer of your infrastructure. At its core, NETSCOUT leverages Deep Packet Inspection (DPI) to convert raw network traffic into smart data. This allows IT teams to monitor application behavior, network performance, and service dependencies with precision, even in containerized environments. The result is a unified, end-to-end view that helps you quickly isolate root causes, reduce mean time to knowledge (MTTK), and proactively resolve issues before they impact users or business operations. What sets NETSCOUT apart is its ability to scale observability across both legacy and modern architectures without requiring intrusive agents or instrumentation. It integrates seamlessly with existing workflows and tools, providing consistent visibility whether you're troubleshooting a VoIP degradation, tracking down a cloud latency spike, or validating the performance of a new application rollout. For IT professionals tasked with ensuring uptime and optimizing digital experiences, NETSCOUT’s observability platform is not just a monitoring tool—it’s a strategic asset that transforms packet-level data into operational intelligence. Products included in this solution: - nGeniusONE - InfiniStreamNG - vSTREAM - Packet Flow Switches (PFS) and TAPs

Average Rating: 4.5/5.0

Total Reviews: 96

How Do G2 Users Rate NETSCOUT Network & Application Observability?

  • Performance Metrics: 8.3/10 (Category avg: 8.3/10)
  • Root Cause Analysis (RCA): 8.8/10 (Category avg: 8.4/10)
  • Has the product been a good partner in doing business?: 7.2/10 (Category avg: 8.9/10)

Who Is the Company Behind NETSCOUT Network & Application Observability?

  • Seller: NETSCOUT
  • Company Website:
  • Year Founded: 1984
  • HQ Location: Westford, Mass.
  • Twitter: @NETSCOUT
    13,759 Twitter followers
  • LinkedIn® Page: www.linkedin.com
    2,710 employees on LinkedIn®

Who Uses This Product?

  • Top Industries: Telecommunications, Financial Services
  • Company Size: 39% Large, 31% Medium

What Do G2 Reviewers Say About NETSCOUT Network & Application Observability?

AI-generated summary from verified user reviews

Pros
  • Users value the comprehensive visibility NETSCOUT provides, enabling swift issue resolution and enhanced performance monitoring.
  • Users value the issue detection capabilities of NETSCOUT, enabling swift resolution of performance bottlenecks and disruptions.
  • Users value the comprehensive visibility NETSCOUT provides, enabling swift identification and resolution of performance issues.
  • Users value the reliability of NETSCOUT Network & Application Observability for proactive troubleshooting and insightful network management.
  • Users find NETSCOUT Network & Application Observability to be user-friendly, facilitating easy setup and efficient diagnosis of network issues.
Cons
  • Users face a steep learning curve with NETSCOUT, leading to implementation challenges and requiring specialized knowledge.
  • Users experience complexity in implementing NETSCOUT, facing a steep learning curve and integration challenges.
  • Users face a difficult learning curve with NETSCOUT, finding the complexity challenging to manage and comprehend.
  • Users find the complex setup challenging, requiring specialized knowledge and time for new team members to adapt.
  • Users highlight the complex configuration process and the steep learning curve for new team members, complicating implementation.

What Are Recent G2 Reviews of NETSCOUT Network & Application Observability?

Rigor

Rigor helps businesses of all sizes enable fast and reliable digital experiences for their end users. With Rigor’s easy-to-use performance monitoring and optimization software, our customers are able to monitor their user’s experience throughout the development lifecycle, communicate trends to stakeholders, and take action to improve performance by leveraging our step-by-step optimization insights.

Average Rating: 4.7/5.0

Total Reviews: 22

How Do G2 Users Rate Rigor?

  • Has the product been a good partner in doing business?: 9.5/10 (Category avg: 8.9/10)

Who Is the Company Behind Rigor?

  • Seller: Rigor
  • HQ Location: Atlanta, GA
  • Twitter: @TeamRigor
    4,309 Twitter followers
  • LinkedIn® Page: www.linkedin.com
    8 employees on LinkedIn®

Who Uses This Product?

  • Top Industries: Retail
  • Company Size: 43% Medium, 35% Large

What Are Recent G2 Reviews of Rigor?

Stackify APM

Stackify Retrace is a comprehensive application performance management (APM) solution designed to assist developers and IT teams in monitoring, diagnosing, and optimizing their applications throughout the entire software development lifecycle. By providing insights into application performance and server metrics, Retrace enables users to identify issues proactively, ensuring smoother deployments and enhanced application reliability. This APM tool is particularly beneficial for software development teams, system administrators, and DevOps professionals who need to maintain high levels of application performance. With its ability to aggregate logs from various logging frameworks, Retrace allows users to pinpoint exceptions and errors in their code efficiently. This capability is essential for teams that are focused on delivering quality software while minimizing downtime and performance bottlenecks. Retrace stands out in its category by offering a suite of features that cater to the diverse needs of its users. The advanced deployment reporting feature provides detailed insights into application performance during and after deployment, allowing teams to make informed decisions about their release strategies. Additionally, the detailed SQL query monitoring enables users to optimize database interactions, which is crucial for applications that rely heavily on data retrieval and manipulation. The integrated logging and profiling capabilities ensure that all relevant information is accessible in one centralized location, streamlining the troubleshooting process. One of the key advantages of Stackify Retrace is its commitment to user accessibility. With unlimited user support, teams can collaborate effectively without worrying about additional licensing costs. The software's full lifecycle coverage means that it supports users from pre-production through to deployment, making it a versatile tool for various stages of application development. Furthermore, the promise of a one-hour support response time ensures that users receive timely assistance when they encounter challenges, helping to maintain productivity and reduce frustration. Overall, Stackify Retrace is a robust APM solution that empowers development teams to enhance their applications' performance and reliability. By combining advanced monitoring features with a user-friendly interface and responsive support, Retrace helps organizations minimize the risk of application failures and maximize the efficiency of their development processes.

Average Rating: 4.2/5.0

Total Reviews: 56

How Do G2 Users Rate Stackify APM?

  • Performance Metrics: 4.2/10 (Category avg: 8.3/10)
  • Root Cause Analysis (RCA): 8.3/10 (Category avg: 8.4/10)
  • Real User Monitoring (RUM): 4.2/10 (Category avg: 8.3/10)
  • Has the product been a good partner in doing business?: 8.2/10 (Category avg: 8.9/10)

Who Is the Company Behind Stackify APM?

Who Uses This Product?

  • Who Uses This: Software Developer
  • Top Industries: Computer Software, Information Technology and Services
  • Company Size: 45% Medium, 30% Large

What Are Recent G2 Reviews of Stackify APM?

What Are G2 Users Discussing About Stackify APM?

Ivanti vADC

Ivanti Virtual Application Delivery Controller delivers secure, high‑performance application delivery by unifying Virtual Traffic Manager, Web Application Firewall, and Services Director into an adaptable platform. It improves application resilience and performance through intelligent load balancing, traffic optimization, and real‑time monitoring, while integrated WAF capabilities protect against application‑layer attacks and support compliance requirements. Centralized orchestration streamlines provisioning, scaling, and license management, enabling organizations to maintain consistent performance and security across distributed, cloud‑first application environments.

Average Rating: 4.3/5.0

Total Reviews: 69

How Do G2 Users Rate Ivanti vADC?

  • Performance Metrics: 9.0/10 (Category avg: 8.3/10)
  • Root Cause Analysis (RCA): 10.0/10 (Category avg: 8.4/10)
  • Real User Monitoring (RUM): 9.3/10 (Category avg: 8.3/10)
  • Has the product been a good partner in doing business?: 9.4/10 (Category avg: 8.9/10)

Who Is the Company Behind Ivanti vADC?

  • Seller: Ivanti
  • Year Founded: 1985
  • HQ Location: South Jordan, UT
  • Twitter: @GoIvanti
    6,761 Twitter followers
  • LinkedIn® Page: www.linkedin.com
    3,026 employees on LinkedIn®

Who Uses This Product?

  • Top Industries: Information Technology and Services, Higher Education
  • Company Size: 77% Large, 14% Medium

What Are Recent G2 Reviews of Ivanti vADC?

What Are G2 Users Discussing About Ivanti vADC?

Logz.io

Logz.io is an AI-powered observability platform designed to help teams solve critical log management, monitoring, and troubleshooting challenges. Built for modern environments, Logz.io unifies log management, infrastructure monitoring, and distributed tracing in a single platform to provide deep, actionable insights into system performance and health. At its core, Logz.io’s AI Agent technology automates root cause analysis (RCA) and surfaces insights that accelerate investigations, reduce MTTR, and eliminate the need for time-consuming manual analysis or navigating multiple dashboards. Whether managing microservices or troubleshooting production issues, Logz.io empowers teams to quickly pinpoint issues, de-risk deployments, and focus on innovation. Unlike traditional observability tools that require ever-increasing data volumes and expertise, Logz.io offers a smarter, cost-optimized solution. With the ability to customize data ingestion and optimize telemetry costs, Logz.io ensures you get the insights you need without breaking the budget.

Average Rating: 4.5/5.0

Total Reviews: 163

How Do G2 Users Rate Logz.io?

  • Performance Metrics: 7.9/10 (Category avg: 8.3/10)
  • Root Cause Analysis (RCA): 7.7/10 (Category avg: 8.4/10)
  • Real User Monitoring (RUM): 7.5/10 (Category avg: 8.3/10)
  • Has the product been a good partner in doing business?: 9.2/10 (Category avg: 8.9/10)

Who Is the Company Behind Logz.io?

  • Seller: Logz.io
  • Year Founded: 2014
  • HQ Location: Boston, MA
  • Twitter: @logzio
    3,156 Twitter followers
  • LinkedIn® Page: www.linkedin.com
    103 employees on LinkedIn®

Who Uses This Product?

  • Who Uses This: Software Engineer, Software Developer
  • Top Industries: Computer Software, Information Technology and Services
  • Company Size: 53% Medium, 30% Small

What Do G2 Reviewers Say About Logz.io?

AI-generated summary from verified user reviews

Pros
  • Users value the centralized log management of Logz.io, enabling efficient issue tracking and automated reporting.
  • Users highlight the excellent customer support of Logz.io, noting quick responses and knowledgeable assistance from the team.
  • Users value the ease of implementation of Logz.io, praising its smooth integration and user-friendly dashboards.
  • Users praise the implementation ease of Logz.io, enjoying a smooth integration and user-friendly dashboard.
  • Users value the centralized log collection of Logz.io, enhancing productivity with user-friendly tools and insights.
Cons
  • Users find the dashboard issues in Logz.io cumbersome, with needs for improved chart creation and UI updates.
  • Users face integration issues with Logz.io, citing lag in indexing and complexity in advanced configurations.
  • Users find the limited customization options in Logz.io restrictive, affecting their overall satisfaction with the product.
  • Users find the complex configuration challenging, particularly with alerts and custom parsing rules setup.
  • Users find complex debugging challenging, often needing to deeply analyze data to set up alerts and reports effectively.

What Are Recent G2 Reviews of Logz.io?

What Are G2 Users Discussing About Logz.io?

Zabbix

Zabbix is an all-in-one, open source monitoring and observability solution that makes any hardware, software, service, or web application more efficient and reliable. Available on-premise and in the cloud, Zabbix can deploy anywhere and monitor any device, system, or app in any environment – while providing comprehensive data protection, easy integration, and limitless data visualization options. Zabbix uses a wide range of data collection methods to collect metrics, defining smart problem thresholds and harnessing the power of machine learning to suppress unwanted alert storms and notify users regarding the root cause of issues. Metrics are displayed on intuitive, easy-to-understand dashboards that allow users to access issues, reports, and maps with a single click. Users can monitor anything from physical and virtual servers or containers to network infrastructure and applications. Zabbix allows users to: • Control their infrastructure by collecting any metric from any source • Detect problems instantly • Get alerted on critical issues • Gain additional insights and extend observability via powerful data visualization • Leverage a single pane of glass for an entire infrastructure • Keep track of KPI's with business service monitoring • Seamlessly deploy Zabbix within any infrastructure • Deploy with just a few clicks, either on-premise or in the cloud • Scale quickly and without limits • Do business with the peace of mind that enterprise-grade security provides Zabbix also offers a full range of professional services, including: • Technical support subscriptions • Zabbix professional training • Migration • Upgrades • Template building • Development • Integration • Consulting • Turnkey solution

Average Rating: 4.3/5.0

Total Reviews: 206

How Do G2 Users Rate Zabbix?

  • Performance Metrics: 8.5/10 (Category avg: 8.3/10)
  • Root Cause Analysis (RCA): 8.1/10 (Category avg: 8.4/10)
  • Real User Monitoring (RUM): 8.5/10 (Category avg: 8.3/10)
  • Has the product been a good partner in doing business?: 8.1/10 (Category avg: 8.9/10)

Who Is the Company Behind Zabbix?

  • Seller: Zabbix
  • Company Website:
  • Year Founded: 2005
  • HQ Location: Riga, Latvia
  • Twitter: @zabbix
    9,943 Twitter followers
  • LinkedIn® Page: www.linkedin.com
    170 employees on LinkedIn®

Who Uses This Product?

  • Top Industries: Information Technology and Services, Telecommunications
  • Company Size: 61% Medium, 27% Large

What Do G2 Reviewers Say About Zabbix?

AI-generated summary from verified user reviews

Pros
  • Users appreciate the custom alert capabilities and fast alerts of Zabbix for effective monitoring of infrastructure.
  • Users find Zabbix to have a user-friendly integration process, making monitoring and alerting effortless.
  • Users value Zabbix's monitoring capabilities, effectively managing networks, servers, applications, and more across diverse infrastructures.
  • Users appreciate the monitoring ease of Zabbix, enjoying prompt alerts and intuitive dashboards for effective system management.
  • Users value the real-time monitoring capabilities of Zabbix, providing fast alerts and comprehensive infrastructure oversight.
Cons
  • Users find a steep learning curve when starting with Zabbix, complicating the setup of dashboards and integrations.
  • Users face dashboard limitations that hinder customization and fail to meet expectations, suggesting a need for enhancements.
  • Users highlight data limitations in Zabbix, finding it fails to meet expectations for customizable dashboards and features.
  • Users find the difficult configuration of Zabbix challenging, especially for new joiners and initial setups.
  • Users find the difficult learning curve challenging at first, especially with dashboards and calculations.

What Are Recent G2 Reviews of Zabbix?

What Are G2 Users Discussing About Zabbix?

Rollbar

Go beyond crash reporting, error tracking, logging and error monitoring. Get instant and accurate alerts — plus a real-time feed — of all errors, including unhandled exceptions. Our automation-grade grouping uses machine learning to reduce noise and gives you error signals you can trust.

Average Rating: 4.5/5.0

Total Reviews: 165

G2 Deal: Rollbar Offer for G2 Customers

Rollbar and G2 customers can grow better together. Save 25% on eligible Rollbar plans for 6 months, or sign up for free at the link below. Get all the tools you need to Discover and fix errors faster wherever they happen.

View this exclusive G2 deal

How Do G2 Users Rate Rollbar?

  • Performance Metrics: 6.4/10 (Category avg: 8.3/10)
  • Root Cause Analysis (RCA): 7.8/10 (Category avg: 8.4/10)
  • Real User Monitoring (RUM): 6.8/10 (Category avg: 8.3/10)
  • Has the product been a good partner in doing business?: 9.5/10 (Category avg: 8.9/10)

Who Is the Company Behind Rollbar?

  • Seller: Rollbar
  • Year Founded: 2012
  • HQ Location: San Francisco, CA
  • Twitter: @rollbar
    3,913 Twitter followers
  • LinkedIn® Page: www.linkedin.com
    28 employees on LinkedIn®

Who Uses This Product?

  • Who Uses This: Software Engineer, Senior Software Engineer
  • Top Industries: Computer Software, Information Technology and Services
  • Company Size: 62% Small, 26% Medium

What Do G2 Reviewers Say About Rollbar?

AI-generated summary from verified user reviews

Pros
  • Users find Rollbar's easy setup refreshing, noting its simplicity and lack of a learning curve compared to other tools.
  • Users appreciate the setup ease of Rollbar, noting its straightforward installation without a learning curve.
  • Users find Rollbar to be a simple tool to set up, with no steep learning curve compared to others.
Cons
  • Users experience mismatched error titles and descriptions, requiring manual checks that hinder efficiency in error handling.

What Are Recent G2 Reviews of Rollbar?

What Are G2 Users Discussing About Rollbar?

Airbrake

Deploy fearlessly and fix bugs faster with Airbrake Error & Performance Monitoring. Airbrake notifiers are available for all major programming languages and frameworks and installs in minutes. Spend less time tracking down bugs and more time developing. Airbrake provides frictionless error monitoring and performance insight for the entire app stack. Drill down on recurring exceptions or filter by parameters, users or environment variables. Intelligent grouping and duplicate detection are presented to ensure users don't get overwhelmed by trivial errors or a mass of emails.

Average Rating: 4.4/5.0

Total Reviews: 73

How Do G2 Users Rate Airbrake?

  • Root Cause Analysis (RCA): 8.6/10 (Category avg: 8.4/10)
  • Real User Monitoring (RUM): 7.5/10 (Category avg: 8.3/10)
  • Has the product been a good partner in doing business?: 9.0/10 (Category avg: 8.9/10)

Who Is the Company Behind Airbrake?

  • Seller: LogicMonitor
  • Year Founded: 2007
  • HQ Location: Santa Barbara, CA
  • Twitter: @logicmonitor
    12,430 Twitter followers
  • LinkedIn® Page: www.linkedin.com
    1,258 employees on LinkedIn®

Who Uses This Product?

  • Who Uses This: Software Engineer
  • Top Industries: Information Technology and Services, Computer Software
  • Company Size: 48% Small, 37% Medium

What Are Recent G2 Reviews of Airbrake?

What Are G2 Users Discussing About Airbrake?

Tian Lin
TL
Researched and written by Tian Lin
Updated