Top Free Analytics Platforms - Page 6

How Many Analytics Platforms Products Does G2 Track?

Total Products under this Category: 604

Category Stats (Sep 2026)

  • Average Rating: 4.51/5 The average rating of products in this category, based on all submitted ratings
  • Top Trending Product: Cube (+2.46%) - Among all products in this category, Cube recorded the largest rating increase compared to last month

Last updated: September 26, 2026

How Does G2 Rank Analytics Platforms Products?

Why You Can Trust G2's Software Rankings:

  • 30 Analysts and Data Experts
  • 29,600+ Authentic Reviews
  • 604+ Products
  • Unbiased Rankings

G2's software rankings are built on verified user reviews, rigorous moderation, and a consistent research methodology maintained by a team of analysts and data experts. Each product is measured using the same transparent criteria, with no paid placement or vendor influence. While reviews reflect real user experiences, which can be subjective, they offer valuable insight into how software performs in the hands of professionals. Together, these inputs power the G2 Score, a standardized way to compare tools within every category.

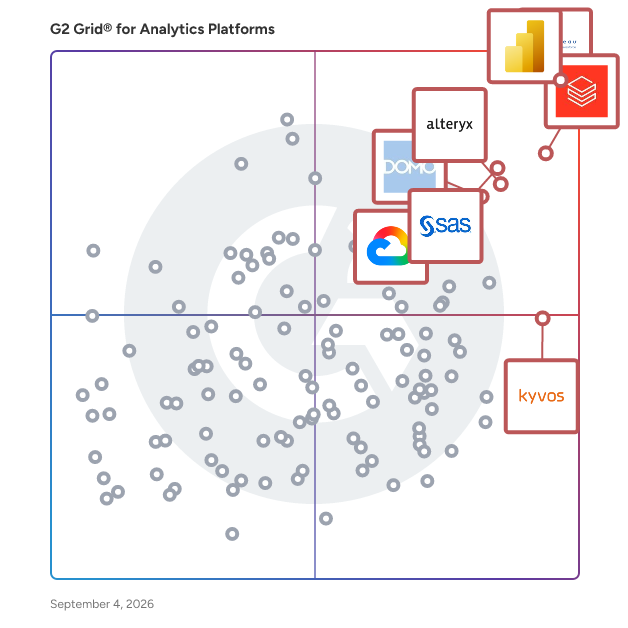
G2 Grid® for Analytics Platforms

G2 Grid® for Analytics Platforms plotting products by satisfaction and market presence

Highlighted products: Microsoft Power BI, Tableau, Databricks, SAS Viya, Alteryx, Domo, Looker, and Kyvos Semantic Layer.

Underlying data: [Grid® JSON](https://www.g2.com/categories/analytics-platforms/grids.json?focus%5B%5D=microsoft-microsoft-power-bi&focus%5B%5D=tableau&focus%5B%5D=databricks&focus%5B%5D=sas-sas-viya&focus%5B%5D=alteryx&focus%5B%5D=domo&focus%5B%5D=looker&focus%5B%5D=kyvos-semantic-layer)

Digital Hive

Digital Hive is an Analytics Catalog that curates and creates a single place for users to consume and find the analytics they need. Not a revisualization, we don't touch your data or recreate your security and you customize the consumption experience to wow your users. With Digital Hive you'll see greater value from your analytics investment by increased adoption, improved data literacy and reduced duplication of content.

Average Rating: 4.5/5.0

Total Reviews: 24

How Do G2 Users Rate Digital Hive?

  • Has the product been a good partner in doing business?: 9.4/10 (Category avg: 9.2/10)
  • Steps to Answer: 8.6/10 (Category avg: 8.4/10)
  • Reports Interface: 8.7/10 (Category avg: 8.8/10)
  • Calculated Fields: 8.2/10 (Category avg: 8.5/10)

Who Is the Company Behind Digital Hive?

Who Uses This Product?

  • Top Industries: Marketing and Advertising
  • Company Size: 48% Medium, 36% Small

What Do G2 Reviewers Say About Digital Hive?

AI-generated summary from verified user reviews

Pros
  • Users value the ease of use of Digital Hive, appreciating its user-friendly interface for managing multiple analytics tools.
  • Users appreciate the user-friendly interface of Digital Hive, making analytics simpler and more accessible for daily use.
  • Users appreciate the seamless integration offered by Digital Hive, simplifying connections between various BI and data tools.
  • Users value the easy collaboration with Digital Hive, enhancing teamwork and streamlining data processes for faster insights.
  • Users value the excellent analytical tools in Digital Hive, enhancing their business analysis and decision-making processes.
Cons
  • Users find the pricing too high for Digital Hive, leading to concerns about value and affordability.
  • Users find the integration complexity of Digital Hive challenging, especially with varied setups and navigating support issues.
  • Users report encountering occasional bugs that hinder performance and suggest a need for better management.
  • Users find the learning curve steep, requiring tech savvy individuals for effective use and navigation of Digital Hive.
  • Users are concerned about the lack of Row Level Security (RLS), which hinders their ability to manage data access effectively.

What Are Recent G2 Reviews of Digital Hive?

BIMachine

A BIMachine é uma plataforma cloud de Business Intelligence e Analytics, fornecida no modelo software-as-a-service, contando com os recursos para ajudar a sua empresa a ser mais eficiente e crescer no mercado. Mais do que praticidade, BI e cloud é uma integração que pressupõe assertividade, e estes são dois fatores que não podem faltar na receita de expansão de qualquer organização. Considerada a maior plataforma de Analytics da América Latina, a BIMachine é 100% brasileira, completa e escalável para criação de aplicações de negócio em nuvem. Com APP mobile disponível em IOS e Android, é possível ter a informação do seu negócio na palma da sua mão e no momento que você precisar. Além disso, a ferramenta permite criar painéis com suas análises, gráficos, mapas e KPI′s, para visualizar suas informações em um único local. Ademais, você pode criar análises a partir da sua origem de dados e modelar a melhor visão do seu negócio através de tabelas e gráficos, acompanhando indicadores de desempenho de uma maneira interativa e automatizada (automatizando o envio de reports por e-mail e WhatsApp).

Average Rating: 4.6/5.0

Total Reviews: 22

How Do G2 Users Rate BIMachine?

  • Has the product been a good partner in doing business?: 10.0/10 (Category avg: 9.2/10)
  • Steps to Answer: 8.8/10 (Category avg: 8.4/10)
  • Reports Interface: 8.5/10 (Category avg: 8.8/10)
  • Calculated Fields: 8.7/10 (Category avg: 8.5/10)

Who Is the Company Behind BIMachine?

  • Seller: BIMachine
  • Year Founded: 2014
  • HQ Location: Lajeado, Rio Grande do Sul
  • LinkedIn® Page: www.linkedin.com
    51 employees on LinkedIn®

Who Uses This Product?

  • Company Size: 58% Small, 21% Large

What Are Recent G2 Reviews of BIMachine?

What Are G2 Users Discussing About BIMachine?

TIMi

TIMi is the most efficient Data Science and Data Processing Platform. Since 2007, we have been creating and improving the most powerful framework to push the barriers of analytics, predictive analytics, AI and Big Data, while offering a helpful, fast and friendly environment. The TIMi Suite consists of four tools: 1. Anatella (Analytical ETL, Data Prep & Big Data), 2. Modeler (Auto-ML / Automated Predictive Modelling / Automated-AI), 3. StarDust (3D Segmentation) 4. Kibella (BI Dashboarding solution). TIMi dominates the Data Science market: In the "Summer 2022 - Momentum Report” from G2, in the “Data Science” category, TIMi has the #1 rank: TIMi is the Data Science solution with both the highest market growth and the highest customer-satisfaction! More about this subject here: https://timi.eu/blog/timi-the-number-one-data-science-platform/

Average Rating: 4.8/5.0

Total Reviews: 50

How Do G2 Users Rate TIMi?

  • Has the product been a good partner in doing business?: 9.1/10 (Category avg: 9.2/10)
  • Steps to Answer: 8.5/10 (Category avg: 8.4/10)
  • Reports Interface: 8.1/10 (Category avg: 8.8/10)
  • Calculated Fields: 9.5/10 (Category avg: 8.5/10)

Who Is the Company Behind TIMi?

  • Seller: TIMi SPRL
  • Year Founded: 2007
  • HQ Location: Brussels
  • Twitter: @TIMiSuite
    3,532 Twitter followers
  • LinkedIn® Page: www.linkedin.com
    86 employees on LinkedIn®

Who Uses This Product?

  • Top Industries: Information Technology and Services, Banking
  • Company Size: 40% Small, 32% Large

What Do G2 Reviewers Say About TIMi?

AI-generated summary from verified user reviews

Pros
  • Users highlight the exceptional customer support from the TIMi team, noting their quick response times and helpfulness.
  • Users find TIMi easy to use, thanks to its intuitive design and quick learning curve.
  • Users appreciate TIMi's user-friendly interface and exceptional support, making data transformation quick and efficient.
  • Users value the fast and intuitive automation capabilities of TIMi, streamlining data transformations and analyses effectively.
  • Users value the intuitive charting features of TIMi, enabling efficient data visualization and analysis.

What Are Recent G2 Reviews of TIMi?

What Are G2 Users Discussing About TIMi?

Entrinsik Informer

Founded in 1984, Entrinsik is an established, global software company based in Raleigh, North Carolina. Over 3,000 organizations in many industries around the world use Entrinsik software every day. Our state of the art solutions improve efficiency, productivity, and streamline daily operations Informer 5 is a robust, extensible data discovery and analytics platform that simplifies the process of accessing, cleansing, blending, and analyzing on-prem and cloud data. Aggregate disparate data using a single web-based platform to create a cohesive, curated, governed data hub for self-service data analysis. Explore, visualize and analyze relevant data on the fly. Securely publish Reports and collaborate with colleagues. Generate Dashboards that consolidate critical performance metrics. Informer is used extensively within various industries including Higher Education, Insurance, Manufacturing & Distribution, Healthcare, Public Safety, Not-for-Profit, Government, CRM, and many others. Informer Embedded is the perfect choice for software applications looking to provide purposeful, self-service analytics within or complementing their solution. Integration is quick and seamless with our heavily experienced and results-driven in-house team. You can choose your integration path with options from inlined content to external, connected but separate full applications. All options are entirely customizable and white-labeled to match the look and feel of your brand flawlessly so that you can provide critical insights without having to sacrifice your software’s identity. Contact us at informersales@entrinsik.com, 888-703-0016 for access to the Informer Sandbox to get a feel for the platform on your own or to schedule a one-on-one conversation or demo. Let us help you uncover insights in your data.

Average Rating: 4.7/5.0

Total Reviews: 10

How Do G2 Users Rate Entrinsik Informer?

  • Has the product been a good partner in doing business?: 10.0/10 (Category avg: 9.2/10)
  • Steps to Answer: 8.0/10 (Category avg: 8.4/10)
  • Reports Interface: 7.5/10 (Category avg: 8.8/10)
  • Calculated Fields: 6.9/10 (Category avg: 8.5/10)

Who Is the Company Behind Entrinsik Informer?

  • Seller: Entrinsik
  • Year Founded: 1984
  • HQ Location: Raleigh, NC - North Carolina
  • Twitter: @Entrinsik
    471 Twitter followers
  • LinkedIn® Page: www.linkedin.com
    45 employees on LinkedIn®

Who Uses This Product?

  • Top Industries: Higher Education
  • Company Size: 73% Medium, 18% Large

What Are Recent G2 Reviews of Entrinsik Informer?

Inzata

Inzata is a data analytics platform for integrating, exploring, and analyzing data of any kind, from any source, at massive scale with impeccable speed. Go from raw data to actionable insights in under 30 minutes! Powerful Artificial Intelligence-based data modeling and a patented analytics engine help users quickly load, blend, prep and model raw and unstructured data into powerful enterprise data models, actionable real-time analytics, and engaging visualizations. We help people explore and discover the value of their data, in record time. We pride ourselves on our ability to build 360° views of any company's data, across a multitude of systems, in minutes. Inzata's experience provides the future of Big Data analysis: extremely fast, accurate, and machine-accelerated.

Average Rating: 4.7/5.0

Total Reviews: 15

How Do G2 Users Rate Inzata?

  • Has the product been a good partner in doing business?: 9.4/10 (Category avg: 9.2/10)
  • Steps to Answer: 7.1/10 (Category avg: 8.4/10)
  • Reports Interface: 8.3/10 (Category avg: 8.8/10)
  • Calculated Fields: 7.8/10 (Category avg: 8.5/10)

Who Is the Company Behind Inzata?

  • Seller: Inzata
  • Year Founded: 2016
  • HQ Location: Tampa, Florida
  • Twitter: @InzataAnalytics
    310 Twitter followers
  • LinkedIn® Page: www.linkedin.com
    23 employees on LinkedIn®

Who Uses This Product?

  • Company Size: 67% Small, 20% Medium

What Are Recent G2 Reviews of Inzata?

What Are G2 Users Discussing About Inzata?

Pyramid

Pyramid is a tier one, enterprise-grade Analytics Operating System that scales from single-user self-service analytics to thousand-user centralized deployments—covering simple-but-effective data visualizations to advanced machine learning capabilities. The agnostic Analytics OS features a universal client for any device and OS. It can be installed on most platforms—both on-premises or in the cloud—and it can operate against and with most popular data stacks. Pyramid allows users and organizations to balance self-service productivity and governance. It is an adaptive analytic platform that provides different capabilities and experiences based on user needs and skills, all while managing content as a shared resource. It is designed to support your organization’s entire decision workflow, and give everyone the tools to conduct self-service analytics. Importantly, the Analytics OS solves the “last mile problem,” closing the gap between your organization’s stated analytics strategy and actual analytics implementation. Pyramid features six distinct analytics modules (Model, Formulate, Discover, Illustrate, Present, and Publish)—plus an Administrative Console and Content Management System—to deliver a truly universal analytics experience across the entire analytics workflow.

Average Rating: 4.1/5.0

Total Reviews: 15

How Do G2 Users Rate Pyramid?

  • Has the product been a good partner in doing business?: 9.0/10 (Category avg: 9.2/10)
  • Steps to Answer: 7.8/10 (Category avg: 8.4/10)
  • Reports Interface: 7.9/10 (Category avg: 8.8/10)
  • Calculated Fields: 7.9/10 (Category avg: 8.5/10)

Who Is the Company Behind Pyramid?

  • Seller: Pyramid Analytics
  • Year Founded: 2008
  • HQ Location: Amsterdam
  • Twitter: @PyramidAnalytic
    10,219 Twitter followers
  • LinkedIn® Page: www.linkedin.com
    102 employees on LinkedIn®

Who Uses This Product?

  • Company Size: 47% Large, 35% Small

What Are Recent G2 Reviews of Pyramid?

Phrazor by vPhrase

Phrazor by vPhrase Analytics is a self-service augmented analytics solution that delivers AI-powered stories from data. It uses NLG capabilities to automatically generate deep insights from complex datasets in digestible language and a narrative format. Phrazor’s applicability has been proven in Marketing, BFSI, FMCG, Pharmaceutical, Logistics, and more industries. Free trial for G2 users: https://phrazor.ai/trial

Average Rating: 4.7/5.0

Total Reviews: 23

How Do G2 Users Rate Phrazor by vPhrase?

  • Steps to Answer: 6.7/10 (Category avg: 8.4/10)
  • Reports Interface: 6.7/10 (Category avg: 8.8/10)
  • Calculated Fields: 6.7/10 (Category avg: 8.5/10)

Who Is the Company Behind Phrazor by vPhrase?

Who Uses This Product?

  • Company Size: 43% Large, 43% Medium

What Are Recent G2 Reviews of Phrazor by vPhrase?

What Are G2 Users Discussing About Phrazor by vPhrase?

Stratifyd

Stratifyd is the only next-gen experience analytics platform powered by Smart AI™ that empowers people of all skill levels to move beyond traditional customer experience analytics. By surfacing insights that existing approaches may miss, Stratifyd Smart AI™ takes the burden of manual analytics off teams, proactively surfacing hidden signals and themes 24/7 to ensure you never miss another insight. Today, many organizations have tons of data but lack the ability, time, resources, or budget to truly expose the insights that matter most to them. This is where Stratifyd stands out. With these challenges in mind, we have purpose-built the Stratifyd platform that will unify data from all your different sources and, through Smart AI™, automatically uncover the actionable insights you didn't know you were missing to: - Hit mission critical KPIs - Grow revenue - Drive loyalty - Reduce costs - Improve efficiency

Average Rating: 4.3/5.0

Total Reviews: 18

How Do G2 Users Rate Stratifyd?

  • Has the product been a good partner in doing business?: 10.0/10 (Category avg: 9.2/10)
  • Steps to Answer: 6.7/10 (Category avg: 8.4/10)
  • Reports Interface: 10.0/10 (Category avg: 8.8/10)
  • Calculated Fields: 8.3/10 (Category avg: 8.5/10)

Who Is the Company Behind Stratifyd?

  • Seller: Stratifyd
  • Year Founded: 2015
  • HQ Location: Charlotte, US
  • Twitter: @getStratifyd
    997 Twitter followers
  • LinkedIn® Page: www.linkedin.com
    14 employees on LinkedIn®

Who Uses This Product?

  • Company Size: 70% Large, 20% Medium

What Are Recent G2 Reviews of Stratifyd?

What Are G2 Users Discussing About Stratifyd?

Promethium

Promethium delivers self-service data at AI scale through its revolutionary Instant Data Fabric™ — the first agentic platform purpose-built for modern enterprises. Unlike traditional data architectures that require complex ETL pipelines and data movement, Promethium provides real-time, zero-copy access to distributed data across cloud, on-premises, and SaaS platforms. The platform's 360° Context Engine aggregates technical and business metadata to ensure accurate, contextual responses, while Mantra™, our Data Answer Agent, enables teams to build and share reusable data products instantly. Promethium empowers data teams to respond 10x faster to business questions while maintaining enterprise-grade governance and security.

Average Rating: 4.2/5.0

Total Reviews: 13

How Do G2 Users Rate Promethium?

  • Has the product been a good partner in doing business?: 9.4/10 (Category avg: 9.2/10)
  • Steps to Answer: 8.5/10 (Category avg: 8.4/10)
  • Reports Interface: 8.5/10 (Category avg: 8.8/10)
  • Calculated Fields: 9.2/10 (Category avg: 8.5/10)

Who Is the Company Behind Promethium?

  • Seller: Promethium
  • Year Founded: 2018
  • HQ Location: Menlo Park, US
  • Twitter: @PromethiumI
    366 Twitter followers
  • LinkedIn® Page: www.linkedin.com
    34 employees on LinkedIn®

Who Uses This Product?

  • Company Size: 46% Medium, 31% Large

What Do G2 Reviewers Say About Promethium?

AI-generated summary from verified user reviews

Pros
  • Users value the centralized data management capabilities of Promethium, enhancing collaboration and decision-making through analytics.
  • Users praise the centralized analytics of Promethium, enhancing teamwork and improving decision-making effortlessly.
  • Users value the centralized collaboration capabilities of Promethium, enhancing teamwork and data-driven decision-making.
  • Users appreciate the centralized data management of Promethium, enhancing teamwork and simplifying analytics with AI.
  • Users highlight the interactive visualizations of Promethium, enhancing their ability to understand and leverage data effectively.
Cons
  • Users find the complexity of insights challenging, making it hard for non-experts to interpret effectively.
  • Users find complex insights challenging to interpret, making it hard for non-experts to utilize the product effectively.
  • Users find that difficult learning hampers their ability to interpret complex insights effectively.
  • Users find the lack of features in Promethium frustrating compared to more established analytics tools.
  • Users find the limited features of Promethium frustrating compared to other analytics tools available on the market.

What Are Recent G2 Reviews of Promethium?

ReportServer

Powerful ad-hoc analysis coupled with support for OLAP and pixel-perfect reporting. With ReportServer you are not limited to one provider's solutions. ReportServer integrates Jasper, Eclipse BIRT, Mondrian and Excel-based reporting: choose what best suits your needs! On top, it comes with powerful admin tools and scripting capabilities that make integration into any environment easy. ReportServer Community Edition is freely available under the open source AGPL license. The feature extended ReportServer Enterprise Edition can be fully tested for 45 days. Just give it a try.

Average Rating: 4.2/5.0

Total Reviews: 25

How Do G2 Users Rate ReportServer?

  • Has the product been a good partner in doing business?: 8.3/10 (Category avg: 9.2/10)
  • Steps to Answer: 7.3/10 (Category avg: 8.4/10)
  • Reports Interface: 7.5/10 (Category avg: 8.8/10)
  • Calculated Fields: 7.3/10 (Category avg: 8.5/10)

Who Is the Company Behind ReportServer?

Who Uses This Product?

  • Top Industries: Information Technology and Services
  • Company Size: 48% Small, 36% Medium

What Are Recent G2 Reviews of ReportServer?

Signara

Signara is an agentic analytics platform for SMBs. It automatically turns business data into trusted KPIs, interactive dashboards, executive narratives, insights, recommendations, and next steps without requiring an analyst. For every dataset, Signara identifies the relevant KPIs, investigates what changed and why, and recommends specific actions based on the business domain. Signara turns those recommendations into assigned action. Users can assign a next step to an individual or team, create the task in Jira, Monday.com and more, or notify the relevant people by email. Every calculation is deterministic and auditable. Metrics reconcile directly to the source data, so AI explains the results but never invents the numbers. Signara also checks data quality and flags integrity issues that could affect the analysis. Connect data from HubSpot, Google Sheets, Excel, BigQuery, Snowflake, Databricks, PostgreSQL, MySQL, CSV, and more. Signara is also available as a connector in Claude, allowing users to run analytics and reporting tasks directly from Claude. A free tier is available with no credit card required. Signara is a modern alternative to Tableau, Power BI, Looker Studio, DashThis, and Klipfolio for teams that want more than dashboards. It automates reporting, interpretation, root cause analysis, recommendations, ownership, and task creation in one workflow, taking businesses from raw data to decisions and assigned action.

Average Rating: 4.8/5.0

Total Reviews: 9

How Do G2 Users Rate Signara?

  • Has the product been a good partner in doing business?: 10.0/10 (Category avg: 9.2/10)
  • Steps to Answer: 10.0/10 (Category avg: 8.4/10)
  • Reports Interface: 10.0/10 (Category avg: 8.8/10)
  • Calculated Fields: 10.0/10 (Category avg: 8.5/10)

Who Is the Company Behind Signara?

Who Uses This Product?

  • Company Size: 90% Small, 10% Large

What Are Recent G2 Reviews of Signara?

ExtendInsights

Start working from one place without jumping between systems. ExtendInsights connects your business data across NetSuite, Salesforce, HubSpot, Google Analytics, Stripe, Chargebee, and more directly into Excel. There, you can analyze, update, and report on live data without time-consuming exports, CSV processes, or manual rework. Instead of exporting from each system and stitching data together manually, ExtendInsights lets you access everything in one place—live, connected, and ready to go. Writeback is also available for NetSuite, Salesforce, and HubSpot. Whether you’re building live financial reports, updating records in bulk, analyzing saved searches or queries, combining multiple data sources, or creating executive dashboards, ExtendInsights eliminates manual steps and accelerates every part of your workflow. ExtendInsights brings analytics, data management, and financial reporting together in a single Excel-based experience. Create, edit, and update records in NetSuite, Salesforce, and HubSpot while simultaneously analyzing live data, all without switching tools or relying on CSVs. The result is faster workflows, fewer errors, and more time spent on insights instead of data preparation. Your team already works in Excel. Now they can do everything there. Key features: Visualize data using dynamic pivot tables and charts Build fast, accurate, and auditable financial reports Leverage data source security to keep data secure CloudExtend empowers users to make faster, more insightful decisions by creating innovative, user-friendly applications that integrate workplace productivity tools with platforms they use every day to automatically add emails, events, and files to NetSuite from Gmail and Outlook, or use Excel and Power BI to improve reporting and analysis capabilities for popular data sources. Our integration apps eliminate hundreds of hours of manual work, significantly reduce data import times, and provide a 360-degree view of customer activity.

Average Rating: 4.5/5.0

Total Reviews: 48

How Do G2 Users Rate ExtendInsights?

  • Has the product been a good partner in doing business?: 9.1/10 (Category avg: 9.2/10)
  • Steps to Answer: 10.0/10 (Category avg: 8.4/10)

Who Is the Company Behind ExtendInsights?

  • Seller: CloudExtend by Celigo
  • Company Website:
  • Year Founded: 2007
  • HQ Location: Redwood City, US
  • Twitter: @cloudextendIO
    253 Twitter followers
  • LinkedIn® Page: www.linkedin.com
    16 employees on LinkedIn®

Who Uses This Product?

  • Top Industries: Accounting, Retail
  • Company Size: 54% Medium, 42% Small

What Do G2 Reviewers Say About ExtendInsights?

AI-generated summary from verified user reviews

Pros
  • Users praise the ease of use of ExtendInsights, appreciating simple uploads and efficient data management.
  • Users find the integrations with Excel and other platforms enhance convenience and efficiency in data management.
  • Users value the ease of use and efficiency of ExtendInsights for managing data and simplifying tasks.
  • Users value the accuracy of information provided by ExtendInsights, facilitating effective data-driven decisions.
  • Users value the efficient data analysis capabilities of ExtendInsights, dramatically reducing report preparation time.
Cons
  • Users find the complexity of creating templates frustrating, with unclear field usage and slow error reporting.
  • Users face data retrieval issues, as ExtendInsights sometimes doesn't read configured data, affecting overall efficiency.
  • Users find form design challenging, experiencing confusion over fields and slow error reporting during uploads.
  • Users find the learning curve steep, especially in selecting templates and understanding technical aspects.
  • Users note that slow data loading hampers efficiency, especially with limited data exposure in SuiteQL.

What Are Recent G2 Reviews of ExtendInsights?

What Are G2 Users Discussing About ExtendInsights?

Infoveave

Infoveave is an AI-powered unified data platform that helps enterprises automate data pipelines, improve data quality, enable predictive analytics, and turn insights into measurable business actions — all within a single environment. Unlike traditional BI tools or standalone ETL platforms, Infoveave connects the entire data lifecycle from ingestion and transformation to governance, analytics, and operational execution. Infoveave is built on a strong foundation of data governance and data security, ensuring consistent data management, compliance, and protection. With capabilities like data lineage tracking, metadata management, row-level security, and audit trails, the platform helps maintain data integrity and control. Key Features Fovea - AgenticAI Assistant Infoveave's AgenticAI, Fovea, is embedded across the platform. Fovea assists in building data transformations, suggesting insights, automating workflows, and simplifying advanced analytics, reducing technical dependency and improving cross-team adoption. Data Automation & Integration • 50+ native connectors (cloud apps, databases, warehouses) • Automated data ingestion & transformation • Workflow orchestration with monitoring & alerts • Real-time pipeline visibility AI-Powered Analytics & Predictive Modeling • AutoML for predictive insights • What-if scenario planning • Python integration for advanced modeling • API-accessible analytics endpoints Conversational Dashboards & Self-Service BI • Natural language queries • 100+ interactive visuals • Drill-down exploration • Scheduled & automated reporting Built-in Data Quality & Governance • Automated validation & anomaly detection • Data catalog & lineage tracking • Role-based access control • Audit trails & governance workflows Data Apps & Operational Workflows • Low-code applications • Integrated data capture forms • Automated decision triggers • Insight-to-action workflows Business Value • Faster deployment of data pipelines • Improved data accuracy and trust • Reduced reliance on multiple disconnected tools • Faster decision-making cycles • Measurable operational efficiency Infoveave unifies data automation, AI-powered analytics, governance, and operational workflows into one intelligent platform — turning enterprise data into trusted, actionable decisions.

Average Rating: 4.9/5.0

Total Reviews: 9

How Do G2 Users Rate Infoveave?

  • Has the product been a good partner in doing business?: 10.0/10 (Category avg: 9.2/10)
  • Steps to Answer: 8.3/10 (Category avg: 8.4/10)
  • Reports Interface: 9.6/10 (Category avg: 8.8/10)
  • Calculated Fields: 9.7/10 (Category avg: 8.5/10)

Who Is the Company Behind Infoveave?

Who Uses This Product?

  • Company Size: 44% Small, 22% Large

What Do G2 Reviewers Say About Infoveave?

AI-generated summary from verified user reviews

Pros
  • Users find Infoveave to be easy to use, with smooth implementation and seamless data integration options.
  • Users highlight the easy integrations of Infoveave, enhancing data import and streamlining dashboard creation.
  • Users highlight the ease of use and quick implementation of Infoveave, enhancing data integration and visualization.
  • Users value the excellent community support, highlighting its reliability and top-notch assistance during implementation.
  • Users commend the excellent customer support of Infoveave, appreciating its reliability and top-notch assistance.
Cons
  • Users note the need for better help content as poor information leads to dependency on customer support.
  • Users face dashboard issues with isolating data, requiring extensive restructuring for multi-tenant reports.
  • Users face initial difficulties with data cleaning, needing extensive restructuring for effective dashboard functionality.
  • Users report data inaccuracy, facing initial difficulties with dashboards and tenant-specific reports that complicate their analysis.
  • Users faced initial difficulties with data integration, requiring substantial restructuring for effective dashboard functionality across tenants.

What Are Recent G2 Reviews of Infoveave?

Querio

Querio is an AI-native analytics platform with governance built in. Business users ask questions in plain English and get answers they can trust. Data teams define the context once, keep it in their own Git, and let agents do the work without losing control of how the data is used. Most AI analytics tools bolt a chatbot onto a warehouse. The results drift: every user gets a slightly different definition of revenue, every query is a fresh guess at the joins, and nobody can audit what the model did. Querio is designed around that problem. A context layer holds table relationships, metrics and business terminology as plain files that live in version control. Every agent run reads from the same context, so answers stay consistent across teams and change only when the data team says so. Querio connects to Snowflake, BigQuery, Postgres and other modern warehouses and databases over read-only connections. Queries run on live data where it already sits. There is no data duplication and no proprietary storage. For business users, Querio works like a conversational analyst. Ask a question, follow up with "break this down by region" or "show last year instead", and the charts update while the context is kept. Results can be pinned to boards and dashboards that stay in sync with the warehouse. For data and analytics teams, Querio is a code-first workspace. The agent's working medium is a reactive Python notebook where prompts, generated SQL and Python, charts and narrative live together. Every line of code the agent writes is visible, editable and versioned. Analysts can stop a run, correct the query, and continue. Nothing is hidden and nothing is a black box. Querio also powers embedded analytics. Product and platform teams can ship AI-driven questions, charts and tables inside their own applications, with APIs and theme tokens to match their design system. Security and governance are first-class. Querio is SOC 2 Type II audited, uses read-only connections with encrypted credentials, offers granular access control, and never uses customer data or queries to train external models, on any plan. Key Features Natural language querying and conversational analytics. Ask questions in everyday language, refine with follow-ups, and drill into detail without writing SQL. The agent handles translation and keeps the context of the conversation. Context layer as code. Define joins, metrics and glossary terms once, as plain files in Git. Every agent, every user and every query reuses the same definitions, so answers stay consistent and changes are reviewable. Agentic notebooks (coding optional). Reactive Python notebooks where prompts, generated SQL and Python, charts and narrative sit together. Business users stay in prompt mode. Technical users drop into code when they need to. Explore: instant answers on live data. Start from a prompt, iterate freely, drill down as many times as needed, and adjust filters or visualisations on the fly. AI-assisted dashboards and boards. Generate charts and tables from questions, then organise them into dashboards and boards that track KPIs or tell a data story, kept in sync with the warehouse. Embedded analytics and AI experiences. Put AI-powered questions, charts and tables inside your own product, with APIs and theme tokens so customer-facing analytics look native. Schema awareness and full transparency. Tag specific database values inside prompts, see what data Querio can reach, and inspect every query it writes. No hidden logic. Stop and edit. Pause a run, change the filters or the generated SQL and Python, and re-run without leaving the workflow. Analysts keep the control they expect with the speed of an agent. Version control for outputs. Update analyses and dashboards while previous versions stay intact, so teams can compare past and present results without losing work. Secure, governed access. SOC 2 Type II, read-only database connections, encrypted credentials, granular access control, and no training on customer data or queries on any plan. Typical Use Cases For Data and Analytics teams Centralising metrics, joins and terminology in one version-controlled context layer Cutting the data request backlog without giving up governance Reviewing and hardening agent-generated SQL and Python in a transparent workspace Replacing or modernising Tableau and Power BI estates with self-serve that the data team still controls For Product and Growth teams Funnel, activation and feature adoption analysis Experiment and cohort analysis without writing SQL Self-serve product analytics embedded directly in the app For Revenue, Sales and Marketing Pipeline, MRR/ARR and retention reporting Campaign performance and attribution analysis Shared boards for weekly and monthly business reviews For Operations and Support Monitoring operational KPIs and SLAs on live data Finding bottlenecks and anomalies through follow-up questions Answering ad hoc performance questions without Excel exports For SaaS products Adding self-service, AI-driven analytics to customer portals and internal tools

Average Rating: 4.6/5.0

Total Reviews: 10

How Do G2 Users Rate Querio?

  • Has the product been a good partner in doing business?: 8.9/10 (Category avg: 9.2/10)
  • Reports Interface: 10.0/10 (Category avg: 8.8/10)

Who Is the Company Behind Querio?

Who Uses This Product?

  • Company Size: 50% Small, 40% Medium

What Do G2 Reviewers Say About Querio?

AI-generated summary from verified user reviews

Pros
  • Users value the accuracy of responses in Querio, enabling quick and precise CRM data analysis effortlessly.
  • Users praise the seamless AI integration of Querio, enabling quick, accurate queries and insightful visualizations effortlessly.
  • Users praise the ease of use in data analysis with Querio, enabling quick, accurate insights through natural language queries.
  • Users praise the data visualization capabilities of Querio, enabling instant insights and clear presentation of analyses.
  • Users value the outstanding ease of use in Querio, enabling natural language queries for quick, accurate results.
What Are Recent G2 Reviews of Querio?

Coginiti

Coginiti is a SQL-first collaborative data operations platform that empowers teams to build, publish, and consume quality data products, streamlining the data analytics lifecycle from inception to insights. Integrating with the widest variety of data platforms and tools, Coginiti enables analysts, engineers, and data scientists to collaborate in real-time, breaking down silos and fostering innovation. Its intuitive interface simplifies managing complex data workflows, ensuring governance and consistency across projects. Key Features: - Realtime Collaboration - Flexible Data Modeling - Data Quality Testing - Visualize Data Lineage - Native Scheduling - Powerful APIs - AI Assistant Coginiti facilitates a seamless transition from data preparation to actionable intelligence. It’s not just about refining your data strategy or scaling your analytics capabilities; it’s about empowering your organization to harness the full potential of data for informed decision-making. Discover the power of Coginiti and transform your data operations. Coginiti offers products for individual analysts, data teams, and enterprises.

Average Rating: 4.5/5.0

Total Reviews: 29

How Do G2 Users Rate Coginiti?

  • Has the product been a good partner in doing business?: 8.3/10 (Category avg: 9.2/10)

Who Is the Company Behind Coginiti?

  • Seller: Coginiti Corp
  • Year Founded: 2020
  • HQ Location: Atlanta , GA
  • Twitter: @coginiti
    71 Twitter followers
  • LinkedIn® Page: www.linkedin.com
    32 employees on LinkedIn®

Who Uses This Product?

  • Company Size: 66% Large, 28% Medium

What Are Recent G2 Reviews of Coginiti?

What Are G2 Users Discussing About Coginiti?

Tian Lin
TL
Researched and written by Tian Lin
Updated July 2, 2025