Best Enterprise Analytics Platforms - Page 4

How Many Analytics Platforms Products Does G2 Track?

Total Products under this Category: 592

Category Stats (Sep 2026)

  • Average Rating: 4.51/5 (↑0.01 vs Aug 2026) The average rating of products in this category, based on all submitted ratings
  • Top Trending Product: BlazeSQL (+2.75%) - Among all products in this category, BlazeSQL recorded the largest rating increase compared to last month

Last updated: September 01, 2026

How Does G2 Rank Analytics Platforms Products?

Why You Can Trust G2's Software Rankings:

  • 30 Analysts and Data Experts
  • 29,000+ Authentic Reviews
  • 592+ Products
  • Unbiased Rankings

G2's software rankings are built on verified user reviews, rigorous moderation, and a consistent research methodology maintained by a team of analysts and data experts. Each product is measured using the same transparent criteria, with no paid placement or vendor influence. While reviews reflect real user experiences, which can be subjective, they offer valuable insight into how software performs in the hands of professionals. Together, these inputs power the G2 Score, a standardized way to compare tools within every category.

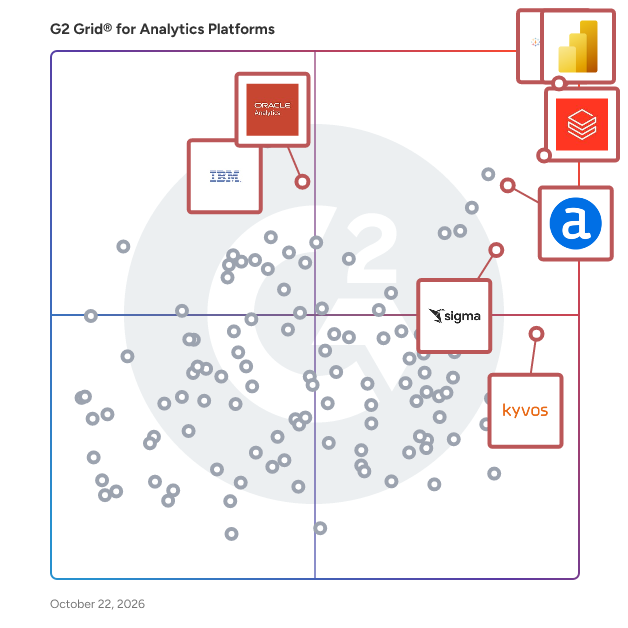
G2 Grid® for Analytics Platforms

G2 Grid® for Analytics Platforms plotting products by satisfaction and market presence

Highlighted products: Tableau, Microsoft Power BI, Databricks, Alteryx, Oracle Analytics Cloud, Kyvos Semantic Layer, IBM Cognos Analytics, and SAS Viya.

Underlying data: [Grid® JSON](https://www.g2.com/categories/analytics-platforms/grids.json?focus%5B%5D=tableau&focus%5B%5D=microsoft-microsoft-power-bi&focus%5B%5D=databricks&focus%5B%5D=alteryx&focus%5B%5D=oracle-analytics-cloud&focus%5B%5D=kyvos-semantic-layer&focus%5B%5D=ibm-cognos-analytics&focus%5B%5D=sas-sas-viya&segment=enterprise)

ibi WebFOCUS

The ibi WebFOCUS® platform is an enterprise business intelligence and analytics solution equipped with data management, visual discovery, predictive analytics, and powerful visualizations. Combining these capabilities and data science in one unified platform, the WebFOCUS solution helps make data-driven decisions across the enterprise providing reports, dashboards, and customer-facing applications at scale.

Average Rating: 4.4/5.0

Total Reviews: 149

How Do G2 Users Rate ibi WebFOCUS?

  • Has the product been a good partner in doing business?: 8.9/10 (Category avg: 9.2/10)
  • Steps to Answer: 8.0/10 (Category avg: 8.4/10)
  • Reports Interface: 8.7/10 (Category avg: 8.8/10)
  • Calculated Fields: 8.4/10 (Category avg: 8.5/10)

Who Is the Company Behind ibi WebFOCUS?

  • Seller: ibi
  • Year Founded: 1975
  • HQ Location: Fort Lauderdale, FL
  • Twitter: @infobldrs
    32,864 Twitter followers
  • LinkedIn® Page: www.linkedin.com
    890 employees on LinkedIn®
  • Phone: 212-736-4433

Who Uses This Product?

  • Top Industries: Information Technology and Services, Government Administration
  • Company Size: 57% Large, 32% Medium

What Are Recent G2 Reviews of ibi WebFOCUS?

What Are G2 Users Discussing About ibi WebFOCUS?

Count

Count is a modern data collaboration platform that helps data teams actually work together. It combines a data notebook with a real-time collaborative canvas for analysis and visualisation, so everyone can query, debug, and explore data in one place. Count replaces the mess of disconnected tools with a single workspace where analysts, engineers, and stakeholders can write SQL or Python, build visualisations, and share insights instantly. You can import and debug dbt models, see live results from connected CTEs, and export back to dbt Cloud, GitHub, or full SQL scripts. Used by over 500 data teams, including Accenture, Cleo AI, and Too Good To Go, Count helps teams move beyond static dashboards and focus on solving real business problems. It’s data collaboration that actually works.

Average Rating: 4.8/5.0

Total Reviews: 104

How Do G2 Users Rate Count?

  • Has the product been a good partner in doing business?: 9.5/10 (Category avg: 9.2/10)
  • Steps to Answer: 8.5/10 (Category avg: 8.4/10)
  • Reports Interface: 8.5/10 (Category avg: 8.8/10)
  • Calculated Fields: 8.8/10 (Category avg: 8.5/10)

Who Is the Company Behind Count?

  • Seller: Count Technologies
  • Company Website:
  • Year Founded: 2016
  • HQ Location: London, United Kingdom
  • Twitter: @counthq
    2,104 Twitter followers
  • LinkedIn® Page: www.linkedin.com
    24 employees on LinkedIn®

Who Uses This Product?

  • Who Uses This: Data Analyst, Analytics Engineer
  • Top Industries: Financial Services, Information Technology and Services
  • Company Size: 79% Medium, 11% Large

What Do G2 Reviewers Say About Count?

AI-generated summary from verified user reviews

Pros
  • Users appreciate the intuitive team collaboration features of Count, facilitating smoother workflows and interactive data analysis.
  • Users appreciate the ease of use of Count, which simplifies data exploration and analysis for all team members.
  • Users value the responsive and helpful customer support from Count, enhancing their overall data experience and usability.
  • Users value the flexibility of Count, enabling easy data understanding and seamless integration of diverse analytics tools.
  • Users love the flexibility in data visualization with Count, enhancing exploratory analysis and real-time collaboration.
Cons
  • Users note a steep learning curve, requiring training for those unfamiliar with similar canvas models and tools.
  • Users experience slow performance with Count when handling large canvases or numerous data cells, affecting efficiency.
  • Users express a desire for more customization options, particularly for dashboards and visual reports within Count.
  • Users note the missing features in Count, limiting usability and creating barriers for self-service data analysis.
  • Users experience layout issues that can make navigation and organization difficult, affecting the overall usability of Count.

What Are Recent G2 Reviews of Count?

Mode

Mode is the first BI platform to embrace the way modern data teams work, which enables data leaders to drive more efficient, higher impact analysis and increased data maturity through true self-service. As the unified intelligence layer, Mode maximizes modern data stack ROI and turns data into a competitive advantage for leading businesses across all sectors and stages.

Average Rating: 4.5/5.0

Total Reviews: 319

How Do G2 Users Rate Mode?

  • Has the product been a good partner in doing business?: 9.1/10 (Category avg: 9.2/10)
  • Steps to Answer: 8.1/10 (Category avg: 8.4/10)
  • Reports Interface: 8.7/10 (Category avg: 8.8/10)
  • Calculated Fields: 8.3/10 (Category avg: 8.5/10)

Who Is the Company Behind Mode?

  • Seller: Mode Analytics, Inc.
  • Year Founded: 2013
  • HQ Location: San Francisco, California
  • Twitter: @ModeAnalytics
    6,658 Twitter followers
  • LinkedIn® Page: www.linkedin.com
    694 employees on LinkedIn®

Who Uses This Product?

  • Who Uses This: Data Scientist, Data Analyst
  • Top Industries: Information Technology and Services, Computer Software
  • Company Size: 47% Medium, 29% Large

What Do G2 Reviewers Say About Mode?

AI-generated summary from verified user reviews

Pros
  • Users appreciate the user-friendly interface and robust feature tracking, enhancing self-service exploration and data analysis.
  • Users highlight the customization options in Mode, enabling tailored experiences for both analysts and business users.
  • Users find the ease of implementation with Mode's SSO functionality enhances accessibility and efficiency across the organization.
  • Users appreciate the ease of use in Mode, benefiting from a clean UI and role-based features for all.
  • Users value the efficiency of Mode, benefiting from clear visibility and streamlined data analysis for all roles.
Cons
  • Users find the complex setup challenging for non-technical users, requiring significant admin support for authentication.
  • Users find complex usage a barrier, especially for less technical users needing significant admin support for onboarding.
  • Users find that on-boarding less technical users is challenging, as it requires substantial admin support for data integration.
  • Users find difficult learning curves for onboarding less technical users, requiring admin support for effective integration.
  • Users find initial difficulty in onboarding less technical users, requiring substantial support for effective integration.

What Are Recent G2 Reviews of Mode?

Sisense

Sisense is an API-first analytics platform that modernizes businesses by seamlessly integrating in-context analytics within applications, leading to action-oriented insights that enhance decision intelligence.

Average Rating: 4.2/5.0

Total Reviews: 987

How Do G2 Users Rate Sisense?

  • Has the product been a good partner in doing business?: 8.7/10 (Category avg: 9.2/10)
  • Steps to Answer: 7.7/10 (Category avg: 8.4/10)
  • Reports Interface: 8.3/10 (Category avg: 8.8/10)
  • Calculated Fields: 8.0/10 (Category avg: 8.5/10)

Who Is the Company Behind Sisense?

  • Seller: Sisense, Inc.
  • Company Website:
  • Year Founded: 2004
  • HQ Location: New York
  • Twitter: @Sisense
    6,543 Twitter followers
  • LinkedIn® Page: www.linkedin.com
    534 employees on LinkedIn®

Who Uses This Product?

  • Who Uses This: Data Analyst, Product Manager
  • Top Industries: Information Technology and Services, Computer Software
  • Company Size: 57% Medium, 24% Small

What Do G2 Reviewers Say About Sisense?

AI-generated summary from verified user reviews

Pros
  • Users find Sisense's ease of use exceptional, facilitating clear data visualization and seamless integration for better insights.
  • Users appreciate Sisense's easy dashboard and widget creation, enhancing data insights and user-friendly visualizations.
  • Users value the seamless integrations of Sisense, allowing for efficient data management and user-friendly analytics across platforms.
  • Users praise the amazing customer support of Sisense, highlighting their quick response and effective assistance.
  • Users value the extensive dashboard customization in Sisense, enabling tailored data visualization and improved insights.
Cons
  • Users experience a steep learning curve in implementing Sisense, making setup challenging, especially for the less technical.
  • Users note the missing features in Sisense, including limited query capabilities and insufficient visualization options.
  • Users find Sisense buggy and visually unappealing, with unreliable customer support and CI/CD issues affecting their operations.
  • Users find dashboard setup tedious and complicated, requiring extensive technical knowledge and design skills for effective use.
  • Users find limited customization in Sisense dashboards, making it challenging for non-technical users to optimize their experience.

What Are Recent G2 Reviews of Sisense?

What Are G2 Users Discussing About Sisense?

Infor Birst

Birst is a native cloud business intelligence (BI) and business analytics platform that helps organizations understand and optimize complex processes in less time than traditional BI solutions. Built with patented automation and machine learning technologies, Birst’s Data-as-a-Service approach connects teams and applications across the enterprise via a trusted network of analytics and insights to inform smarter decisions. This unique approach helps leading organizations leverage all their siloed and diverse data sources and extract insights to improve workforce productivity, asset optimization, process efficiencies, and customer satisfaction—often in 90 days or less.

Average Rating: 4.0/5.0

Total Reviews: 84

How Do G2 Users Rate Infor Birst?

  • Has the product been a good partner in doing business?: 8.3/10 (Category avg: 9.2/10)
  • Steps to Answer: 8.3/10 (Category avg: 8.4/10)
  • Reports Interface: 8.3/10 (Category avg: 8.8/10)
  • Calculated Fields: 8.3/10 (Category avg: 8.5/10)

Who Is the Company Behind Infor Birst?

  • Seller: Infor
  • Year Founded: 2002
  • HQ Location: New York
  • Twitter: @Infor
    18,472 Twitter followers
  • LinkedIn® Page: www.linkedin.com
    22,165 employees on LinkedIn®
  • Phone: 800-260-2640

Who Uses This Product?

  • Top Industries: Information Technology and Services, Computer Software
  • Company Size: 44% Medium, 34% Large

What Are Recent G2 Reviews of Infor Birst?

What Are G2 Users Discussing About Infor Birst?

Spotfire Analytics

Spotfire® is a visual data science platform designed to help organizations address complex, industry-specific challenges by effectively utilizing data. This solution offers a range of flexible packaging options tailored to meet the diverse needs of teams at various stages of their visual data science journey. Turn raw data into real-time decisions with powerful, interactive visual analytics with Spotfire® Analytics. Spotfire Analytics is designed for business agility, enabling every user to explore data visually, uncover patterns quickly, and make confident, data-driven decisions without writing a single line of code. As a self-service visual data science solution, it empowers teams across roles and departments to gain fast, actionable insights that drive impact. With its no-code interactive dashboards and rich visual exploration capabilities, Spotfire Analytics connects natively to hundreds of cloud, on-premises, and real-time data sources. Built-in geoanalytics extend the power of analysis with multi-layer mapping and seamless integration of spatial data, while data wrangling and transformation can be performed directly within the visual interface, making it easy to clean, shape, and blend data as you analyze. AI-assisted recommendations and anomaly detection help uncover hidden patterns, suggest the most meaningful visualizations, and accelerate the path to discovery. Customizable visualizations, workflows, and an intuitive interface ensure that insights are not only easier to create but also easier to share. With seamless collaboration features, Spotfire Analytics enables teams to work together, align on insights, and act decisively. Whether the goal is to analyze trends, detect anomalies, or unlock location-based intelligence, Spotfire Analytics delivers the speed, flexibility, and depth needed to make smarter decisions with confidence. Explore and understand your data visually, uncover hidden insights, and build powerful analytics applications - all without writing a single line of code. Spotfire Analytics combines advanced interactive visualizations and intuitive data wrangling in one environment. Connect to hundreds of data sources, from files to real-time streaming data, and transform messy data directly within your visuals. Built-in AI recommendations help you find patterns, anomalies, and trends faster. With flexible visualizations, spatial analytics, and custom applications, anyone can turn raw data into actionable insights in minutes. Designed for business agility, Spotfire Analytics empowers every user to explore, analyze, and share results confidently - turning questions into decisions. Best for: Analysts, data-savvy professionals, and teams looking to explore and share data visually with maximum flexibility.

Average Rating: 4.2/5.0

Total Reviews: 328

How Do G2 Users Rate Spotfire Analytics?

  • Has the product been a good partner in doing business?: 8.4/10 (Category avg: 9.2/10)
  • Steps to Answer: 7.9/10 (Category avg: 8.4/10)
  • Reports Interface: 8.3/10 (Category avg: 8.8/10)
  • Calculated Fields: 8.5/10 (Category avg: 8.5/10)

Who Is the Company Behind Spotfire Analytics?

Who Uses This Product?

  • Who Uses This: Student, Manager
  • Top Industries: Oil & Energy, Information Technology and Services
  • Company Size: 52% Large, 26% Medium

What Do G2 Reviewers Say About Spotfire Analytics?

AI-generated summary from verified user reviews

Pros
  • Users appreciate the powerful and flexible data visualization capabilities of Spotfire Analytics, enhancing their data exploration experience.
  • Users appreciate the ease of use of Spotfire Analytics, enabling quick insights and effective decision-making with complex data.
  • Users appreciate the easy integrations of Spotfire Analytics, enhancing accuracy and enabling robust AI-powered analytics seamlessly.
  • Users rave about Spotfire's powerful analytics capabilities, enabling advanced data handling and insightful visualizations seamlessly.
  • Users love the transformative interactive visualizations of Spotfire, simplifying complex data for clear understanding across teams.
Cons
  • Users find Spotfire's steep learning curve challenging, particularly for those unfamiliar with data modeling and scripting.
  • Users find the learning difficulty significant, especially for beginners navigating advanced features and options in Spotfire.
  • Users find the licensing costs high, making Spotfire Analytics less accessible for smaller organizations.
  • Users often face a steep learning curve with Spotfire Analytics, making initial use challenging for newcomers.
  • Users note that there are limitations in data comparison and features, affecting usability and clarity of Spotfire Analytics.

What Are Recent G2 Reviews of Spotfire Analytics?

What Are G2 Users Discussing About Spotfire Analytics?

Apache Superset

Apache Superset is an open-source data exploration and visualization platform designed to handle data at scale. It enables users to create interactive dashboards and perform complex data analyses with ease. Superset supports a wide range of data sources and integrates seamlessly with various databases, making it a versatile tool for data professionals. Key Features and Functionality: - Interactive Dashboards: Build and customize dashboards with a variety of visualization options to represent data effectively. - SQL IDE: Utilize a rich SQL editor with syntax highlighting and autocomplete features for efficient query writing. - Extensive Database Support: Connect to numerous databases, including relational and non-relational systems, through a robust connector framework. - Security and Authentication: Implement granular access control and integrate with various authentication backends to ensure data security. - Scalability: Designed to scale out to large, distributed environments, accommodating the needs of growing organizations. Primary Value and User Solutions: Apache Superset empowers organizations to make data-driven decisions by providing an intuitive platform for data visualization and exploration. It addresses the need for a scalable and flexible tool that can integrate with diverse data sources, allowing users to derive insights without extensive technical expertise. By offering a user-friendly interface and powerful features, Superset enhances productivity and facilitates a deeper understanding of complex datasets.

Average Rating: 4.4/5.0

Total Reviews: 50

How Do G2 Users Rate Apache Superset?

  • Has the product been a good partner in doing business?: 9.1/10 (Category avg: 9.2/10)
  • Steps to Answer: 8.5/10 (Category avg: 8.4/10)
  • Reports Interface: 8.9/10 (Category avg: 8.8/10)
  • Calculated Fields: 8.9/10 (Category avg: 8.5/10)

Who Is the Company Behind Apache Superset?

Who Uses This Product?

  • Top Industries: Financial Services, Computer Software
  • Company Size: 45% Medium, 34% Small

What Do G2 Reviewers Say About Apache Superset?

AI-generated summary from verified user reviews

Pros
  • Users find Apache Superset easy to use, appreciating its powerful features and seamless data access.
  • Users value the automation of reports and dashboards, enjoying seamless integration with Gmail and Slack.
  • Users find Apache Superset to be easy to understand and use, enhancing their reporting and dashboard experience.
  • Users appreciate the easy access provided by Apache Superset, enhancing their ability to utilize powerful data tools.
  • Users find the speed of Apache Superset makes data access quick and effortless, enhancing their overall experience.
Cons
  • Users often experience slow performance as queries can get stuck or hang during execution, causing frustration.
  • Users experience frequent SQL execution issues, as queries can hang and lead to inefficiencies in usage.
  • Users find the lack of interactivity in visualizations disappointing, hindering a more engaging data exploration experience.

What Are Recent G2 Reviews of Apache Superset?

What Are G2 Users Discussing About Apache Superset?

TIMi

TIMi is the most efficient Data Science and Data Processing Platform. Since 2007, we have been creating and improving the most powerful framework to push the barriers of analytics, predictive analytics, AI and Big Data, while offering a helpful, fast and friendly environment. The TIMi Suite consists of four tools: 1. Anatella (Analytical ETL, Data Prep & Big Data), 2. Modeler (Auto-ML / Automated Predictive Modelling / Automated-AI), 3. StarDust (3D Segmentation) 4. Kibella (BI Dashboarding solution). TIMi dominates the Data Science market: In the "Summer 2022 - Momentum Report” from G2, in the “Data Science” category, TIMi has the #1 rank: TIMi is the Data Science solution with both the highest market growth and the highest customer-satisfaction! More about this subject here: https://timi.eu/blog/timi-the-number-one-data-science-platform/

Average Rating: 4.8/5.0

Total Reviews: 50

How Do G2 Users Rate TIMi?

  • Has the product been a good partner in doing business?: 9.1/10 (Category avg: 9.2/10)
  • Steps to Answer: 8.5/10 (Category avg: 8.4/10)
  • Reports Interface: 8.1/10 (Category avg: 8.8/10)
  • Calculated Fields: 9.5/10 (Category avg: 8.5/10)

Who Is the Company Behind TIMi?

  • Seller: TIMi SPRL
  • Year Founded: 2007
  • HQ Location: Brussels
  • Twitter: @TIMiSuite
    3,532 Twitter followers
  • LinkedIn® Page: www.linkedin.com
    86 employees on LinkedIn®

Who Uses This Product?

  • Top Industries: Information Technology and Services, Banking
  • Company Size: 40% Small, 32% Large

What Do G2 Reviewers Say About TIMi?

AI-generated summary from verified user reviews

Pros
  • Users highlight the exceptional customer support from the TIMi team, noting their quick response times and helpfulness.
  • Users find TIMi easy to use, thanks to its intuitive design and quick learning curve.
  • Users appreciate TIMi's user-friendly interface and exceptional support, making data transformation quick and efficient.
  • Users value the fast and intuitive automation capabilities of TIMi, streamlining data transformations and analyses effectively.
  • Users value the intuitive charting features of TIMi, enabling efficient data visualization and analysis.

What Are Recent G2 Reviews of TIMi?

What Are G2 Users Discussing About TIMi?

Pentaho

Pentaho is a modular, enterprise-grade platform that makes it easy to manage complex data—on-premises, in the cloud, or in hybrid environments. Whether structured or unstructured, your data becomes a trusted asset that teams can use to operate with confidence, agility, and control.

Average Rating: 4.1/5.0

Total Reviews: 48

How Do G2 Users Rate Pentaho?

  • Has the product been a good partner in doing business?: 6.9/10 (Category avg: 9.2/10)
  • Steps to Answer: 7.9/10 (Category avg: 8.4/10)
  • Reports Interface: 7.7/10 (Category avg: 8.8/10)
  • Calculated Fields: 7.6/10 (Category avg: 8.5/10)

Who Is the Company Behind Pentaho?

  • Seller: Pentaho
  • Year Founded: 2004
  • HQ Location: Santa Clara, CA
  • LinkedIn® Page: www.linkedin.com
    159 employees on LinkedIn®

Who Uses This Product?

  • Top Industries: Information Technology and Services, Internet
  • Company Size: 48% Medium, 30% Large

What Are Recent G2 Reviews of Pentaho?

Tellius

Kaiya, our agentic worker, reasons across every data and documents while keeping your definitions and playbooks applied. Then, rather than stopping at the answer like a chat or copilot system, it outputs polished work, fully functional apps, and repeatable (governered) agentic workflows that run recurring work on a schedule and watch the business around the clock. Everywhere your team works Slack/ Teams/ CRM/ ERP etc. Need something new? Describe the tweak to the workflow, the insight, the app and it's tailored on your governed data in minutes. Tellius inherits the semantic layer you already have — Snowflake, dbt, your catalog — instead of replacing it. Connect and Architect resolves your entities and metrics into one model. A deterministic engine handles the numbers, so the answer is the same every run and traceable to source. Governed memory writes approved corrections back, so nothing gets taught twice.

Average Rating: 4.3/5.0

Total Reviews: 27

How Do G2 Users Rate Tellius?

  • Has the product been a good partner in doing business?: 8.6/10 (Category avg: 9.2/10)
  • Steps to Answer: 8.9/10 (Category avg: 8.4/10)
  • Reports Interface: 8.4/10 (Category avg: 8.8/10)
  • Calculated Fields: 8.0/10 (Category avg: 8.5/10)

Who Is the Company Behind Tellius?

  • Seller: Tellius
  • Year Founded: 2016
  • HQ Location: Reston, Virginia
  • Twitter: @TelliusData
    534 Twitter followers
  • LinkedIn® Page: www.linkedin.com
    123 employees on LinkedIn®

Who Uses This Product?

  • Company Size: 41% Large, 33% Medium

What Do G2 Reviewers Say About Tellius?

AI-generated summary from verified user reviews

Pros
  • Users value the data visualization tools of Tellius, appreciating the ability to create interactive and informative dashboards.
  • Users value the advanced analytics capabilities of Tellius, utilizing AI-driven insights for deeper data understanding.
  • Users appreciate the ease of use of Tellius, particularly for its natural language querying capabilities.
  • Users value the advanced analytics capabilities of Tellius, enhancing their ability to uncover insights in data.
  • Users value the advanced analytics capabilities of Tellius, enabling them to uncover hidden patterns and trends effortlessly.
Cons
  • Users express concern over the confusing pricing of Tellius, which may not fit small businesses or startups.
  • Users find Tellius expensive, making it less accessible for small businesses and startups seeking affordable solutions.
  • Users often face integration issues with Tellius, as it lacks the extensive third-party app support of other BI tools.
  • Users mention a complex learning curve with Tellius, making it challenging for those new to advanced analytics.
  • Users experience missing functionality in Tellius, particularly regarding integrations and mobile app capabilities.

What Are Recent G2 Reviews of Tellius?

What Are G2 Users Discussing About Tellius?