Best AIOps Tools for Small Business - Page 2

How Many AIOps Tools Products Does G2 Track?

Total Products under this Category: 338

Category Stats (Nov 2026)

  • Average Rating: 4.55/5 (↑0.06 vs Oct 2026) The average rating of products in this category, based on all submitted ratings
  • Top Trending Product: Elastic Observability (+0.66%) - Among all products in this category, Elastic Observability recorded the largest rating increase compared to last month

Last updated: November 01, 2026

How Does G2 Rank AIOps Tools Products?

Why You Can Trust G2's Software Rankings:

  • 30 Analysts and Data Experts
  • 14,200+ Authentic Reviews
  • 338+ Products
  • Unbiased Rankings

G2's software rankings are built on verified user reviews, rigorous moderation, and a consistent research methodology maintained by a team of analysts and data experts. Each product is measured using the same transparent criteria, with no paid placement or vendor influence. While reviews reflect real user experiences, which can be subjective, they offer valuable insight into how software performs in the hands of professionals. Together, these inputs power the G2 Score, a standardized way to compare tools within every category.

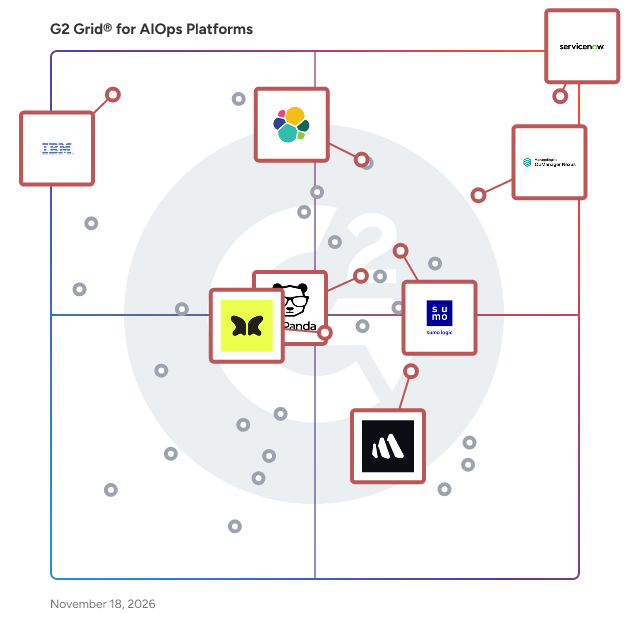
G2 Grid® for AIOps Tools

G2 Grid® for AIOps Tools plotting products by satisfaction and market presence

Highlighted products: OpManager Nexus, Resolve AI, Sumo Logic, ServiceNow IT Operations Management, Better Stack, IBM Concert platform, Elastic Observability, and BigPanda.

Underlying data: [Grid® JSON](https://www.g2.com/categories/aiops-platforms/grids.json?focus%5B%5D=opmanager-nexus&focus%5B%5D=resolve-ai&focus%5B%5D=sumo-logic&focus%5B%5D=servicenow-it-operations-management&focus%5B%5D=better-stack&focus%5B%5D=ibm-concert-platform&focus%5B%5D=elastic-observability&focus%5B%5D=bigpanda&segment=small-business)

Datadog

Datadog is the monitoring, security and analytics platform for developers, IT operations teams, security engineers and business users in the cloud age. The SaaS platform integrates and automates infrastructure monitoring, application performance monitoring and log management to provide unified, real-time observability of our customers' entire technology stack. Datadog is used by organizations of all sizes and across a wide range of industries to enable digital transformation and cloud migration, drive collaboration among development, operations, security and business teams, accelerate time to market for applications, reduce time to problem resolution, secure applications and infrastructure, understand user behavior and track key business metrics.

Average Rating: 4.4/5.0

Total Reviews: 739

How Do G2 Users Rate Datadog?

  • Systems Monitoring: 9.4/10 (Category avg: 9.4/10)
  • Artificial Intelligence: 9.1/10 (Category avg: 9.0/10)
  • Has the product been a good partner in doing business?: 8.5/10 (Category avg: 9.3/10)
  • Reporting: 9.0/10 (Category avg: 8.9/10)

Who Is the Company Behind Datadog?

  • Seller: Datadog
  • Company Website:
  • Year Founded: 2010
  • HQ Location: New York
  • LinkedIn® Page: www.linkedin.com
    10,780 employees on LinkedIn®
  • Ownership: NASDAQ: DDOG

Who Uses This Product?

  • Who Uses This: Software Engineer, DevOps Engineer
  • Top Industries: Information Technology and Services, Computer Software
  • Company Size: 46% Medium, 33% Large

What Do G2 Reviewers Say About Datadog?

AI-generated summary from verified user reviews

Pros
  • Users value a unified observability view that brings logs, metrics, and traces together for easier monitoring and insights.
  • Users value clear, customizable dashboards that make relevant data easy to visualize and understand.
  • Users value unified visibility across applications, infrastructure, and services, helping them understand overall system health.
  • Users find the interface intuitive and easy to use, helping them navigate monitoring and streamline everyday operations.
  • Users value its broad integrations across cloud services and existing systems, with straightforward setup that connects their tools.
Cons
  • Users say costs are high and can rise quickly as infrastructure, data volume, and monitored services scale.
  • Users find the learning curve steep, with advanced features, queries, and dashboards taking time to master.
  • Users find the interface crowded with information and controls, making it feel overwhelming, especially at first.
  • Users find costs difficult to predict, track, and control, especially as usage and monitored environments scale.
  • Users find navigation confusing, with features and information difficult to locate across screens and dashboards.

What Are Recent G2 Reviews of Datadog?

What Are G2 Users Discussing About Datadog?

Motadata ObserveOps

Motadata ObserveOps (formerly known as AIOps) is a full-stack observability platform that gives IT and operations teams complete visibility across their infrastructure, networks, and applications. It unifies metrics, logs, and traces in one place, replacing scattered point tools with a single source of truth for the health of the environment. Built on DFIT (Deep Learning Framework for IT Operations), ObserveOps applies AI and machine learning to correlate signals, detect anomalies, and identify the root cause of incidents faster. Core capabilities include real-time monitoring, customizable dashboards and reports, intelligent alerting, network and flow analysis, log analytics, and automated network configuration backups. ObserveOps covers on-premises, cloud, and hybrid environments, and supports on-premises deployment for organizations with data control requirements. Teams use it to reduce downtime, resolve issues proactively, and base operational decisions on reliable, correlated data.

Average Rating: 4.6/5.0

Total Reviews: 34

How Do G2 Users Rate Motadata ObserveOps?

  • Systems Monitoring: 10.0/10 (Category avg: 9.4/10)
  • Has the product been a good partner in doing business?: 9.7/10 (Category avg: 9.3/10)
  • Reporting: 10.0/10 (Category avg: 8.9/10)

Who Is the Company Behind Motadata ObserveOps?

Who Uses This Product?

  • Top Industries: Computer & Network Security
  • Company Size: 49% Medium, 35% Small

What Do G2 Reviewers Say About Motadata ObserveOps?

AI-generated summary from verified user reviews

Pros
  • Users value the powerful and detailed dashboard features that enhance data visualization and ease of use.
  • Users value the powerful and detailed dashboards of Motadata ObserveOps, enhancing their data visualization and integration capabilities.
  • Users value the ease of use of Motadata ObserveOps, appreciating its clear interface and simple configuration.
  • Users value the detailed implementation of features in Motadata ObserveOps, enhancing both functionality and graphical representation.
  • Users value the comprehensive monitoring capabilities of Motadata ObserveOps, appreciating its detailed graphical representations and functionality.
Cons
  • Users find the complex configuration challenging, especially regarding licensing and dual LAN settings.
  • Users often face configuration difficulties with licensing and dual LAN setups, leading to frustration and delays.
  • Users face licensing issues regarding technician access, causing frustration with the product's usability and features.
  • Users face technical issues like licensing difficulties and dual LAN configuration problems that hinder effective use.

What Are Recent G2 Reviews of Motadata ObserveOps?

What Are G2 Users Discussing About Motadata ObserveOps?

Splunk Observability Cloud

Splunk Observability Cloud is a comprehensive, real-time monitoring and troubleshooting platform designed to provide full-stack visibility across any environment. By integrating application performance monitoring, infrastructure monitoring, and digital experience monitoring, it enables organizations to detect and resolve issues swiftly, ensuring optimal system performance and enhanced user experiences. Built on OpenTelemetry standards, Splunk Observability Cloud offers AI-driven insights and analytics, facilitating proactive management of complex, distributed systems. Key Features and Functionality: - Application Performance Monitoring (APM): Identifies and addresses application issues by combining related data into intuitive visuals, accelerating mean time to resolution (MTTR). - Infrastructure Monitoring: Provides instant visibility and real-time alerts to improve hybrid cloud performance. - Digital Experience Monitoring: Delivers insights into frontend performance through Real User Monitoring and Synthetic Monitoring, ensuring seamless user experiences. - AI-Powered Analytics: Utilizes machine learning-driven features like Service Maps and Trace Analytics to offer guided troubleshooting and faster issue resolution. - OpenTelemetry-Native: Ensures data ownership and control, preventing vendor lock-in and allowing consistent instrumentation across applications. - No Data Sampling: Collects and analyzes 100% of data with NoSample™ tracing, eliminating blind spots. - Log Observer Connect: Correlates logs stored in Splunk Platform with real-time metrics and traces, providing deeper context for software behavior. Primary Value and Problem Solving: Splunk Observability Cloud addresses the challenges of monitoring and managing complex, distributed systems by offering unified visibility and real-time troubleshooting capabilities. It empowers organizations to: - Accelerate Issue Resolution: By correlating metrics, traces, and logs, teams can quickly identify root causes, reducing downtime and improving system reliability. - Enhance User Experiences: Continuous monitoring of digital experiences ensures that performance issues are detected and resolved before impacting end-users. - Optimize Operational Efficiency: AI-driven insights and automated analytics streamline troubleshooting processes, allowing teams to focus on innovation rather than firefighting. - Maintain Data Control: The OpenTelemetry-native approach provides flexibility and prevents vendor lock-in, enabling organizations to adapt and scale their observability practices as needed. By integrating these capabilities, Splunk Observability Cloud enables organizations to maintain high system performance, deliver exceptional user experiences, and drive continuous innovation.

Average Rating: 4.3/5.0

Total Reviews: 55

How Do G2 Users Rate Splunk Observability Cloud?

  • Has the product been a good partner in doing business?: 8.0/10 (Category avg: 9.3/10)

Who Is the Company Behind Splunk Observability Cloud?

  • Seller: Cisco
  • Year Founded: 1984
  • HQ Location: San Jose, CA
  • LinkedIn® Page: www.linkedin.com
    95,294 employees on LinkedIn®
  • Ownership: NASDAQ:CSCO
  • Phone: 847-678-6600

Who Uses This Product?

  • Top Industries: Information Technology and Services, Computer Software
  • Company Size: 38% Large, 32% Medium

What Do G2 Reviewers Say About Splunk Observability Cloud?

AI-generated summary from verified user reviews

Pros
  • Users highlight the efficiency of Splunk Observability Cloud, which streamlines monitoring and task execution significantly.
  • Users value the powerful reporting and visualizations in Splunk Observability Cloud for effective data analysis.
  • Users value the real-time visibility and powerful SPL queries that enhance root cause analysis and data management efficiency.
  • Users value the intelligent log monitoring features of Splunk Observability Cloud for efficient event correlation and searching.
  • Users appreciate the integration with Splunk Cloud for logging, providing a comprehensive view of application performance.
Cons
  • Users find the difficult learning curve in Splunk Observability Cloud challenging, especially for beginners and custom visualizations.
  • Users find limited features in Splunk Observability Cloud, especially regarding scheduling and regex functionalities.
  • Users feel that Splunk Observability Cloud lacks essential features in the UI, making it challenging to navigate and implement effectively.
  • Users find the complex setup process challenging, impacting usability and accessibility for smaller organizations.
  • Users find Splunk Observability Cloud to be expensive for large data volumes, making it less accessible for smaller organizations.

What Are Recent G2 Reviews of Splunk Observability Cloud?

What Are G2 Users Discussing About Splunk Observability Cloud?

AI can help you find the answers. G2 helps you trust them.

Connect G2 to Claude or ChatGPT for answers grounded in G2's trusted reviews, comparisons, and pricing from real user insights.

How it works

Mezmo

Mezmo built an AI SRE agent that helps SRE and platform teams manage production environments with greater context, control, and trust. It supports autonomous incident detection, investigates incidents, identifies likely root causes, generates post-mortems, and turns repeatable operations work into governed agentic workflows on-call teams can rely on. The agent runs on AURA, Mezmo’s open-source agent harness, and is grounded by Mezmo’s real-time telemetry pipeline. Together, they give the agent task-ready context from logs, metrics, and traces instead of raw data dumps. Mezmo keeps production AI inspectable and controlled. Teams can connect their own models, integrate existing tools through MCP, run workflows on their own infrastructure, and audit every plan, prompt, and tool call. Mezmo is built for SRE and platform teams that want to bring AI into production operations without giving up control, context, or trust.

Average Rating: 4.6/5.0

Total Reviews: 213

How Do G2 Users Rate Mezmo?

  • Has the product been a good partner in doing business?: 9.2/10 (Category avg: 9.3/10)

Who Is the Company Behind Mezmo?

  • Seller: Mezmo
  • Year Founded: 2015
  • HQ Location: San Jose, California
  • LinkedIn® Page: www.linkedin.com
    62 employees on LinkedIn®

Who Uses This Product?

  • Who Uses This: Software Engineer, CTO
  • Top Industries: Computer Software, Information Technology and Services
  • Company Size: 64% Small, 32% Medium

What Do G2 Reviewers Say About Mezmo?

AI-generated summary from verified user reviews

Pros
  • Users appreciate the powerful search functionality of Mezmo, enabling quick access to relevant logs and context.
  • Users value the real-time alerts from Mezmo, enhancing log management with easy implementation and visibility.
  • Users appreciate the excellent data visualization features of Mezmo, making log monitoring and analysis straightforward and efficient.
  • Users find that Mezmo enhances efficiency in log management, boosting team productivity and simplifying incident response.
  • Users value the comprehensive visibility Mezmo provides into distributed systems, enhancing operational efficiency and customer experience.
Cons
  • Users find the UX improvement necessary as the design feels complex and navigation difficult for new users.
  • Users find the complex setup of Mezmo requires significant expertise and resources, complicating implementation and maintenance.
  • Users find the learning difficulty of Mezmo challenging for newcomers, despite improvements from the team.
  • Users find log management limitations frustrating, particularly the lack of a standard "log" level and documentation issues.
  • Users find Mezmo's website not user-friendly, citing difficulties in navigation and accessing documentation for first-time use.

What Are Recent G2 Reviews of Mezmo?

What Are G2 Users Discussing About Mezmo?

SolarWinds Observability

SolarWinds® Observability is a comprehensive full-stack observability solution designed to meet the diverse needs of modern organizations, regardless of their size. This solution provides deep visibility into hybrid ecosystems, enabling users to monitor and manage both on-premises and cloud environments effectively. By optimizing performance and ensuring availability across distributed hybrid IT infrastructures, SolarWinds Observability supports organizations in navigating the complexities of their IT environments. Targeted at IT professionals and organizations that require robust monitoring capabilities, SolarWinds Observability caters to a wide range of use cases. It is particularly beneficial for businesses operating in hybrid environments, where the integration of on-premises and cloud resources is essential. The solution allows users to gain a holistic view of their networks, applications, databases, and user experiences, thereby facilitating better decision-making and operational efficiency. This is especially crucial in today’s fast-paced digital landscape, where downtime can significantly impact service reliability and customer satisfaction. One of the standout features of SolarWinds Observability is its built-in intelligence powered by AIOps capabilities. This functionality accelerates issue remediation by enabling users to detect, troubleshoot, and resolve problems more efficiently. The advanced predictive analysis and anomaly-based alerts help organizations proactively address potential issues before they escalate, ultimately reducing downtime and enhancing service reliability. Additionally, the solution's log pattern analysis further streamlines the troubleshooting process, allowing IT teams to focus on strategic initiatives rather than being bogged down by operational challenges. SolarWinds Observability offers flexibility in deployment, providing users with the option to choose between self-hosted and SaaS models. The self-hosted option integrates seamlessly with other SolarWinds services, such as security and storage monitoring, while the SaaS option is tailored for deeper monitoring of custom and cloud-based applications. This adaptability ensures that organizations can select the deployment method that best aligns with their operational needs and infrastructure. Moreover, SolarWinds Observability stands out by consolidating multiple monitoring tools into a single, integrated solution. This not only simplifies the monitoring process but also helps organizations reduce costs associated with managing disparate systems. By offering comprehensive visibility across hybrid IT environments, SolarWinds Observability empowers organizations to optimize their operations and enhance overall performance.

Average Rating: 4.3/5.0

Total Reviews: 851

How Do G2 Users Rate SolarWinds Observability?

  • Systems Monitoring: 7.8/10 (Category avg: 9.4/10)
  • Artificial Intelligence: 7.2/10 (Category avg: 9.0/10)
  • Has the product been a good partner in doing business?: 8.3/10 (Category avg: 9.3/10)
  • Reporting: 8.9/10 (Category avg: 8.9/10)

Who Is the Company Behind SolarWinds Observability?

Who Uses This Product?

  • Who Uses This: Network Engineer, Network Administrator
  • Top Industries: Information Technology and Services, Hospital & Health Care
  • Company Size: 44% Large, 35% Medium

What Do G2 Reviewers Say About SolarWinds Observability?

AI-generated summary from verified user reviews

Pros
  • Users find the ease of use of SolarWinds Observability beneficial for quick and stress-free monitoring.
  • Users appreciate the clear and practical monitoring that simplifies performance tracking across various databases and environments.
  • Users appreciate the clear monitoring performance of SolarWinds Observability, making troubleshooting less stressful and more efficient.
  • Users appreciate the clear monitoring capabilities of SolarWinds Observability, simplifying performance diagnostics across various databases.
  • Users appreciate the intuitive user interface of SolarWinds Observability, enabling easy navigation and clear data visualization.
Cons
  • Users find the pricing of SolarWinds Observability to be expensive, especially for smaller teams or companies.
  • Users find the learning curve steep, especially for configuring advanced features and tuning alerts effectively.
  • Users struggle with integration issues due to limited out-of-the-box support and challenging customizations with SolarWinds Observability.
  • Users find the complex setup daunting and time-consuming, particularly for larger environments and new users.
  • Users find the configuration difficulty challenging, especially for large environments, making initial setup overwhelming and complex.

What Are Recent G2 Reviews of SolarWinds Observability?

What Are G2 Users Discussing About SolarWinds Observability?

OpsPilot

OpsPilot is an AI-led observability platform that helps engineering and IT operations teams detect problems, investigate incidents and improve reliability — with less manual effort. Unlike traditional monitoring tools that leave engineers to interpret dashboards, correlate alerts and search through logs, OpsPilot brings observability and AI-assisted investigation together. Meet Coworker — Your 24/7 AI SRE Teammate At the heart of OpsPilot is Coworker, an AI-powered operations teammate that continuously investigates what's happening across your applications, infrastructure and services. Coworker analyses available metrics, logs and traces, investigates anomalies and operational alerts, and brings related findings together into clear, prioritised situations. Rather than presenting another stream of alerts, Coworker helps engineers understand what's happening, why it matters and what they should investigate or do next. From Monitoring to Actionable Intelligence OpsPilot combines three complementary capabilities: Observability: Collect, explore and correlate metrics, logs and traces from applications, servers, databases, containers and cloud infrastructure. Gain visibility across distributed systems through OpenTelemetry and supported integrations. AI-Assisted Investigation: Coworker continuously investigates operational signals, examines supporting evidence, identifies likely causes and groups related findings into meaningful situations. It keeps investigations updated as conditions change, helping teams focus on problems that genuinely need attention. Operational Guidance: Receive prioritised findings, explanations and recommended next steps. Reduce repetitive investigation work and help engineers move more quickly from identifying a problem to deciding how to resolve it. OpenTelemetry-Native and Built on Open Standards OpsPilot supports OpenTelemetry ingestion and integrates with Grafana, allowing teams to build on familiar observability technologies. It works with existing OpenTelemetry instrumentation, without requiring a proprietary OpsPilot agent. Supported environments include Kubernetes, containers, cloud infrastructure and distributed applications. For teams requiring deeper Java and Adobe ColdFusion application diagnostics, the optional FusionReactor APM agent provides additional visibility. Designed for Modern IT Operations OpsPilot is built for DevOps, SRE, platform engineering and IT operations teams responsible for keeping production systems reliable. Whether you're monitoring applications, investigating infrastructure issues or managing complex distributed environments, OpsPilot helps your team spend less time searching for answers and more time resolving problems. Beyond Observability Traditional observability tells you what your systems are doing. OpsPilot goes further by helping you understand what matters and what to do next. With Coworker continuously investigating your environment, OpsPilot provides a practical foundation for moving from reactive monitoring towards more proactive, AI-assisted operations.

Average Rating: 4.8/5.0

Total Reviews: 187

How Do G2 Users Rate OpsPilot?

  • Has the product been a good partner in doing business?: 9.5/10 (Category avg: 9.3/10)

Who Is the Company Behind OpsPilot?

  • Seller: Intergral
  • Company Website:
  • Year Founded: 1998
  • HQ Location: Böblingen, DE
  • LinkedIn® Page: www.linkedin.com
    1 employees on LinkedIn®

Who Uses This Product?

  • Who Uses This: CTO, Developer
  • Top Industries: Information Technology and Services, Computer Software
  • Company Size: 65% Small, 27% Medium

What Do G2 Reviewers Say About OpsPilot?

AI-generated summary from verified user reviews

Pros
  • Users value the real-time monitoring capabilities of OpsPilot, enhancing troubleshooting and application performance visibility substantially.
  • Users value the real-time monitoring of OpsPilot, enhancing troubleshooting and ensuring application stability with precise insights.
  • Users appreciate the ease of use of OpsPilot, enjoying straightforward setup and excellent integration across platforms.
  • Users value the real-time performance monitoring of OpsPilot, enhancing troubleshooting and application stability significantly.
  • Users value the real-time monitoring capabilities of OpsPilot, enhancing troubleshooting efficiency and application performance insights.
Cons
  • Users find the learning curve steep due to complex features and confusing settings that hinder effective use.
  • Users find OpsPilot to be expensive, but recognize its value justifies the cost for managing infrastructure.
  • Users find the learning difficulty of OpsPilot challenging, requiring time to fully grasp its features and functionalities.
  • Users find the cloud version's confusing UI challenging to navigate, impacting their overall experience with OpsPilot.
  • Users express concern over data limitations in OpsPilot, noting restricted history and potential insight loss without proper configuration.

What Are Recent G2 Reviews of OpsPilot?

What Are G2 Users Discussing About OpsPilot?

Tian Lin
TL
Researched and written by Tian Lin
Updated