Best Manufacturing Intelligence Software - Page 8

How Many Manufacturing Intelligence Software Products Does G2 Track?

Total Products under this Category: 196

Category Stats (Sep 2026)

  • Average Rating: 4.44/5 The average rating of products in this category, based on all submitted ratings
  • Top Trending Product: Plutoshift (+0.86%) - Among all products in this category, Plutoshift recorded the largest rating increase compared to last month

Last updated: September 15, 2026

How Does G2 Rank Manufacturing Intelligence Software Products?

Why You Can Trust G2's Software Rankings:

  • 30 Analysts and Data Experts
  • 2,300+ Authentic Reviews
  • 196+ Products
  • Unbiased Rankings

G2's software rankings are built on verified user reviews, rigorous moderation, and a consistent research methodology maintained by a team of analysts and data experts. Each product is measured using the same transparent criteria, with no paid placement or vendor influence. While reviews reflect real user experiences, which can be subjective, they offer valuable insight into how software performs in the hands of professionals. Together, these inputs power the G2 Score, a standardized way to compare tools within every category.

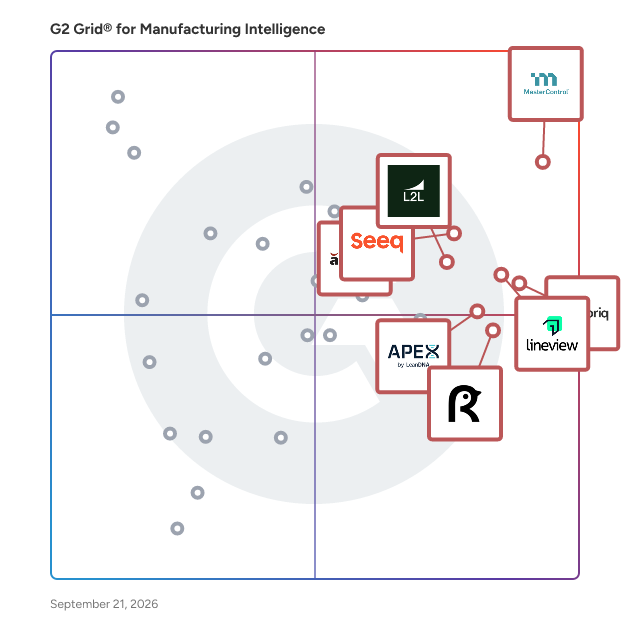
G2 Grid® for Manufacturing Intelligence Software

G2 Grid® for Manufacturing Intelligence Software plotting products by satisfaction and market presence

Highlighted products: MasterControl Manufacturing Excellence, Fabriq, Lineview, Seeq, aPriori Manufacturing Intelligence Platform, L2L, Factbird, and APEX.

Underlying data: [Grid® JSON](https://www.g2.com/categories/manufacturing-intelligence/grids.json?focus%5B%5D=mastercontrol-manufacturing-excellence&focus%5B%5D=fabriq-fabriq&focus%5B%5D=lineview&focus%5B%5D=seeq&focus%5B%5D=apriori-manufacturing-intelligence-platform&focus%5B%5D=l2l&focus%5B%5D=factbird&focus%5B%5D=leandna-apex)

DATAHUB+

DataHUB+ is an enterprise time-series process data historian and visualization platform. It's scalable distributed data storage allows users to store all available structured, semi-structured and unstructured data reliably. DataHUB+ is built for rapid insights, reducing data wrangling time. Build your own data visualizations and dashboards, monitor operations in real time, create alerts and be confident in the integrity of your analysis. DataHUB+ is designed to be interoperable with your existing systems, and can be utilised for an unlimited number of plants, assets and equipment. Users can build data visualizations using dynamic dashboards or fully customize visualizations using drag & drop functionality. DataHUB+ also includes free-form calculations and statistical analysis capabilities. Discover a next generation process historian and visualization platform without hidden licensing fees, additional hardware costs or individual user costs.

Average Rating: 5.0/5.0

Total Reviews: 1

How Do G2 Users Rate DATAHUB+?

  • Has the product been a good partner in doing business?: 10.0/10 (Category avg: 9.1/10)

Who Is the Company Behind DATAHUB+?

  • Seller: VROC
  • Year Founded: 2016
  • HQ Location: East Perth, AU
  • Twitter: @vrocai
    60 Twitter followers
  • LinkedIn® Page: www.linkedin.com
    13 employees on LinkedIn®

Who Uses This Product?

  • Company Size: 100% Medium

What Are Recent G2 Reviews of DATAHUB+?

DataXchange

Scytec DataXchange is a Cloud and On-Premise OEE and analytic manufacturing machine monitoring system, and so much more.

Who Is the Company Behind DataXchange?

  • Seller: Minitab
  • Year Founded: 1972
  • HQ Location: State College, Pennsylvania, United States
  • Twitter: @Minitab
    5,017 Twitter followers
  • LinkedIn® Page: www.linkedin.com
    732 employees on LinkedIn®

DynamxMFG - Smart Manufacturing Platform

DynamxMFG is a smart manufacturing platform built for small to medium-sized manufacturers, giving businesses real-time visibility from sales orders to shop floor execution. With live data delivered across customisable dashboards, it empowers managers to identify bottlenecks, improve quality, and react quickly to production challenges. By combining order management, inventory control, shop floor tracking, and integrated reporting, DynamxMFG simplifies complex processes into an intuitive, scalable system, helping manufacturers boost productivity, reduce downtime, and make faster, smarter decisions.

Who Is the Company Behind DynamxMFG - Smart Manufacturing Platform?

  • Seller: Total Control Pro
  • Year Founded: 2013
  • HQ Location: Northampton, GB
  • Twitter: @TotalControlPro
    897 Twitter followers
  • LinkedIn® Page: www.linkedin.com
    16 employees on LinkedIn®

Edge Intel

A drop-in visual cortex for your manufacturing line. Detect defects, identify root causes, and optimize yield—all in real-time. Built with Edge AI, local frontier models and cloud functions to provide Root Cause Analysis.

Who Is the Company Behind Edge Intel?

EganForge

Who Is the Company Behind EganForge?

eLIXA

eLIXA® by Haber is an AI-powered automation platform that changes the way process industries operate, reducing human-error-based manual sampling and analysis and replacing it with sensor-based monitoring and autonomous control. eLIXA is meant for water- and chemical-intensive industries like pulp & paper, sugar, metals & mining, food & beverages, etc. Using the advanced methodologies and systems of the ML models and the edge-to-cloud data architecture, customers can also access data from any location, thus streamlining visibility and actionable insights at scale for Operators, Engineers and Plant Heads alike. eLIXA provides real-time analysis of process parameters, dosing recommendations, and actuates pumps for dosing and control, providing multi-site visibility resulting in improved insights and steady state operations over time, so organizations benefit from effective decision-support for both single-site or enterprise-wide implementations, thereby driving efficiency, limiting rejects and downtime, and allowing for sustainability initiatives by improving water, energy, and chemical footprints.

Who Is the Company Behind eLIXA?

  • Seller: Haber
  • Year Founded: 2017
  • HQ Location: Pune, IN
  • Twitter: @HABER_TECH
    119 Twitter followers
  • LinkedIn® Page: www.linkedin.com
    225 employees on LinkedIn®

Epicor Connected Process Control

Epicor Connected Process Control (CPC) is a no-code/low-code MES and Connected Worker platform with embedded digital work instructions that provide task-level guidance, process control, traceability, and real-time reporting. The platform provides a unified environment with consistent workflows across stations and operations, connecting workers, tools, and business systems. CPC supports both operator-performed and automated operations. Tasks can be completed through guided instructions or automatically confirmed through PLCs and integrated equipment, with results captured as part of the product record. CPC enables production data to flow from the shop floor to business systems for analysis and operational decision-making. It can be deployed as a standalone system or integrated with ERP platforms, including native integration with Epicor Kinetic. Key capabilities: Flexible configuration: Drag-and-drop workflow configuration, task changes, and line balancing without custom development. Digital work instructions: Embedded editor supporting images, text, GIFs, videos, PDFs, and more to present workstation-specific guidance. Device connectivity: Integration with torque tools, barcode readers, gauges, printers, scales, vision systems, badge readers, and PLC-controlled equipment. Process validation: Pre-requisite pathway logic ensures required assembly and sub-assembly steps are completed before progression. Quality workflows: Reject, rework, and repair handling with recorded outcomes and operator prompts when required. Traceability and genealogy: Records component usage, operator activity, and device measurements for compliance and investigation. Data collection and reporting: Captures task-level activity including cycle times vs takt, good and bad part counts, Andon events, step confirmation results, and current production status. CPC is typically used in discrete manufacturing operations such as assembly, kitting, testing, repair, maintenance, and controlled processing activities where execution steps must be verified and documented.

Average Rating: 4.7/5.0

Total Reviews: 3

Who Is the Company Behind Epicor Connected Process Control?

  • Seller: Epicor
  • Company Website:
  • Year Founded: 1972
  • HQ Location: Austin, TX
  • Twitter: @Epicor
    9,286 Twitter followers
  • LinkedIn® Page: www.linkedin.com
    6,154 employees on LinkedIn®

Who Uses This Product?

  • Company Size: 67% Medium, 33% Small

What Are Recent G2 Reviews of Epicor Connected Process Control?

FactoryKPI

FactoryKPI is a real-time SQDC dashboard software built specifically for frontline manufacturing teams. Designed to replace outdated whiteboards and spreadsheets, FactoryKPI enables supervisors, operators, and team leaders to track Safety, Quality, Delivery, and Cost (SQDC) metrics digitally—all in one unified, visual platform. With its user-friendly interface and live data-sharing capabilities, FactoryKPI ensures that teams stay aligned on daily goals, problems are made visible instantly, and accountability becomes a shared responsibility across shifts. It empowers frontline leaders to drive continuous improvement without waiting for end-of-week reports. BUILT FOR THE SHOP FLOOR—NOT JUST FOR REPORTING FactoryKPI isn’t a general BI tool. It’s purpose-built for operators, team leads, and supervisors, ensuring everyone—from shift start to end-of-day reviews—is aligned on what's happening in real time. ✅ SQDC-first design Start your shift with a quick glance at your Safety, Quality, Delivery, and Cost metrics. Color-coded tiles and simple pass/fail indicators make team performance visible to everyone—no scrolling through charts or pivot tables. ✅ Live updates from the floor Team members and leads can enter notes, mark issues, and update completion status directly from tablets or shop-floor PCs. No more delays, manual roll-ups, or communication gaps between shifts. ✅ Custom categories that match your operation Not every plant uses the same metrics. Add or rename tiles like 5S, Productivity, Downtime, or Morale—whatever drives your factory’s daily accountability. ✅ Shift-by-shift visibility Easily compare today's performance with previous shifts. Spot patterns in delivery misses, repeated quality issues, or safety near-misses—all before they snowball. DESIGNED FOR FRONTLINE IMPROVEMENT & PROBLEM SOLVING FactoryKPI helps teams not just report, but solve problems faster and together. 🚩 Red Tiles Mean Action If a target is missed, it’s instantly flagged. Supervisors can add quick notes or root cause details, and teams can start resolving issues right away—not at the end of the week. 🔁 Standardized Daily Reviews Use the dashboard to guide morning huddles, Gemba walks, or end-of-shift reviews. Discuss wins, losses, and actions with a common, always-updated visual board. 🧠 Problem-solving mindset built-in FactoryKPI supports a culture of continuous improvement by helping teams focus on what's going wrong—and why—in real time. Ready to bring your daily management into the digital age? With FactoryKPI, your shop floor gains clarity, your teams gain ownership, and your results gain momentum.

Who Is the Company Behind FactoryKPI?

FactoryKPI - Executive

FactoryKPI – Executive is a Smart Factory Visual Dashboard with a logical mathematical system for easy comparisons to make decisions. Optional AI integration for insights. It provides a centralized platform to manage, compare, and analyze key performance indicators (KPIs) across your operations—empowering fast, data-driven executive decision-making. 💼 Core Features 👉🏻 Multi-plant KPI Comparison Standardize and compare performance across various facilities using a robust, mathematically consistent system—ideal for benchmarking and sharing best practices. orcalean.com 👉🏻 50+ Predefined KPIs or Custom Metrics Choose from a library of over 50 industry-standard KPIs or create your own to measure exactly what matters for your operation. 👉🏻 Trend Visualizations & Insights View easy-to-read trends for each KPI, and (optionally) use AI tools to uncover patterns, project future performance, or generate proactive recommendations—all within the same dashboard. 👉🏻 Role-Based Access Control Securely manage who can view or configure KPIs at each plant—ensuring the right data visibility for executives, managers, or corporate leadership. 👉🏻 Automated KPI Calculations & Configurable Dashboard Once configured, metrics auto-calculate—no more manual Excel! Customize board layout, symbol legends, columns, and display logic to suit your strategic reviews. 👉🏻 Optional AI Module Use AI/LLM-powered “chat” to query historic trends, run regressions, or generate future projections—all quickly and conversationally. 👉🏻 Flexible Deployment Options Choose from secure AWS cloud, private cloud integration, or on-premise deployment to match your enterprise IT and data residency policies. 🎯 Business Benefits ✅ Align Your Leadership Team Centralized KPI dashboards ensure clear alignment between plants and executive strategy—streamlining tier meetings, management reviews, and decision-making. ✅ Benchmark & Replicate Best Practices Objective, math-based plant comparisons help identify top-performing sites and facilitate knowledge-sharing across your enterprise. ✅ Shift Focus from Data Collection to Insight Automated data calculation and AI analytics free leadership from manual reporting—letting them focus on deeper analysis and action. ✅ Spot Trends Before They Become Issues Advanced visuals and AI forecasting help you anticipate dips or spikes in performance and act proactively. ✅ Secure & Auditable Data Governance Role-based access and secure storage ensure KPI integrity and compliance with audit and reporting policies. 💫 Best For: Ideal for COOs, plant heads, and executives managing multiple manufacturing sites who need real-time KPI visibility and cross-plant comparisons.

Who Is the Company Behind FactoryKPI - Executive?

Nathan Calabrese
NC
Researched and written by Nathan Calabrese
Updated October 3, 2024