Best Data Visualization Tools - Page 16

How Many Data Visualization Tools Products Does G2 Track?

Total Products under this Category: 478

Category Stats (Aug 2026)

  • Average Rating: 4.43/5 The average rating of products in this category, based on all submitted ratings
  • Top Trending Product: Supersimple (+0.89%) - Among all products in this category, Supersimple recorded the largest rating increase compared to last month

Last updated: August 04, 2026

How Does G2 Rank Data Visualization Tools Products?

Why You Can Trust G2's Software Rankings:

  • 30 Analysts and Data Experts
  • 26,100+ Authentic Reviews
  • 478+ Products
  • Unbiased Rankings

G2's software rankings are built on verified user reviews, rigorous moderation, and a consistent research methodology maintained by a team of analysts and data experts. Each product is measured using the same transparent criteria, with no paid placement or vendor influence. While reviews reflect real user experiences, which can be subjective, they offer valuable insight into how software performs in the hands of professionals. Together, these inputs power the G2 Score, a standardized way to compare tools within every category.

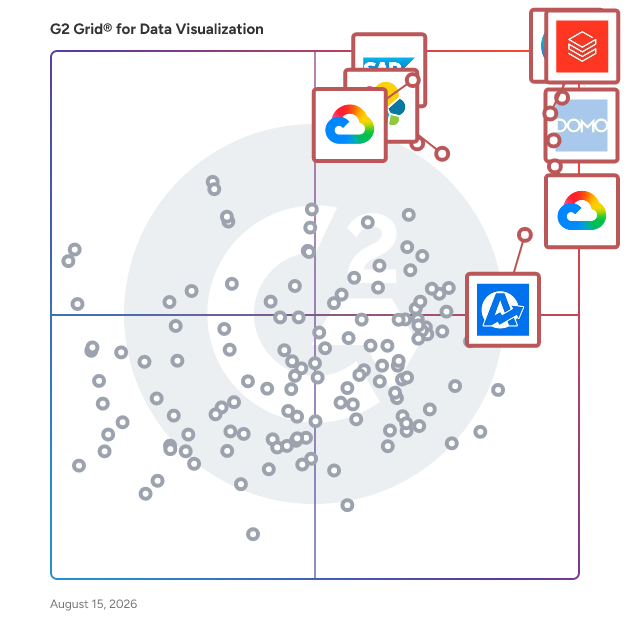
G2 Grid® for Data Visualization Tools

G2 Grid® for Data Visualization Tools plotting products by satisfaction and market presence

Highlighted products: Canva, Databricks, Domo, Looker, Data Studio, Elastic Stack, SAP HANA Cloud, and AgencyAnalytics.

Underlying data: [Grid® JSON](https://www.g2.com/categories/data-visualization-tools/grids.json?focus%5B%5D=canva&focus%5B%5D=databricks&focus%5B%5D=domo&focus%5B%5D=looker&focus%5B%5D=data-studio&focus%5B%5D=elastic-stack&focus%5B%5D=sap-hana-cloud-2025-10-01&focus%5B%5D=agencyanalytics)

Sponsored

Huwise

Huwise is a SaaS data product marketplace developed by a French company based in Paris, with over 15 years of experience. Recognized as a leading European player in data marketplace solutions by independent analyst firms, Huwise powers more than 3,000 data marketplaces across 25 countries. The platform is widely adopted across key industries including Banking & Insurance, Utilities and Energy, Transportation, Retail, Manufacturing and Central & Local Government. Huwise is a leading data product marketplace designed to transform raw data into AI-ready, business-ready data products. Unlike traditional data catalogs that primarily focus on metadata management and data discovery, Huwise actively drives data usage across organizations by converting data into actionable products. The platform is designed for business users, data product owners, data teams, and AI agents, providing a self-service, e-commerce-like experience that makes data more accessible, understandable, and usable across the organization. By enabling secure, governed, and scalable access to trusted data products, Huwise helps Chief Data Officers (CDOs) and Chief Data & AI Officers (CDAIOs) accelerate their data governance strategy, increase data adoption, and maximize the business impact of data and AI initiatives. Targeted at organizations seeking to enhance their data utilization, Huwise stands apart from conventional data platforms such as data lakes and cloud data warehouses. While these technologies are primarily focused on storing and processing large volumes of raw data, Huwise operates on top of the data stack to activate and distribute data. It ensures that data is not only understandable but also governed and directly usable throughout the organization. By complementing existing data catalog solutions, Huwise offers a business-facing access layer that integrates with raw, curated and certified data products, leveraging existing metadata and governance frameworks. The platform is built on data product principles, enabling organizations to publish and manage trusted, ready-to-use data products. Huwise facilitates self-service access to data without the need for technical expertise, ensuring that governance, security, and traceability are maintained across all data usage. Furthermore, it promotes data adoption through collaboration, feedback, and usage analytics, which are essential for driving engagement and maximizing the value of data within the organization. Huwise accelerates AI and analytics use cases by providing high-quality, contextualized data that enhances decision-making processes. Huwise also plays a crucial role in modern data architectures by supporting both the semantic layer and the emerging context layer. The semantic layer standardizes data definitions into business-friendly terms, while the context layer enriches this foundation with usage intelligence, lineage, governance, and real business interactions. This dual-layer approach enables both humans and AI to interpret and trust data accurately, reducing risks associated with misinterpretation or bias. As organizations increasingly adopt data mesh, data product strategies, and AI-driven operations, Huwise offers a modern approach for data sharing that is dedicated to drive data value and enhance business performance. It offers a data marketplace platform that not only organizes data but also activates it to deliver measurable business value. For companies aiming to maximize the potential of their data ecosystem, Huwise provides a future-proof, interoperable layer that bridges storage, governance, and consumption, ultimately accelerating data adoption and AI success at scale.

Visit website

Verb

Verb solves the real pain points of building end-user dashboards and reports so you can focus on your business while providing great data experiences to your users. Verb hosts your entire data experience - from data lake through embedded visualization - giving your team the tools to model, transform and create user experiences without having to write a single line of code.

Average Rating: 4.7/5.0

Total Reviews: 3

How Do G2 Users Rate Verb?

  • Has the product been a good partner in doing business?: 10.0/10 (Category avg: 9.0/10)
  • Dashboards: 10.0/10 (Category avg: 9.0/10)
  • Steps to Answer: 10.0/10 (Category avg: 8.6/10)
  • Formats: 10.0/10 (Category avg: 8.6/10)

Who Is the Company Behind Verb?

  • Seller: Verb
  • Year Founded: 2020
  • HQ Location: N/A
  • Twitter: @VerbData
    795 Twitter followers
  • LinkedIn® Page: www.linkedin.com
    2 employees on LinkedIn®

Who Uses This Product?

  • Company Size: 100% Small

What Are Recent G2 Reviews of Verb?

Vistaly

Vistaly is a comprehensive platform designed to help product teams make informed decisions by focusing on outcomes over outputs. It provides tools to visualize and connect business strategies, customer insights, and execution plans, ensuring alignment across all stages of product development. By integrating strategy, discovery, and delivery into a single workspace, Vistaly enables teams to prioritize effectively, track progress, and adapt to evolving market needs. Key Features and Functionality: - Tree View: A central hub where strategies, outcomes, goals, and key metrics are visually connected, facilitating a clear understanding of how various elements interrelate. - Roadmap View: Communicates product priorities by displaying active developments and upcoming customer problem-solving commitments, ensuring transparency and alignment with stakeholders. - Report View: Offers a portfolio-level overview of multiple teams' progress toward their outcomes, allowing leadership to quickly identify areas needing attention. - Experiment Tracker: Facilitates assumption testing by providing a clear view of experiment statuses, helping teams validate solutions before full-scale implementation. - Integrations: Seamlessly connects with tools like Jira, Slack, and Chrome extensions, streamlining workflows and enhancing productivity. Primary Value and Problem Solved: Vistaly addresses the challenge of aligning product development efforts with overarching business objectives. By providing a unified platform that connects strategy, discovery, and execution, it ensures that teams are not only building products efficiently but also building the right products that drive meaningful business outcomes. This alignment reduces wasted resources, accelerates time-to-market, and enhances the overall impact of product initiatives.

Average Rating: 4.3/5.0

Total Reviews: 3

How Do G2 Users Rate Vistaly?

  • Dashboards: 8.3/10 (Category avg: 9.0/10)
  • Steps to Answer: 7.5/10 (Category avg: 8.6/10)
  • Formats: 9.2/10 (Category avg: 8.6/10)

Who Is the Company Behind Vistaly?

Who Uses This Product?

  • Company Size: 67% Small, 33% Medium

What Are Recent G2 Reviews of Vistaly?

ZapDigits

ZapDigits is a modern marketing dashboard and client reporting platform built for agencies, freelancers, and marketing teams that want clear insights without complexity. As a powerful alternative to AgencyAnalytics, ZapDigits helps you centralize your marketing data and streamline reporting across all your campaigns. With ZapDigits, you can connect multiple data sources, track key performance metrics, and create clean, professional client reports in minutes. Instead of switching between tools or managing spreadsheets, everything lives in one intuitive dashboard designed for speed and simplicity. ZapDigits is built to make marketing reporting easier, faster, and more actionable. Whether you’re managing multiple clients, running campaigns, or delivering performance reports, it gives you real-time visibility into what’s working and where to optimize. If you're looking for an AgencyAnalytics alternative that is lightweight, flexible, and easy to use, ZapDigits is designed to help you save time and deliver better results for your clients.

Average Rating: 4.8/5.0

Total Reviews: 3

How Do G2 Users Rate ZapDigits?

  • Has the product been a good partner in doing business?: 10.0/10 (Category avg: 9.0/10)

Who Is the Company Behind ZapDigits?

Who Uses This Product?

  • Company Size: 100% Small

What Do G2 Reviewers Say About ZapDigits?

AI-generated summary from verified user reviews

Pros
  • Users highlight the ease of use of ZapDigits, enabling quick integrations and effortless report creation.
  • Users love the easy creation process of ZapDigits, enabling fast integrations and intuitive report building effortlessly.
  • Users love the easy integrations of ZapDigits, simplifying connections with various platforms in just minutes.
  • Users love the setup ease of ZapDigits, integrating tools effortlessly and creating reports without technical skills.

What Are Recent G2 Reviews of ZapDigits?

Zebra BI

Zebra BI is the missing layer that builds upon your Microsoft stack. It turns your Fabric, Power BI, Excel, and PowerPoint data into clear, decision-ready reports that everyone in the business reads the same way. Most companies have already invested in data infrastructure. What is still missing is the last step: turning that data into reports that show not just what happened, but why, and what to do next. That is where teams lose time to reporting complexity, inconsistent formats, and management meetings that debate the numbers instead of acting on them. Zebra BI closes that gap with three integrated visuals, Tables, Charts, and Cards, that put your numbers in context. Automatic variances, YoY growth, and comparisons to plan, previous year, or forecast are built in, so performance is understandable at a glance instead of buried in a table. When you need to go deeper, you can do it without leaving the report. Dynamic comments explain the story right next to the data, focus mode highlights what matters, scaling groups keep charts comparable, and drill-through lets anyone follow a number to its root cause. Because every visual follows IBCS, the gold standard for business communication, your reports speak one visual language, no matter who builds them or which department they come from. Finance, BI, operations, and sales teams all read performance the same way, with no relearning a new chart in every meeting. It is built for business users, not just data experts: drag, drop, done, with no complex setup or custom code. What used to take days now takes minutes, and it simplifies your data models and shortens your report development cycles along the way. Analysts get back to analysis instead of wrestling with formatting, and leaders act on the numbers instead of debating them. And with Zebra AI, you can go straight from your data, whether a semantic model, database, or spreadsheet, to a first dashboard, the analysis behind it, and a clear, decision-ready story to share with leadership. Zebra BI works natively across Power BI, Excel, PowerPoint, and Microsoft Fabric, so your reports stay consistent wherever your teams already work. Trusted by teams at 3,000+ companies worldwide, including Coca-Cola, Nestlé, PwC, Deloitte, and Microsoft. Try it for free with your data: https://zebrabi.com/pro-trial/

Average Rating: 4.3/5.0

Total Reviews: 3

How Do G2 Users Rate Zebra BI?

  • Has the product been a good partner in doing business?: 8.3/10 (Category avg: 9.0/10)
  • Dashboards: 10.0/10 (Category avg: 9.0/10)
  • Steps to Answer: 10.0/10 (Category avg: 8.6/10)
  • Formats: 10.0/10 (Category avg: 8.6/10)

Who Is the Company Behind Zebra BI?

  • Seller: Zebra BI
  • Year Founded: 2014
  • HQ Location: Ljubljana, SI
  • Twitter: @ZebraBI
    5,357 Twitter followers
  • LinkedIn® Page: www.linkedin.com
    67 employees on LinkedIn®

Who Uses This Product?

  • Company Size: 67% Small, 33% Large

What Are Recent G2 Reviews of Zebra BI?

What Are G2 Users Discussing About Zebra BI?

Aclysis

Elevate Your Business with our Best No-Code AIML Platform ACLYSIS - Drive Efficiency, Insight, and Growth with AI-Powered End to End Business Solutions. No Technical Expertise Needed. Discover the top AIML platform in India! Unlock AI potential without coding. Explore the best no-code solution for effortless machine learning. Get business insights and make strategic decisions in a few clicks like one, two, three .....

Average Rating: 5.0/5.0

Total Reviews: 2

How Do G2 Users Rate Aclysis?

  • Has the product been a good partner in doing business?: 10.0/10 (Category avg: 9.0/10)
  • Dashboards: 10.0/10 (Category avg: 9.0/10)
  • Steps to Answer: 10.0/10 (Category avg: 8.6/10)
  • Formats: 10.0/10 (Category avg: 8.6/10)

Who Is the Company Behind Aclysis?

Who Uses This Product?

  • Company Size: 50% Medium, 50% Small

What Are Recent G2 Reviews of Aclysis?

AD Report Builder

AD Report Builder is a data visualization solution with report builder, match and finds features, editor, column profiles, and email reports.

Average Rating: 5.0/5.0

Total Reviews: 2

How Do G2 Users Rate AD Report Builder?

  • Dashboards: 5.0/10 (Category avg: 9.0/10)
  • Steps to Answer: 9.2/10 (Category avg: 8.6/10)
  • Formats: 5.0/10 (Category avg: 8.6/10)

Who Is the Company Behind AD Report Builder?

  • Seller: Sysmalogic
  • Year Founded: 2017
  • HQ Location: Stockholm, SE
  • Twitter: @sysmalogic
  • LinkedIn® Page: www.linkedin.com
    2 employees on LinkedIn®

Who Uses This Product?

  • Company Size: 100% Large

What Are Recent G2 Reviews of AD Report Builder?

Altair Compose

Altair Compose is a comprehensive environment designed for mathematical computations, data manipulation, visualization, programming, and script debugging. It enables users to perform a wide array of mathematical operations, including linear algebra, matrix manipulations, statistics, differential equations, signal processing, control systems, polynomial fitting, and optimization. With its integrated development environment , Altair Compose facilitates the development and automation of algorithms, streamlining repeated computations and processes. Additionally, it offers native support for Computer-Aided Engineering and test result data, enhancing system understanding and supporting model-based development for multi-domain simulations. Key Features: - Numerical Computing: Provides hundreds of powerful mathematical operations and built-in functions for calculations ranging from simple to complex. - Rapid Algorithm Development: Allows users to explore multiple approaches and find solutions faster than with spreadsheets or traditional programming languages like C/C++. - Multi-language Math Environment: Based on the Open Matrix Language and compatible with Octave and Python, offering flexibility in programming. - Process Automation and Scripting: Facilitates the automation of repeated calculations and streamlining of common processes, with useful debugging capabilities. - Plotting and Visualization: Offers 2D and 3D plotting tools to provide richer insights from calculations and data. - Built-in CAE Data Readers: Enables easy import, visualization, and manipulation of data from physical testing and CAE applications like FEA, CFD, electromagnetics, and multibody dynamics. Primary Value and User Solutions: Altair Compose empowers engineers, scientists, and product developers to make informed decisions by performing essential engineering calculations based on first principles. Its all-in-one, user-friendly IDE eliminates the need for additional toolboxes, making it a cost-effective solution. The software's accessibility, either as a standalone tool or integrated with other Altair products, ensures flexibility and scalability. By automating processes and providing comprehensive data analysis and visualization tools, Altair Compose enhances productivity and accelerates the development of algorithms and models.

Average Rating: 4.5/5.0

Total Reviews: 2

How Do G2 Users Rate Altair Compose?

  • Dashboards: 9.2/10 (Category avg: 9.0/10)
  • Steps to Answer: 10.0/10 (Category avg: 8.6/10)

Who Is the Company Behind Altair Compose?

  • Seller: Altair
  • Year Founded: 1985
  • HQ Location: Troy, MI
  • LinkedIn® Page: www.linkedin.com
    2,774 employees on LinkedIn®
  • Ownership: NASDAQ:ALTR
  • Total Revenue (USD mm): $458

Who Uses This Product?

  • Company Size: 50% Medium, 50% Small

What Are Recent G2 Reviews of Altair Compose?

Apteco FastStats

Apteco FastStats® software provides a comprehensive suite of data exploration and visualisation tools that will help your business understand customer behaviour. A simple to use ‘drag and drop’ interface allows your team to perform powerful data analysis with ease and can be extended through optional add-on modules for data modelling, reporting and mapping. FastStats Modelling™ informs your targeting decisions and uses common analytical techniques to help you understand customer behaviour and target your communications more effectively. Integration with R provides advanced analytical users access to even more complex and valuable modelling techniques to give you real customer insight. FastStats Excelsior™ allows you to build custom reports configured to your business needs and share the results with your colleagues. Because FastStats Excelsior™ unites Excel and Apteco FastStats® visualisations, the resulting reports are even more powerful. Experience the power of Apteco software with a personal demo or free trial

Average Rating: 3.5/5.0

Total Reviews: 2

Who Is the Company Behind Apteco FastStats?

  • Seller: Apteco
  • Year Founded: 1987
  • HQ Location: Warwick, GB
  • Twitter: @Apteco
    646 Twitter followers
  • LinkedIn® Page: www.linkedin.com
    64 employees on LinkedIn®

Who Uses This Product?

  • Company Size: 100% Medium

What Are Recent G2 Reviews of Apteco FastStats?

What Are G2 Users Discussing About Apteco FastStats?

Bitam Artus

Artus®, Bitam's fully integrated business intelligence platform, provides organizations with access to the information they need and when they need it in order to make comprehensive and effective business decisions.

Average Rating: 4.3/5.0

Total Reviews: 2

How Do G2 Users Rate Bitam Artus?

  • Has the product been a good partner in doing business?: 10.0/10 (Category avg: 9.0/10)

Who Is the Company Behind Bitam Artus?

  • Seller: Bitam
  • Year Founded: 2000
  • HQ Location: Mexico
  • LinkedIn® Page: www.linkedin.com
    132 employees on LinkedIn®
  • Phone: 866-582-4826

Who Uses This Product?

  • Company Size: 50% Medium, 50% Small

What Are Recent G2 Reviews of Bitam Artus?

What Are G2 Users Discussing About Bitam Artus?

Callisto

SCCM, made beautiful. Callisto is the only dashboard portal for IT pros and the helpdesk to convert complex data into clear, responsive insights from System Center Configuration Manager.

Average Rating: 4.3/5.0

Total Reviews: 2

How Do G2 Users Rate Callisto?

  • Dashboards: 9.2/10 (Category avg: 9.0/10)
  • Steps to Answer: 10.0/10 (Category avg: 8.6/10)
  • Formats: 10.0/10 (Category avg: 8.6/10)

Who Is the Company Behind Callisto?

  • Seller: Callisto
  • Year Founded: 2011
  • HQ Location: Castle Rock, Colorado, United States
  • LinkedIn® Page: www.linkedin.com
    146 employees on LinkedIn®

Who Uses This Product?

  • Company Size: 100% Medium

What Are Recent G2 Reviews of Callisto?

Charts by VirtoSoftware

Charts by Virto is the ultimate data visualization tool for Microsoft Teams. With Virto Charts, you can collect data from any SharePoint list and create stunning visual reports and graphs that are perfect for presentations, project planning, or simply understanding your data better. Key features of Virto Charts: 1) Collect and report data in an engaging and visually appealing way. 2) Create reports by status, assignee, completion, lead time, and burndown. 3) Measure your team’s efficiency by checking progress and analyzing time spent on tasks. Say goodbye to tedious and time-consuming data gathering with Virto Charts!

Average Rating: 4.3/5.0

Total Reviews: 2

How Do G2 Users Rate Charts by VirtoSoftware?

  • Dashboards: 10.0/10 (Category avg: 9.0/10)
  • Steps to Answer: 9.2/10 (Category avg: 8.6/10)
  • Formats: 10.0/10 (Category avg: 8.6/10)

Who Is the Company Behind Charts by VirtoSoftware?

  • Seller: VirtoSoftware
  • Year Founded: 2009
  • HQ Location: Los Angeles, US
  • Twitter: @VirtoSoftware
    896 Twitter followers
  • LinkedIn® Page: www.linkedin.com
    15 employees on LinkedIn®

Who Uses This Product?

  • Company Size: 100% Medium

What Are Recent G2 Reviews of Charts by VirtoSoftware?

Chartwise

ChartWise is a comprehensive Clinical Documentation Improvement (CDI software designed to enhance the accuracy and efficiency of clinical documentation within healthcare organizations. By integrating advanced technologies, ChartWise streamlines the documentation process, ensuring compliance with healthcare regulations and improving patient care outcomes. Key Features and Functionality: - Advanced Search Capabilities: Utilizes enterprise search engines to quickly retrieve relevant clinical information. - Translation Services: Incorporates translation tools to support multilingual documentation needs. - Collaboration Platforms: Facilitates seamless collaboration among healthcare professionals through integrated platforms. - Version Control Tools: Ensures document integrity and traceability with robust version control mechanisms. - Design Portfolios: Offers customizable templates and design options to standardize documentation formats. Primary Value and Solutions Provided: ChartWise addresses common challenges in clinical documentation by automating routine tasks, reducing manual errors, and enhancing data accuracy. Its intuitive interface and seamless integration with existing workflows promote user adoption and operational efficiency. By implementing ChartWise, healthcare organizations can achieve improved compliance with healthcare regulations, enhanced patient care through accurate documentation, and increased overall productivity among clinical staff.

Average Rating: 3.5/5.0

Total Reviews: 2

How Do G2 Users Rate Chartwise?

  • Has the product been a good partner in doing business?: 6.7/10 (Category avg: 9.0/10)
  • Dashboards: 6.7/10 (Category avg: 9.0/10)
  • Steps to Answer: 5.0/10 (Category avg: 8.6/10)
  • Formats: 6.7/10 (Category avg: 8.6/10)

Who Is the Company Behind Chartwise?

Who Uses This Product?

  • Company Size: 50% Large, 50% Small

CobitSolutions

We create interactive reporting – dashboards of any complexity that work for all IT systems. Cobit Solutions started with the founder Dmytro Chashnyk creating interactive analytics for another one of his businesses. It was crucial to see what’s happening in ‘live’ mode and to analyze huge amounts of information quickly and precisely. Having gone through all of the available options, Dmitry picked Power BI. The system he developed helped him make the right decisions and increase company profit. Eventually, the system itself became its own business branch. That’s why Cobit Solutions is a synergy of IT and financial knowledge. We’re proud of our project managers’ many years of financial experience and our talented IT developers. Thanks to them we speak the language of business. Power BI Implementation services Design of the architecture of a future BI system Develop a roadmap and plan the stages for Power BI implementation Develop Power BI reports and dashboards Build KPI and the enterprise reporting system Integrate Power BI Report Server Dashboards developmentation services Develop dashboards based on Power BI, Microstrategy BI, Power BI Report Builder Redesign the existing dashboards Brush up or redo the dashboards created by other companies and integrators Support of the implemented business analytics system Data visualization for the analytics systems: Google Analytics, ERP, CRM, API, Excel etc. Set up data automatic updates Scale the reporting system currently in use, including those developed by other companies Data sources integration and data management Integrate Power BI with any IT systems Power BI and ERP integration ERP data structuring for analytics reports Build DWH data marts Build ETL-processes Develop OLAP-cubes based on SQL Server Analysis Services (SSAS) Developments based on SQL Server Integration Services (SSIS) Set up marketing end-to-end traffic analytics Visualization of data arrays and Excel-based management reports DAX data analysis & development Power BI license purchase Power BI Consulting & Business intelligence implementation strategy Consult regarding development and implementation of BI system and analytics Develop the strategy for company data management and data governance Employee workshops on working with interactive dashboards Employee workshops on how to create dashboards Mentor the implementation (if you decided to do it on your own) to speed up the process

Average Rating: 4.8/5.0

Total Reviews: 2

How Do G2 Users Rate CobitSolutions?

  • Dashboards: 10.0/10 (Category avg: 9.0/10)
  • Formats: 10.0/10 (Category avg: 8.6/10)

Who Is the Company Behind CobitSolutions?

Who Uses This Product?

  • Company Size: 100% Small

What Are Recent G2 Reviews of CobitSolutions?

Corvus Link

Corvus Link uses the transformative power of AI and automation to help innovators plan, build, and grow businesses around their ideas. Increase your productivity in our AI-enabled unified platform that can produce actionable plans, build necessary capabilities, and grow a company in an ever-changing market.

Average Rating: 4.8/5.0

Total Reviews: 2

How Do G2 Users Rate Corvus Link?

  • Dashboards: 8.3/10 (Category avg: 9.0/10)
  • Steps to Answer: 8.3/10 (Category avg: 8.6/10)
  • Formats: 7.5/10 (Category avg: 8.6/10)

Who Is the Company Behind Corvus Link?

Who Uses This Product?

  • Company Size: 50% Medium, 50% Small

What Are Recent G2 Reviews of Corvus Link?

Cue

Cue is your elite AI Analyst. Built for growth leaders. Cue combines data science rigor with business-specific intelligence. Access insights directly in Slack or through our intuitive interface — always accurate, customized to your practice, and trained and maintained by GTM experts you can trust. Elite analysis. Engineered for the Boardroom AND the day-to-day.

Average Rating: 5.0/5.0

Total Reviews: 4

How Do G2 Users Rate Cue?

  • Has the product been a good partner in doing business?: 10.0/10 (Category avg: 9.0/10)

Who Is the Company Behind Cue?

Who Uses This Product?

  • Company Size: 50% Medium, 50% Small

What Do G2 Reviewers Say About Cue?

AI-generated summary from verified user reviews

Pros
  • Users love the automation capabilities of Cue, enhancing efficiency and confidence in data-driven decision making.
  • Users find Cue extremely easy to use, enabling quick data analysis and boosting confidence in decision-making.
  • Users praise Cue's effortless data discovery, enabling confident decision-making with easy analyses and visualizations.
  • Users appreciate the easy integrations of Cue, allowing seamless data discovery and empowering confident decision-making.
  • Users love the time-saving benefits of Cue, allowing quick data analysis for efficient decision making.
Cons
  • Users note a steep learning curve in mastering Cue for optimal results, which is typical for AI tools.

What Are Recent G2 Reviews of Cue?

Bijou Barry
BB
Researched and written by Bijou Barry
Updated June 24, 2026