Best Time Series Intelligence Software - Page 3

How Many Time Series Intelligence Software Products Does G2 Track?

Total Products under this Category: 44

Category Stats (Sep 2026)

  • Average Rating: 4.48/5 The average rating of products in this category, based on all submitted ratings
  • Top Trending Product: Automatic Forecasting Systems (+0.94%) - Among all products in this category, Automatic Forecasting Systems recorded the largest rating increase compared to last month

Last updated: September 01, 2026

How Does G2 Rank Time Series Intelligence Software Products?

Why You Can Trust G2's Software Rankings:

  • 30 Analysts and Data Experts
  • 2,200+ Authentic Reviews
  • 44+ Products
  • Unbiased Rankings

G2's software rankings are built on verified user reviews, rigorous moderation, and a consistent research methodology maintained by a team of analysts and data experts. Each product is measured using the same transparent criteria, with no paid placement or vendor influence. While reviews reflect real user experiences, which can be subjective, they offer valuable insight into how software performs in the hands of professionals. Together, these inputs power the G2 Score, a standardized way to compare tools within every category.

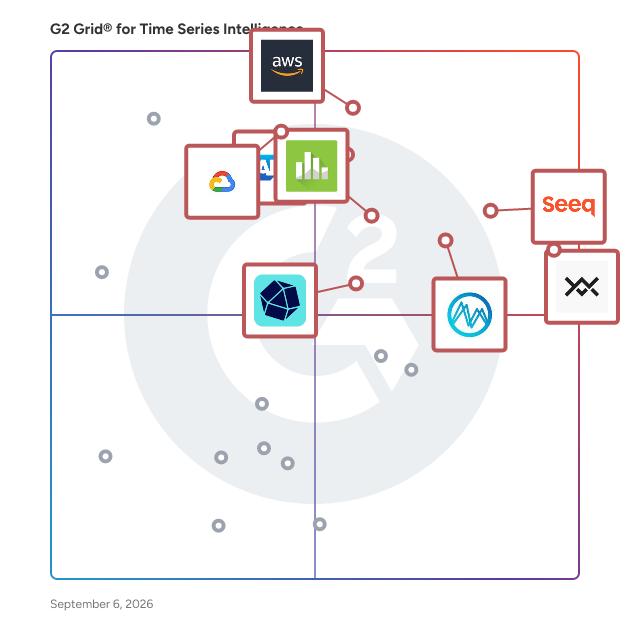
G2 Grid® for Time Series Intelligence Software

G2 Grid® for Time Series Intelligence Software plotting products by satisfaction and market presence

Highlighted products: Nixtla, Seeq, Amazon Forecast, SAP HANA Cloud, TrendMiner, Minitab Statistical Software, Google Cloud Interference API, and InfluxDB.

Underlying data: [Grid® JSON](https://www.g2.com/categories/time-series-intelligence/grids.json?focus%5B%5D=nixtla&focus%5B%5D=seeq&focus%5B%5D=amazon-forecast&focus%5B%5D=sap-hana-cloud-2025-10-01&focus%5B%5D=trendminer&focus%5B%5D=minitab-statistical-software&focus%5B%5D=google-cloud-interference-api&focus%5B%5D=influxdata-influxdb)

Visplore

Visplore is a visual analytics and industrial data analysis software solution that helps engineers perform systematic root cause analysis and time series analysis across complex process and production data. Visplore belongs to the categories of data analysis, industrial analytics, and visual analytics software. It is designed for manufacturing companies and process industries that need to investigate KPI deviations, production losses, quality issues, or energy inefficiencies. Typical users include process engineers, production managers, quality engineers, and operational excellence teams working with IT/OT data landscapes. The software supports use cases such as troubleshooting, deviation analysis, performance benchmarking, and structured visual analytics process optimization across sites and production units. Visplore is developed by an independent European software company headquartered in Vienna, Austria. Founded to bring advanced analytics closer to operational teams, the company focuses on industrial environments where transparency, on-premise deployment, and engineering usability are key requirements. The organization works closely with manufacturing customers across Europe and other industrial regions, supporting deployments in regulated and security-sensitive environments. Key features and functionality include: - Guided root cause analysis workflows for systematic investigation of KPI deviations - Interactive time series analysis across process, asset, quality, and material data - Integrated data analysis tools for multivariate exploration and hypothesis testing - Visual analytics process optimization templates that standardize investigations - On-premise deployment with seamless IT/OT connectivity Compared to other data analysis tools such as Seeq and TrendMiner, Visplore is built for on-premise deployments and for everyday engineering use, making industrial data analysis accessible, repeatable, and ready for action. The primary value of Visplore lies in closing the gap between monitoring and understanding. While dashboards show what happened, Visplore supports structured data analysis to explain why it happened. By embedding root cause analysis and time series analysis into guided, visual workflows, the software reduces reliance on manual spreadsheet work and isolated expert knowledge. Organizations use Visplore to shorten time-to-insight, standardize analytical best practices, and enable engineers to independently conduct deep investigations that support continuous improvement and sustainable visual analytics process optimization.

Average Rating: 4.4/5.0

Total Reviews: 4

How Do G2 Users Rate Visplore?

  • Ease of Setup: 7.5/10 (Category avg: 8.5/10)
  • Quality of Support: 8.3/10 (Category avg: 8.7/10)

Who Is the Company Behind Visplore?

  • Seller: Visplore
  • Company Website:
  • HQ Location: Vienna, AT
  • LinkedIn® Page: www.linkedin.com
    31 employees on LinkedIn®

Who Uses This Product?

  • Company Size: 50% Medium, 25% Large

What Do G2 Reviewers Say About Visplore?

AI-generated summary from verified user reviews

Pros
  • Users love the ease of use in Visplore, enabling quick analysis with minimal clicks and seamless integration.
  • Users value the efficiency of Visplore, enjoying quick setup and seamless integration for time series analysis.
  • Users praise the easy integrations of Visplore, allowing seamless database connection and efficient time series analysis.
  • Users love the easy-to-use interface of Visplore, which simplifies time series analysis with just a few clicks.

What Are Recent G2 Reviews of Visplore?

What Are G2 Users Discussing About Visplore?

Axibase Time Series Database

ATSD is a distributed NoSQL database designed from the ground up to store and analyze time-series data at scale. Unlike most other databases, ATSD comes with a robust set of built-in features including Rule Engine, Visualization, Data Forecasting, Data Mining and more.

Average Rating: 4.9/5.0

Total Reviews: 4

How Do G2 Users Rate Axibase Time Series Database?

  • Ease of Setup: 10.0/10 (Category avg: 8.5/10)
  • Ease of Admin: 10.0/10 (Category avg: 8.5/10)
  • Quality of Support: 9.6/10 (Category avg: 8.7/10)
  • Has the product been a good partner in doing business?: 10.0/10 (Category avg: 8.8/10)

Who Is the Company Behind Axibase Time Series Database?

  • Seller: Axibase
  • Year Founded: 2004
  • HQ Location: Cupertino, US
  • Twitter: @axibase
    55 Twitter followers
  • LinkedIn® Page: www.linkedin.com
    3 employees on LinkedIn®

Who Uses This Product?

  • Company Size: 50% Medium, 25% Large

What Are Recent G2 Reviews of Axibase Time Series Database?

What Are G2 Users Discussing About Axibase Time Series Database?

KronoGraph

KronoGraph is a JavaScript SDK for building browser-based, interactive, investigative timeline visualizations that reveal how events unfold. Tools built with KronoGraph give users fast, intuitive insight into sequences of events and how they are connected. Users can scroll through time to uncover anomalies and patterns, driving investigations and revealing the hidden story in their data. Timeline visualizations transition smoothly to look good at any scale – from a single event to a heatmap view of thousands. There are powerful filters for getting rid of clutter, plus useful annotation options for adding context. The KronoGraph toolkit is for JavaScript and React developers who need to build fully interactive timelines and embed them into their investigative web applications. It’s entirely customizable and works with any source of time-based data. There’s full support for both JavaScript and React throughout the SDK documentation, showcase demos and API library.

Average Rating: 4.3/5.0

Total Reviews: 2

How Do G2 Users Rate KronoGraph?

  • Quality of Support: 6.7/10 (Category avg: 8.7/10)

Who Is the Company Behind KronoGraph?

Who Uses This Product?

  • Company Size: 50% Medium, 50% Large

What Are Recent G2 Reviews of KronoGraph?

What Are G2 Users Discussing About KronoGraph?

Marple

Marple is a web-based time series data analysis platform for engineering teams. Marple has a specific focus on sensor data coming from tests and measurements. Marple offers both data management and data analysis features. It is especially strong in the visualisation of large time series data sets. Data can be uploaded using various file formats, or a connection with an existing Influx Database can be made. Marple has a free plan for individual users and a paid plan for teams.

Average Rating: 4.3/5.0

Total Reviews: 2

How Do G2 Users Rate Marple?

  • Ease of Setup: 8.3/10 (Category avg: 8.5/10)
  • Ease of Admin: 10.0/10 (Category avg: 8.5/10)
  • Quality of Support: 9.2/10 (Category avg: 8.7/10)
  • Has the product been a good partner in doing business?: 7.5/10 (Category avg: 8.8/10)

Who Is the Company Behind Marple?

  • Seller: Marple
  • Year Founded: 2020
  • HQ Location: Antwerp, BE
  • LinkedIn® Page: linkedin.com
    11 employees on LinkedIn®

Who Uses This Product?

  • Company Size: 50% Medium, 50% Small

What Are Recent G2 Reviews of Marple?

AxiBase Enterprise Reporter (AER)

Axibase Enterprise Reporter (AER) is a unified IT reporting solution for performance monitoring and capacity planning based on Linked Data and Self-Service concepts. The Linked Data architecture implemented in AER allows it to deliver reporting capabilities on top of underlying monitoring systems simultaneously, without copying the data.

Average Rating: 5.0/5.0

Total Reviews: 1

How Do G2 Users Rate AxiBase Enterprise Reporter (AER)?

  • Ease of Setup: 10.0/10 (Category avg: 8.5/10)
  • Ease of Admin: 10.0/10 (Category avg: 8.5/10)
  • Quality of Support: 10.0/10 (Category avg: 8.7/10)
  • Has the product been a good partner in doing business?: 10.0/10 (Category avg: 8.8/10)

Who Is the Company Behind AxiBase Enterprise Reporter (AER)?

  • Seller: Axibase
  • Year Founded: 2004
  • HQ Location: Cupertino, US
  • Twitter: @axibase
    55 Twitter followers
  • LinkedIn® Page: www.linkedin.com
    3 employees on LinkedIn®

Who Uses This Product?

  • Company Size: 100% Medium

What Are Recent G2 Reviews of AxiBase Enterprise Reporter (AER)?

What Are G2 Users Discussing About AxiBase Enterprise Reporter (AER)?

DATAHUB+

DataHUB+ is an enterprise time-series process data historian and visualization platform. It's scalable distributed data storage allows users to store all available structured, semi-structured and unstructured data reliably. DataHUB+ is built for rapid insights, reducing data wrangling time. Build your own data visualizations and dashboards, monitor operations in real time, create alerts and be confident in the integrity of your analysis. DataHUB+ is designed to be interoperable with your existing systems, and can be utilised for an unlimited number of plants, assets and equipment. Users can build data visualizations using dynamic dashboards or fully customize visualizations using drag & drop functionality. DataHUB+ also includes free-form calculations and statistical analysis capabilities. Discover a next generation process historian and visualization platform without hidden licensing fees, additional hardware costs or individual user costs.

Average Rating: 5.0/5.0

Total Reviews: 1

How Do G2 Users Rate DATAHUB+?

  • Ease of Setup: 8.3/10 (Category avg: 8.5/10)
  • Ease of Admin: 10.0/10 (Category avg: 8.5/10)
  • Quality of Support: 8.3/10 (Category avg: 8.7/10)
  • Has the product been a good partner in doing business?: 10.0/10 (Category avg: 8.8/10)

Who Is the Company Behind DATAHUB+?

  • Seller: VROC
  • Year Founded: 2016
  • HQ Location: East Perth, AU
  • Twitter: @vrocai
    60 Twitter followers
  • LinkedIn® Page: www.linkedin.com
    12 employees on LinkedIn®

Who Uses This Product?

  • Company Size: 100% Medium

What Are Recent G2 Reviews of DATAHUB+?

Imubit

Imubit is the leading provider of AI process optimization for refiners and chemical operators. The Imubit Closed-loop Neural Network Platform executes the plants’ money-making operational strategies continuously and consistently. Imubit’s platform interconnects various process units while aligning planning and economics, process engineering, process control and operations around the highest valued opportunities for closed loop optimization. To learn more about Imubit, please visit imubit.com.

Who Is the Company Behind Imubit?

  • Seller: Imubit
  • Year Founded: 2016
  • HQ Location: Houston, US
  • Twitter: @Imubit1
    43 Twitter followers
  • LinkedIn® Page: www.linkedin.com
    172 employees on LinkedIn®

Kinetica

Kinetica is the database for time & space. Kinetica makes it easy and fast to: - ingest massive amounts of IoT data and other contextual data sets - fuse data sets using spatial and temporal joins - analyze data using SQL based analytics for spatial, graph, and time-series analytics or running containerized ML models

Average Rating: 4.3/5.0

Total Reviews: 2

How Do G2 Users Rate Kinetica?

  • Ease of Setup: 9.2/10 (Category avg: 8.5/10)
  • Ease of Admin: 6.7/10 (Category avg: 8.5/10)
  • Quality of Support: 7.5/10 (Category avg: 8.7/10)
  • Has the product been a good partner in doing business?: 8.3/10 (Category avg: 8.8/10)

Who Is the Company Behind Kinetica?

  • Seller: Kinetica
  • Year Founded: 2016
  • HQ Location: Arlington, Virginia, United States
  • Twitter: @KineticaHQ
    3,461 Twitter followers
  • LinkedIn® Page: www.linkedin.com
    71 employees on LinkedIn®

Who Uses This Product?

  • Company Size: 100% Medium

What Are Recent G2 Reviews of Kinetica?

What Are G2 Users Discussing About Kinetica?

LineCraft AI

Linecraft is a data company providing manufacturing intelligence. Backed by 40+ years of world leading expertise in discrete manufacturing and automation. We uncover the hidden capacity in your production line by listening only to machine generated data. Our algorithm models machine operations at a much more granular level to find out the true bottlenecks in the line and give recommendations to improve throughput.

Who Is the Company Behind LineCraft AI?

Mt. Fuji

Mt. Fuji is an industrial AI and plant intelligence platform designed to help manufacturers gain real-time visibility, stability, and efficiency across their operations. By unifying data from PLC/DCS, MES/ERP, SCADA, and shift logs, Mt. Fuji standardizes and secures production data. Its AI-powered control system delivers predictive, preventive, and prescriptive insights, automatically adjusting parameters to maintain consistent quality and reduce variability. With features like real-time KPI tracking, batch-to-batch comparisons, anomaly detection, and digital twin dashboards, Mt. Fuji enables operators and executives alike to act faster with reliable insights. Manufacturers rely on Mt. Fuji to minimize downtime, enhance traceability, improve resource efficiency, and accelerate smarter decision-making, powering more agile, data-driven, and sustainable operations.

Who Is the Company Behind Mt. Fuji?

  • Seller: Haber
  • Year Founded: 2017
  • HQ Location: Pune, IN
  • Twitter: @HABER_TECH
    119 Twitter followers
  • LinkedIn® Page: www.linkedin.com
    225 employees on LinkedIn®

OPUS

Internet-based insurance agent administration system for policy underwriting.

Average Rating: 4.4/5.0

Total Reviews: 12

How Do G2 Users Rate OPUS?

  • Ease of Setup: 8.3/10 (Category avg: 8.5/10)
  • Ease of Admin: 7.5/10 (Category avg: 8.5/10)
  • Quality of Support: 9.2/10 (Category avg: 8.7/10)
  • Has the product been a good partner in doing business?: 8.3/10 (Category avg: 8.8/10)

Who Is the Company Behind OPUS?

Who Uses This Product?

  • Company Size: 54% Large, 31% Medium

What Are Recent G2 Reviews of OPUS?

What Are G2 Users Discussing About OPUS?

Sedai

Sedai goes beyond recommendations. Our platform takes action to autonomously manage and optimize your cloud resources, without manual intervention. It analyzes your production environment to find cost and reliability optimization opportunities in real time — learning from behavior patterns and adapting to new releases. Under the hood, Sedai uses deep reinforcement learning to predict the impact of potential optimizations, enabling the platform to take these actions safely. Sedai's unique approach makes it the only way way to manage and optimize the cloud at scale. Unlike conventional automation, Sedai doesn't follow fixed rules and scripts. Instead, it acts like an experienced SRE: incrementally adjusting the configuration of your resources until the exact point where performance or availability would be impacted. The result? Sedai has executed more than 25 million autonomous actions in production — with 0 incidents. Ready to save 30–50% on your cloud costs? Visit sedai.io to speak with our cloud optimization experts.

Average Rating: 4.5/5.0

Total Reviews: 4

How Do G2 Users Rate Sedai?

  • Ease of Setup: 7.5/10 (Category avg: 8.5/10)
  • Ease of Admin: 8.3/10 (Category avg: 8.5/10)
  • Quality of Support: 7.5/10 (Category avg: 8.7/10)
  • Has the product been a good partner in doing business?: 6.7/10 (Category avg: 8.8/10)

Who Is the Company Behind Sedai?

  • Seller: Sedai
  • Company Website:
  • Year Founded: 2018
  • HQ Location: Pleasanton, California, United States
  • Twitter: @sedai_io
  • LinkedIn® Page: www.linkedin.com
    121 employees on LinkedIn®

Who Uses This Product?

  • Company Size: 50% Medium, 50% Small

What Are Recent G2 Reviews of Sedai?

What Are G2 Users Discussing About Sedai?

Sift

Sift is a telemetry platform for teams building mission-critical machines, the rockets, satellites, autonomous vehicles, and defense systems whose sensor readings have to be trusted. It brings every channel of test and flight telemetry into one timeline, runs automated checks on every test, and surfaces anomalies while there is still time to act. Sift is the data layer itself, not a dashboard sitting on top of someone else's database, which is how it holds production-scale volume at nanosecond precision (one-billionth-of-a-second resolution). Engineers use Sift for flight test data analysis, hardware-in-the-loop testing, automated validation and verification on hardware telemetry, real-time fleet monitoring, time-series analysis, and root cause analysis. It ingests from test stands, flight systems, and automated runs in formats like CSV, ULOG, MCAP, TDMS, and MDF, and runs in the cloud, in a private cloud, in classified environments, or fully airgapped. Teams including K2 Space, CX2, Reliable Robotics, and Parallel Systems build on Sift. K2 Space scaled from 10 megabytes of telemetry a year to terabytes a day on the platform, and CX2 cut flight analysis from days to hours.

Who Is the Company Behind Sift?

VictoriaMetrics Anomaly Detection

VictoriaMetrics Anomaly Detection is a service that continuously scans time series stored in VictoriaMetrics and detects unexpected changes within data patterns in real time. It does so by utilizing user-configurable machine learning models. In the dynamic and complex world of system monitoring, VictoriaMetrics Anomaly Detection, a part of our Enterprise offering, is a pivotal tool for achieving advanced observability. It empowers SREs and DevOps teams by automating the intricate task of identifying abnormal behavior in time-series data. It goes beyond traditional threshold-based alerting, utilizing machine learning techniques to detect anomalies and minimize false positives, thus reducing alert fatigue. Providing simplified alerting mechanisms atop unified anomaly scores enables teams to spot and address potential issues faster, ensuring system reliability and operational efficiency.

Who Is the Company Behind VictoriaMetrics Anomaly Detection?

  • Seller: VictoriaMetrics
  • Year Founded: 2018
  • HQ Location: San Francisco, US
  • Twitter: @VictoriaMetrics
    2,785 Twitter followers
  • LinkedIn® Page: www.linkedin.com
    42 employees on LinkedIn®
Bijou Barry
BB
Researched and written by Bijou Barry
Updated October 3, 2024