Best Predictive Analytics Software for Medium-Sized Businesses - Page 3

How Many Predictive Analytics Software Products Does G2 Track?

Total Products under this Category: 586

Category Stats (Nov 2026)

  • Average Rating: 4.44/5 The average rating of products in this category, based on all submitted ratings
  • Top Trending Product: IFS Copperleaf (+1.9%) - Among all products in this category, IFS Copperleaf recorded the largest rating increase compared to last month

Last updated: November 01, 2026

How Does G2 Rank Predictive Analytics Software Products?

Why You Can Trust G2's Software Rankings:

  • 30 Analysts and Data Experts
  • 34,800+ Authentic Reviews
  • 586+ Products
  • Unbiased Rankings

G2's software rankings are built on verified user reviews, rigorous moderation, and a consistent research methodology maintained by a team of analysts and data experts. Each product is measured using the same transparent criteria, with no paid placement or vendor influence. While reviews reflect real user experiences, which can be subjective, they offer valuable insight into how software performs in the hands of professionals. Together, these inputs power the G2 Score, a standardized way to compare tools within every category.

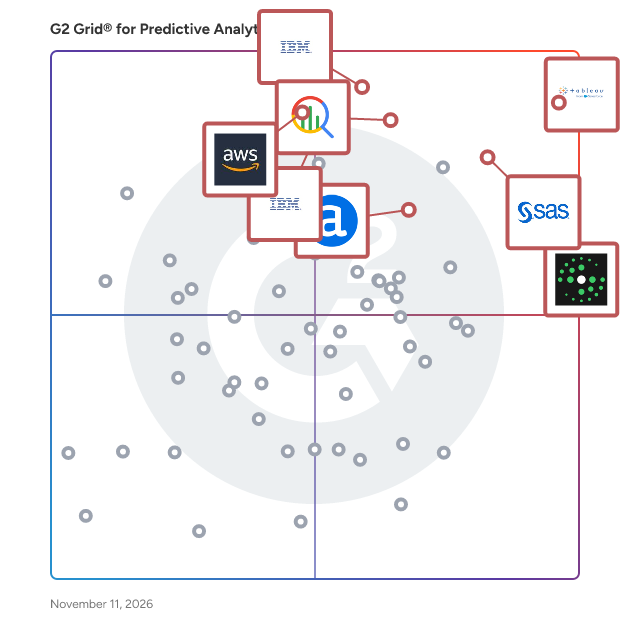
G2 Grid® for Predictive Analytics Software

G2 Grid® for Predictive Analytics Software plotting products by satisfaction and market presence

Highlighted products: Tableau, Salesloft, SAS Viya, Google Cloud BigQuery, IBM Cognos Analytics, Amazon Quick, Alteryx, and IBM SPSS Statistics.

Underlying data: [Grid® JSON](https://www.g2.com/categories/predictive-analytics/grids.json?focus%5B%5D=tableau&focus%5B%5D=salesloft&focus%5B%5D=sas-sas-viya&focus%5B%5D=google-cloud-bigquery&focus%5B%5D=ibm-cognos-analytics&focus%5B%5D=amazon-quick&focus%5B%5D=alteryx&focus%5B%5D=ibm-spss-statistics&segment=mid-market)

JMP

JMP, data analysis software for Mac and Windows, combines the strength of interactive visualization with powerful statistics. Importing and processing data is easy. The drag-and-drop interface, dynamically linked graphs, libraries of advanced analytic functionality, scripting language and ways of sharing findings with others, allows users to dig deeply into their data, with greater ease and speed. Originally developed in the 1980’s to capture the new value in GUI for personal computers, JMP remains dedicated to adding cutting-edge statistical methods and special analysis techniques from a variety of industries to the software’s functionality with each release. The organization's founder, John Sall, still serves as Chief Architect. To see a full list of data connectors please visit https://www.jmp.com/en/software/analytic-workflow/data-connectors

Average Rating: 4.5/5.0

Total Reviews: 206

How Do G2 Users Rate JMP?

  • Has the product been a good partner in doing business?: 8.9/10 (Category avg: 8.9/10)
  • AI Text Summarization: 10.0/10 (Category avg: 8.1/10)
  • Algorithms: 8.7/10 (Category avg: 8.6/10)
  • AI Text Generation: 10.0/10 (Category avg: 8.1/10)

Who Is the Company Behind JMP?

Who Uses This Product?

  • Who Uses This: Student
  • Top Industries: Higher Education, Information Technology and Services
  • Company Size: 42% Large, 33% Small

What Do G2 Reviewers Say About JMP?

AI-generated summary from verified user reviews

Pros
  • Users praise JMP for its ease of use, enabling effortless data exploration and visualization without complicated coding.
  • Users appreciate the ease of data visualization in JMP, facilitating clear insights and effective analysis without coding.
  • Users appreciate the ease of statistical analysis with JMP, allowing straightforward exploration and visualization of data.
  • Users appreciate the intuitive data visualization in JMP, allowing easy exploration and insight without complex coding.
  • Users praise the intuitive and interactive user interface of JMP, making data analysis and visualization effortless.
Cons
  • Users find JMP to be expensive, making it a challenge for individuals and small organizations with tight budgets.
  • Users find the learning curve steep, especially those less familiar with statistical analysis or coding-based tools.
  • Users find JMP offers limited flexibility in integrations and available models, restricting their analytical capabilities.
  • Users find JMP has a steep learning difficulty, requiring time and effort to master its advanced features.
  • Users experience limitations in storage with JMP, facing challenges in model availability and integration with other tools.

What Are Recent G2 Reviews of JMP?

What Are G2 Users Discussing About JMP?

ibi WebFOCUS

The ibi WebFOCUS® platform is an enterprise business intelligence and analytics solution equipped with data management, visual discovery, predictive analytics, and powerful visualizations. Combining these capabilities and data science in one unified platform, the WebFOCUS solution helps make data-driven decisions across the enterprise providing reports, dashboards, and customer-facing applications at scale.

Average Rating: 4.4/5.0

Total Reviews: 149

How Do G2 Users Rate ibi WebFOCUS?

  • Has the product been a good partner in doing business?: 8.9/10 (Category avg: 8.9/10)
  • Algorithms: 8.1/10 (Category avg: 8.6/10)

Who Is the Company Behind ibi WebFOCUS?

  • Seller: ibi
  • Year Founded: 1975
  • HQ Location: Fort Lauderdale, FL
  • LinkedIn® Page: www.linkedin.com
    890 employees on LinkedIn®
  • Phone: 212-736-4433

Who Uses This Product?

  • Top Industries: Information Technology and Services, Government Administration
  • Company Size: 57% Large, 32% Medium

What Are Recent G2 Reviews of ibi WebFOCUS?

What Are G2 Users Discussing About ibi WebFOCUS?

Spotfire Analytics

Spotfire® is a visual data science platform designed to help organizations address complex, industry-specific challenges by effectively utilizing data. This solution offers a range of flexible packaging options tailored to meet the diverse needs of teams at various stages of their visual data science journey. Turn raw data into real-time decisions with powerful, interactive visual analytics with Spotfire® Analytics. Spotfire Analytics is designed for business agility, enabling every user to explore data visually, uncover patterns quickly, and make confident, data-driven decisions without writing a single line of code. As a self-service visual data science solution, it empowers teams across roles and departments to gain fast, actionable insights that drive impact. With its no-code interactive dashboards and rich visual exploration capabilities, Spotfire Analytics connects natively to hundreds of cloud, on-premises, and real-time data sources. Built-in geoanalytics extend the power of analysis with multi-layer mapping and seamless integration of spatial data, while data wrangling and transformation can be performed directly within the visual interface, making it easy to clean, shape, and blend data as you analyze. AI-assisted recommendations and anomaly detection help uncover hidden patterns, suggest the most meaningful visualizations, and accelerate the path to discovery. Customizable visualizations, workflows, and an intuitive interface ensure that insights are not only easier to create but also easier to share. With seamless collaboration features, Spotfire Analytics enables teams to work together, align on insights, and act decisively. Whether the goal is to analyze trends, detect anomalies, or unlock location-based intelligence, Spotfire Analytics delivers the speed, flexibility, and depth needed to make smarter decisions with confidence. Explore and understand your data visually, uncover hidden insights, and build powerful analytics applications - all without writing a single line of code. Spotfire Analytics combines advanced interactive visualizations and intuitive data wrangling in one environment. Connect to hundreds of data sources, from files to real-time streaming data, and transform messy data directly within your visuals. Built-in AI recommendations help you find patterns, anomalies, and trends faster. With flexible visualizations, spatial analytics, and custom applications, anyone can turn raw data into actionable insights in minutes. Designed for business agility, Spotfire Analytics empowers every user to explore, analyze, and share results confidently - turning questions into decisions. Best for: Analysts, data-savvy professionals, and teams looking to explore and share data visually with maximum flexibility.

Average Rating: 4.2/5.0

Total Reviews: 328

How Do G2 Users Rate Spotfire Analytics?

  • Has the product been a good partner in doing business?: 8.4/10 (Category avg: 8.9/10)
  • AI Text Summarization: 8.3/10 (Category avg: 8.1/10)
  • Algorithms: 6.3/10 (Category avg: 8.6/10)
  • AI Text Generation: 8.3/10 (Category avg: 8.1/10)

Who Is the Company Behind Spotfire Analytics?

Who Uses This Product?

  • Who Uses This: Student, Manager
  • Top Industries: Oil & Energy, Information Technology and Services
  • Company Size: 52% Large, 26% Medium

What Do G2 Reviewers Say About Spotfire Analytics?

AI-generated summary from verified user reviews

Pros
  • Users appreciate the powerful data visualization capabilities of Spotfire Analytics, enabling easy understanding of complex datasets.
  • Users value the ease of use in Spotfire Analytics, enabling effortless data visualization and swift decision-making.
  • Users value the powerful integration capabilities of Spotfire Analytics, enhancing accuracy and visualization for complex datasets.
  • Users value the easy integrations of Spotfire Analytics, enhancing data accuracy and powering insightful analytics effortlessly.
  • Users admire the powerful integration with multiple data sources, enhancing analytics and streamlining decision-making processes.
Cons
  • Users find the learning curve steep, especially for newcomers, making initial use challenging despite its powerful features.
  • Users note that learning difficulty is significant for beginners, making adoption challenging without prior BI experience.
  • Users find Spotfire Analytics to be expensive, with high licensing and maintenance costs impacting smaller organizations.
  • Users find the steep learning curve of Spotfire Analytics challenging, especially for newcomers to BI tools.
  • Users find the complexity of Spotfire Analytics challenging, particularly those unfamiliar with data modeling and scripting.

What Are Recent G2 Reviews of Spotfire Analytics?

What Are G2 Users Discussing About Spotfire Analytics?

AI can help you find the answers. G2 helps you trust them.

Connect G2 to Claude or ChatGPT for answers grounded in G2's trusted reviews, comparisons, and pricing from real user insights.

How it works

Wolfram Mathematica

Mathematica is a computational software program based on symbolic mathematics, developed by Wolfram Research.

Average Rating: 4.1/5.0

Total Reviews: 86

How Do G2 Users Rate Wolfram Mathematica?

  • Has the product been a good partner in doing business?: 5.8/10 (Category avg: 8.9/10)

Who Is the Company Behind Wolfram Mathematica?

Who Uses This Product?

  • Who Uses This: Research Assistant
  • Top Industries: Research, Information Technology and Services
  • Company Size: 45% Large, 31% Small

What Are Recent G2 Reviews of Wolfram Mathematica?

What Are G2 Users Discussing About Wolfram Mathematica?

Hyllo

Hyllo is a comprehensive platform designed to streamline and enhance communication and collaboration within organizations. It offers a suite of tools that facilitate seamless interaction among team members, ensuring efficient project management and information sharing. By integrating various communication channels into a single interface, Hyllo simplifies workflows and reduces the need for multiple disparate tools. Key Features and Functionality: - Unified Communication: Combines messaging, video conferencing, and file sharing in one platform, enabling real-time collaboration. - Project Management Tools: Provides task assignment, progress tracking, and deadline management to keep projects on schedule. - Integration Capabilities: Seamlessly integrates with popular third-party applications, enhancing productivity without disrupting existing workflows. - Customizable Workspaces: Allows teams to create tailored environments that suit their specific needs and preferences. - Security and Compliance: Ensures data protection with robust security measures and compliance with industry standards. Primary Value and Solutions: Hyllo addresses the common challenges of fragmented communication and disjointed project management by offering a centralized platform that fosters transparency and efficiency. It eliminates the need for multiple tools, reducing complexity and costs. By enhancing collaboration and streamlining processes, Hyllo empowers teams to achieve their goals more effectively and with greater cohesion.

Average Rating: 4.3/5.0

Total Reviews: 27

How Do G2 Users Rate Hyllo?

  • Has the product been a good partner in doing business?: 9.0/10 (Category avg: 8.9/10)
  • AI Text Summarization: 8.5/10 (Category avg: 8.1/10)
  • Algorithms: 8.8/10 (Category avg: 8.6/10)
  • AI Text Generation: 8.4/10 (Category avg: 8.1/10)

Who Is the Company Behind Hyllo?

Who Uses This Product?

  • Top Industries: Information Technology and Services
  • Company Size: 56% Small, 37% Medium

What Do G2 Reviewers Say About Hyllo?

AI-generated summary from verified user reviews

Cons
  • Users often face 500 errors in the free version, making campaign trigger functionality frustrating and unreliable.

What Are Recent G2 Reviews of Hyllo?

Bijou Barry
BB
Researched and written by Bijou Barry
Updated