Best Data Visualization Tools - Page 33

How Many Data Visualization Tools Products Does G2 Track?

Total Products under this Category: 762

Category Stats (Nov 2026)

  • Average Rating: 4.44/5 The average rating of products in this category, based on all submitted ratings
  • Top Trending Product: Upsolve AI (+1.75%) - Among all products in this category, Upsolve AI recorded the largest rating increase compared to last month

Last updated: November 01, 2026

How Does G2 Rank Data Visualization Tools Products?

Why You Can Trust G2's Software Rankings:

  • 30 Analysts and Data Experts
  • 22,900+ Authentic Reviews
  • 762+ Products
  • Unbiased Rankings

G2's software rankings are built on verified user reviews, rigorous moderation, and a consistent research methodology maintained by a team of analysts and data experts. Each product is measured using the same transparent criteria, with no paid placement or vendor influence. While reviews reflect real user experiences, which can be subjective, they offer valuable insight into how software performs in the hands of professionals. Together, these inputs power the G2 Score, a standardized way to compare tools within every category.

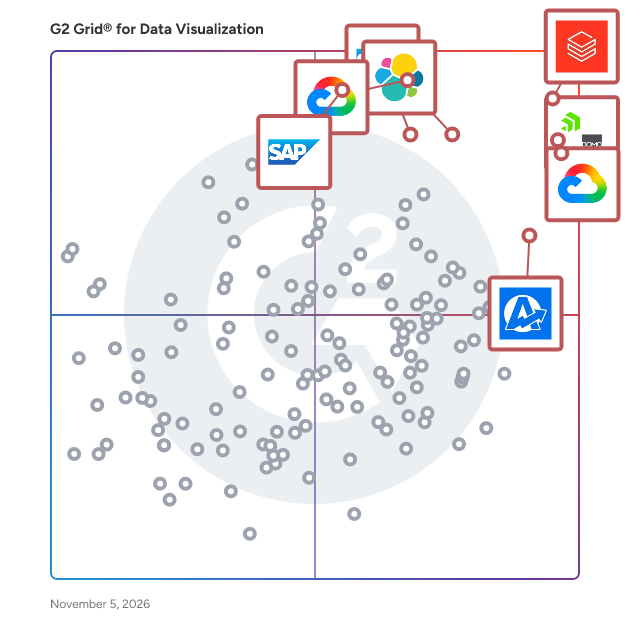
G2 Grid® for Data Visualization Tools

G2 Grid® for Data Visualization Tools plotting products by satisfaction and market presence

Highlighted products: Databricks, Domo, Looker, Data Studio, Elastic Stack, AgencyAnalytics, SAP HANA Cloud, and SAP Analytics Cloud.

Underlying data: [Grid® JSON](https://www.g2.com/categories/data-visualization-tools/grids.json?focus%5B%5D=databricks&focus%5B%5D=domo&focus%5B%5D=looker&focus%5B%5D=data-studio&focus%5B%5D=elastic-stack&focus%5B%5D=agencyanalytics&focus%5B%5D=sap-hana-cloud-2025-10-01&focus%5B%5D=sap-analytics-cloud)

Embedful

Embedful helps SaaS teams build and launch customer dashboards in minutes. Instead of spending weeks or months creating analytics features from scratch, you can connect your existing data, create a dashboard, and embed it directly into your product. Build secure customer-facing dashboards that give every account a personalized view of the data that matters to them. Embedful supports customer-specific dashboards, charts, tables, counters, and other visualizations designed for embedded analytics use cases. Configure your dashboard once and use it across multiple customers without duplicating the setup for every account. Embedful handles the dashboard layer so your team can focus on your core product instead of maintaining custom analytics infrastructure. Whether you are adding embedded analytics to an existing SaaS product or launching customer dashboards for the first time, Embedful provides a faster and simpler way to deliver polished analytics experiences. Connect your data, build your dashboard, and start embedding customer insights in minutes.

Who Is the Company Behind Embedful?

Encompass

Know Your Customer (KYC) regulation is evolving and so are the costs and impact on the global financial industry. Encompass' intelligent process automation platform for KYC dramatically improves the client experience, significantly speeding up KYC processes. Encompass automates gathering, processing and collation of primary and premium information and news discovery for KYC purposes - be that for new customer onboarding, event-driven refresh, or remediation. Using customers’ existing internal KYC policies and processes, Encompass constructs corporate ownership structures, discovers beneficial owners, and comprehensively screens entities and persons for risk - be that across structured watchlist data sets or unstructured adverse media sources. Advanced intelligent process automation builds a comprehensive KYC profile from multiple sources, facilitating fast, confident decisions. Encompass delivers a single platform to manage clients from large corporations through to small and medium sized enterprises and individuals.

Average Rating: 4.3/5.0

Total Reviews: 5

How Do G2 Users Rate Encompass?

  • Has the product been a good partner in doing business?: 10.0/10 (Category avg: 9.0/10)

Who Is the Company Behind Encompass?

  • Seller: Encompass
  • Year Founded: 2011
  • HQ Location: City of London, GB
  • LinkedIn® Page: www.linkedin.com
    148 employees on LinkedIn®

Who Uses This Product?

  • Top Industries: Financial Services
  • Company Size: 60% Medium, 20% Large

What Do G2 Reviewers Say About Encompass?

AI-generated summary from verified user reviews

Pros
  • Users value the improved communication provided by Encompass, enhancing collaboration and overall efficiency in managing loans.
  • Users find that Encompass offers excellent compliance features, enhancing tracking and visibility in loan management.
  • Users find Encompass enhances overall efficiency by streamlining document organization and improving communication across departments.
  • Users appreciate the accurate tracking and compliance features of Encompass, enhancing efficiency and communication in managing loans.
Cons
  • Users find the platform overwhelming for newcomers, with navigation issues and slow load times affecting productivity.
  • Users find Encompass has poor usability, especially with overwhelming navigation and occasional slow load times for newcomers.
  • Users experience slow performance with Encompass, as occasional load times hinder productivity and efficiency.

What Are Recent G2 Reviews of Encompass?

What Are G2 Users Discussing About Encompass?

EntelliFusion

An enterprise-class, evergreen, infinitely scalable & fully managed decision support platform… EntelliFusion is a comprehensive decision support capability. Rather than piecemeal together several different platforms for data prep, data warehousing & governance, EntelliFusion's architecture provides a one-stop shop for outfitting an organizations data infrastructure. EntelliFusion is used for business intelligence, analytics & machine learning capabilities all in one. It is also fully managed; EntelliFusion customers have enjoyed Teksouth's long standing history of professional services to ensure successful project completion. We ensure every customer makes it to the finish line of their data driven culture transformation by acting as their sole outfitter and guide for the journey. KEY FEATURES - Data Sources: Data Agnostic, Loads structure and semi-structured data - EntelliFusion Studio™: Metadata Driven, Business rules applied across platform, Code re-use - Modern Data Warehouse: Built to scale-out, scale-infinitely, Cloud or On-premise ready, Robust, redundant & reliable - EntelliCache™: Efficiency increases with use, Institutes late binding, Agile business rules available instantly - Communication: Fully managed optimization, Compressed & encrypted, Secure transmission of sensitive data - Perspectives: Full control of data representation, Captions & definitions applied to define data elements - Presentation: Free ad-hoc query & dashboard web app, Connection to COTS BI tool of your choosing, Self-service near real time KPIs Teksouth was founded in 1982 in Birmingham, AL. For the last two decades Teksouth has been a government contractor for data management and decision support, even providing an early government cloud environment some 15 years ago. EntelliFusion has been built and innovated on for about two decades while we have serviced several large DoD clients, proving itself performant while evergreen, constantly innovated on and built on the latest and greatest Microsoft technologies and frameworks. In it's largest instance, EntelliFusion securely manages 22 terabytes of queryable data, integrating 226 interfaces. This instance services 15,000 annual users who perform roughly 30 million ad-hoc queries annually with an average response time of 4 seconds. Teksouth has since launched EntelliFusion commercially.

Average Rating: 3.5/5.0

Total Reviews: 4

How Do G2 Users Rate EntelliFusion?

  • Has the product been a good partner in doing business?: 8.3/10 (Category avg: 9.0/10)

Who Is the Company Behind EntelliFusion?

  • Seller: Teksouth
  • Year Founded: 1983
  • HQ Location: Gardendale, US
  • LinkedIn® Page: www.linkedin.com
    150 employees on LinkedIn®

Who Uses This Product?

  • Company Size: 50% Small, 50% Medium

What Are Recent G2 Reviews of EntelliFusion?

AI can help you find the answers. G2 helps you trust them.

Connect G2 to Claude or ChatGPT for answers grounded in G2's trusted reviews, comparisons, and pricing from real user insights.

How it works

EquityRT

EquityRT is an innovative investment research platform that empowers finance and investment professionals with accurate data and intuitive tools to make research easier, faster and smarter. Get access to comprehensive global financial market data which includes rich fundamental analytics, shareholder analysis, stock estimates, sector analysis and much more. To complete your view of the world markets we have included access to global economic data for 200 countries in the same platform. It’s all about experience. With access to such a wide range of data, it is essential that you have the right tools on hand to analyze the data. Working with analysts across the globe, we have created a range of easy-to-use tools geared for analysis with speed and precision. Stay on top of your model portfolios, create eye-catching visualizations with advanced charting and grid capabilities, or do more advanced analysis using our excel addin. EquityRT - The easiest way to do investment research. Reach out to sales@equityrt.com for more information, or sign up for a free trial at equityrt.com.

Average Rating: 4.9/5.0

Total Reviews: 11

How Do G2 Users Rate EquityRT?

  • Has the product been a good partner in doing business?: 10.0/10 (Category avg: 9.0/10)

Who Is the Company Behind EquityRT?

  • Seller: EquityRT
  • Year Founded: 2018
  • HQ Location: Marietta, Georgia
  • LinkedIn® Page: www.linkedin.com
    42 employees on LinkedIn®

Who Uses This Product?

  • Company Size: 55% Small, 36% Medium

What Do G2 Reviewers Say About EquityRT?

AI-generated summary from verified user reviews

Pros
  • Users value the accuracy of EquityRT, finding it reliable for clear and easy comparisons of complex data.
  • Users value the effortless comparison capabilities of EquityRT, appreciating its clear layout and reliable data.
  • Users value the effortless data accessibility of EquityRT, making complex comparisons simple and reliable.
  • Users value the effortless comparison provided by EquityRT, as it presents complex data clearly and reliably.
  • Users appreciate the effortless comparison of companies and markets with clear, organized research data in EquityRT.
Cons
  • Users find that difficult learning is required to navigate EquityRT's many features effectively, which can be time-consuming.

What Are Recent G2 Reviews of EquityRT?

What Are G2 Users Discussing About EquityRT?

ERBuilder

ERBuilder Data Modeler allows developers to graphically design databases by using entity relationship diagrams and automatically generates the most popular SQL databases. It also allows developers to easily deploy databases by offering a sophisticated visual data modeling environment. The software reduces errors in database development while improving productivity and simplifying data modeling. Developers can visualize physical model structures to understand their databases, create new tables, modify, analyze and optimize the solution. ERBuilder provides all the features you would expect from a professional database modeling and design tool, it’s extremely easy to use and understand. Developed for beginners and expert database designers alike, it is fairly simple to familiarize yourself with

Average Rating: 3.5/5.0

Total Reviews: 1

Who Is the Company Behind ERBuilder?

Who Uses This Product?

  • Company Size: 100% Small

What Are G2 Users Discussing About ERBuilder?

evasys

evasys is web-based survey software for online, paper-based, and hybrid surveys. It automates feedback workflows from questionnaire creation to reporting, with AI-powered analysis that helps organizations turn responses into actionable insights.

Average Rating: 4.2/5.0

Total Reviews: 23

How Do G2 Users Rate evasys?

  • Has the product been a good partner in doing business?: 8.8/10 (Category avg: 9.0/10)

Who Is the Company Behind evasys?

  • Seller: evasys
  • Year Founded: 1996
  • HQ Location: Lüneburg, Niedersachsen
  • LinkedIn® Page: www.linkedin.com
    45 employees on LinkedIn®

Who Uses This Product?

  • Company Size: 48% Small, 43% Medium

What Do G2 Reviewers Say About evasys?

AI-generated summary from verified user reviews

Pros
  • Users love the seamless automation of EvaSys, enhancing their efficiency in managing feedback and data analysis.
  • Users appreciate the excellent customization options of EvaSys, enhancing their survey experience for effective feedback management.
  • Users appreciate the ease of creation with EvaSys, finding it suitable for a variety of surveys.
  • Users praise the intuitive ease of use of EvaSys, enhancing their efficiency in feedback management.
  • Users value the intuitive and customizable feedback management system of EvaSys, enhancing their survey experiences effectively.
Cons
  • Users find the complexity of evasys challenging for new users and hinder reporting and integration processes.
  • Users note the dependency issues with Evasys+, requiring evasys for functionality and limiting its standalone use.
  • Users find EvaSys to be expensive, particularly noting it's high cost for smaller organizations.
  • Users express concerns over integration issues, highlighting challenges that negatively impact usability and service efficiency.
  • Users find the learning curve steep, making initial setup and navigation somewhat challenging with EvaSys.

What Are Recent G2 Reviews of evasys?

What Are G2 Users Discussing About evasys?

Excel Chart Animation

Chart Animation is a Microsoft Excel plugin that allow you to create animated charts with an high level of customization.

Average Rating: 4.5/5.0

Total Reviews: 105

How Do G2 Users Rate Excel Chart Animation?

  • Has the product been a good partner in doing business?: 9.0/10 (Category avg: 9.0/10)

Who Is the Company Behind Excel Chart Animation?

Who Uses This Product?

  • Top Industries: Computer Software, Higher Education
  • Company Size: 46% Small, 36% Medium

What Do G2 Reviewers Say About Excel Chart Animation?

AI-generated summary from verified user reviews

Pros
  • Users value the enhanced data visualization of Excel Chart Animation, effectively showcasing trends and changes over time.
Cons
  • Users often find the complexity in setup and compatibility concerns make Excel Chart Animation challenging to use.
  • Users face setup complexities and compatibility issues with Excel Chart Animation, hindering a smooth user experience.

What Are Recent G2 Reviews of Excel Chart Animation?

What Are G2 Users Discussing About Excel Chart Animation?

Excel Dashboard Ai

Excel Dashboard AI is an AI-powered next-generation data reporting assistant designed to save 90% of reporting time for professionals worldwide. We streamline the entire workflow from Excel data ➔ analysis ➔ report generation ➔ PPT delivery, enabling professionals to obtain McKinsey-level data insights and reporting capabilities. In just 3 minutes, our AI can generate 20+ pages of professional-level data reports in PPT or Word format. How is it different from other tools? It doesn’t just make charts. It writes detailed reports and explains your data like a smart assistant who works 24/7. How does it work? It uses advanced AI models that understand what you want, find your data, create dashboards, write reports, and give business advice — all from one simple request. What types of data can it handle? Raw data in Excel or CSV, or connect your enterprise database. How fast is it? What used to take days can now be done in minutes — analyze many files, make 20+ charts, and produce a full report with 5,000+ words automatically. What are the main features? • Complete workflow: From cleaning data to creating reports, all in one step. • Deep insights: Automatically create a detailed analysis plan for your data. • Fast results: Get a 20-page report with clear charts and logic in minutes, export to PPT with one click. • Easy edits: Not happy with a chart or text? Ask AI to fix it easily. • Reusable templates: Save your custom report style and use it again with new data. • Multiple languages: Generate reports in English, Chinese, Japanese, Korean, and more. Available in both cloud and on-premises versions.

Who Is the Company Behind Excel Dashboard Ai?

Explorazor

Explorazor is a data exploration product built for sales and marketing teams at Consumer Goods and Pharma companies. Explorazor unifies primary sales, secondary sales, market research, and media data into one single dataset and helps users identify issues and opportunities to grow revenue, via a simple search interface.

Average Rating: 5.0/5.0

Total Reviews: 1

Who Is the Company Behind Explorazor?

Who Uses This Product?

  • Company Size: 100% Medium

What Are Recent G2 Reviews of Explorazor?

Exply

Explore Exply BI Features

Who Is the Company Behind Exply?

Facta Insights

Facta Insights is a subscription revenue software that unifies your data sources & sales contract data into a SaaS metrics platform that serves as single source of truth. Insights moves your team out from cluttered spreadsheets and empowers them to make strategic decisions with confidence. Automate and share the reporting of just about any SaaS metric you can think of.

Average Rating: 4.5/5.0

Total Reviews: 1

How Do G2 Users Rate Facta Insights?

  • Dashboards: 8.3/10 (Category avg: 9.0/10)
  • Steps to Answer: 8.3/10 (Category avg: 8.6/10)
  • Formats: 8.3/10 (Category avg: 8.6/10)

Who Is the Company Behind Facta Insights?

  • Seller: Facta
  • HQ Location: San Francisco, US
  • LinkedIn® Page: www.linkedin.com
    9 employees on LinkedIn®

Who Uses This Product?

  • Company Size: 100% Medium

What Are Recent G2 Reviews of Facta Insights?

FactoryTalk View

With FactoryTalk® View, by Rockwell Automation, you can get a clear consistent story from the standalone machine level HMI to distributed visualization solutions covering your entire enterprise. A single software package covers HMI challenges in process, batch and discrete application. Clear displays and a common programming language, including a huge library of faceplates, help confirm that you get the best possible perspectives of your machine performance. With users at multiple levels in your organization all seeing the same views of the machines, you speed up the ability to manage production…which is a story you can all get behind.

Average Rating: 3.0/5.0

Total Reviews: 1

Who Is the Company Behind FactoryTalk View?

  • Seller: Rockwell Automation
  • Year Founded: 1903
  • HQ Location: Milwaukee, WI
  • LinkedIn® Page: www.linkedin.com
    22,901 employees on LinkedIn®
  • Ownership: NYSE:ROK
  • Total Revenue (USD mm): $6,329

Who Uses This Product?

  • Company Size: 100% Medium

Factsmith Ask

FactSmith Ask is a governed answer layer over Kimball-style dimensional warehouses. Staff ask questions in plain language or by voice, and answers are checked against golden questions agreed in advance. It runs on your own network.

Who Is the Company Behind Factsmith Ask?

Flexa Tables

Flexa Tables is a Microsoft-certified Power BI custom visual built for BI developers and Finance teams who are tired of writing DAX variance measures. The problem it solves: In native Power BI, every variance report requires a separate DAX measure per metric per period. A Finance report tracking Revenue, Margin, Units, Cost, and EBITDA across DoD, MoM, and YoY generates 30+ measures — all of which break when the schema changes. Most BI developers spend more time maintaining variance measures than building actual reports. Flexa Tables eliminates this entirely. DoD, MoM, and YoY variance are built-in buttons. Select a period, click once, and the variance column appears — absolute value and percentage, color-coded green/red — directly in the published report. No DAX. No Desktop. No republishing. Who uses it: - BI Developers who want to stop rebuilding variance logic every sprint - Finance Analysts and FP&A teams who want self-service variance without filing a ticket - Data Managers who need to ship financial reports faster Core capabilities: - Built-in DoD / MoM / YoY — no measures required - Runs in Power BI Service — end-users add variance without Desktop access - Works with any existing data model — no changes to Power Query, DAX, or data sources - Absolute + percentage variance in a single column - Automatic green/red conditional formatting - Microsoft AppSource certified — installs in under 5 minutes - Free trial, no credit card required Trusted by teams at Accenture, Intel, BP, and General Motors. Available on Microsoft AppSource.

Who Is the Company Behind Flexa Tables?

flex.bi

flex.bi is a business intelligence and reporting system, it's a flexible and easy way to analyze and visualize your company's progress. A business intelligence tool that helps to gather all your company data in one place, save time on manual data management, make decisions faster, and motivate your team to reach targets in a more effective way. Best For: Small & medium businesses in any field who have data in different places (ERP systems, Excel or other files) & need a tool to unify all data in one place, visualize it & prepare for analysis. flex.bi Pricing Overview: flex.bi pricing starts at 35 EUR/ month. flex.bi offers a free trial. See additional pricing details below https://flex.bi/pricing/

Who Is the Company Behind flex.bi?

  • Seller: flex.bi
  • Year Founded: 2016
  • HQ Location: Riga, LV
  • LinkedIn® Page: www.linkedin.com
    7 employees on LinkedIn®
Bijou Barry
BB
Researched and written by Bijou Barry
Updated June 24, 2026