Best Data Visualization Tools - Page 17

How Many Data Visualization Tools Products Does G2 Track?

Total Products under this Category: 478

Category Stats (Aug 2026)

  • Average Rating: 4.43/5 The average rating of products in this category, based on all submitted ratings
  • Top Trending Product: Supersimple (+0.89%) - Among all products in this category, Supersimple recorded the largest rating increase compared to last month

Last updated: August 04, 2026

How Does G2 Rank Data Visualization Tools Products?

Why You Can Trust G2's Software Rankings:

  • 30 Analysts and Data Experts
  • 26,100+ Authentic Reviews
  • 478+ Products
  • Unbiased Rankings

G2's software rankings are built on verified user reviews, rigorous moderation, and a consistent research methodology maintained by a team of analysts and data experts. Each product is measured using the same transparent criteria, with no paid placement or vendor influence. While reviews reflect real user experiences, which can be subjective, they offer valuable insight into how software performs in the hands of professionals. Together, these inputs power the G2 Score, a standardized way to compare tools within every category.

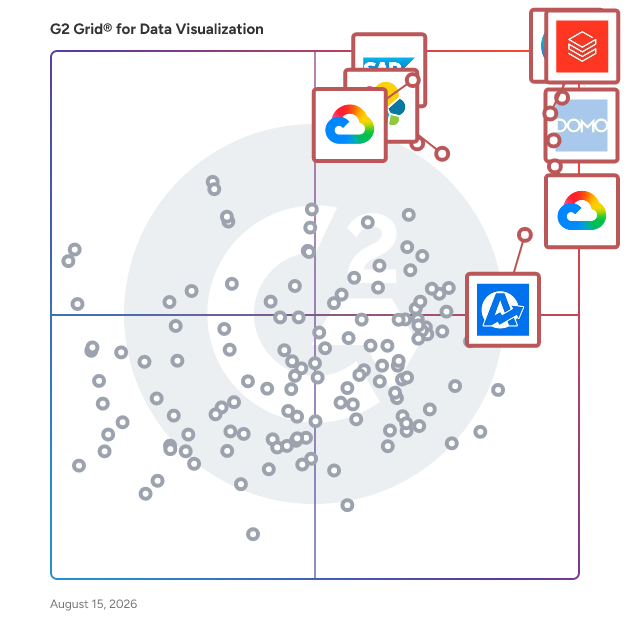
G2 Grid® for Data Visualization Tools

G2 Grid® for Data Visualization Tools plotting products by satisfaction and market presence

Highlighted products: Canva, Databricks, Domo, Looker, Data Studio, Elastic Stack, SAP HANA Cloud, and AgencyAnalytics.

Underlying data: [Grid® JSON](https://www.g2.com/categories/data-visualization-tools/grids.json?focus%5B%5D=canva&focus%5B%5D=databricks&focus%5B%5D=domo&focus%5B%5D=looker&focus%5B%5D=data-studio&focus%5B%5D=elastic-stack&focus%5B%5D=sap-hana-cloud-2025-10-01&focus%5B%5D=agencyanalytics)

Sponsored

Zoho Analytics

Zoho Analytics is a GenAI-powered self-service BI and analytics platform that helps businesses collect, prepare, analyze, and present insights from their data, all within minutes. Integrate with 500+ native data sources, like files, feeds, local and cloud databases, cloud storage, and popular business apps. Clean, transform, enrich, and catalog data with our agentic AI-powered, self-service data preparation and management capabilities. Create and manage complex ETL data pipelines using our visual pipeline builder, process stream data for real-time analytics, and set up a strong metrics layer for quality analysis and management. Zoho Analytics comes with 100+ domain-specific prebuilt reports and dashboards, pre-trained NLQ models, intelligently modeled and blended data across business applications, and lots more. Use our intuitive drag-and-drop visualization builder to build insightful and interactive reports and dashboards using a wide variety of visual components, like charts, widgets, pivot tables, tabular views and more. Generate customized reports and dashboards using simple, natural language with our AI-powered conversational agent, Zia. Ask Zia goes beyond basic reporting; it enables users to perform diagnostic analytics, forecast key metrics, and receive intelligent insights and recommendations. Users can assign tasks and trigger actions just by conversing with our agentic AI, Zia, streamlining their workflows and empowering data-driven decisions. Seamlessly embed Ask Zia into your custom or business applications to deliver contextual insights and actions. Enrich your analysis with automated insights by using our NLG-powered narration engine, Zia Insights. With diagnostic analytics for smarter decision-making, Zia Insights takes automated insights to the next level by bubbling up key drivers for particular business tasks. Enumerate complex business scenarios with what-if analyses, forecast KPIs, uncover trends and patterns with advanced analytical capabilities. Leverage cognitive analysis for keyword extraction and sentiment analysis, and more. Evaluate the best ML models with no-code assistance or develop custom models and functions using Python Code Studio. Zoho Analytics comes with pre-packed ML models (AutoML) that allow you to evaluate and pick the best model for your use case. Alternatively custom models and functions using Python Code Studio Embed our full-fledged analytics platform into other software applications. Craft and present immersive data stories through slideshows or purpose-built analytics portals. Collaborate securely through contextual comment threads and real-time messaging. Zoho Analytics has a robust set of APIs that enables elaborate customization and highly extensible low-code and no-code integration with any technology stack. It also offers a high degree of deployment flexibility (private, public, multi-cloud, and on-premises) and platform extensibility (professional services, partner support, and marketplace). Zoho Analytics is modern and scalable, and it can readily match growing data volumes and usage. Its time-tested and accredited enterprise-grade security features and governance framework ensure continuous data management and stewardship. On top of everything else, the TCO for Zoho Analytics—including licensing, implementation, customization, training, and support—is the lowest in our market.

Visit website

Dashtera

Create eye-catching, super-fast, instantly responsive dashboards in minutes with Dashtera. Built for speed and scale, our platform uses the world’s fastest GPU-accelerated technology to visualize masses of data in real-time. Dashtera empowers you to instantly share live, interactive dashboards, covering all your data visualization and data analytics needs. Experience the true power of Next-Gen Dashboards.

Average Rating: 5.0/5.0

Total Reviews: 2

How Do G2 Users Rate Dashtera?

  • Dashboards: 10.0/10 (Category avg: 9.0/10)
  • Steps to Answer: 10.0/10 (Category avg: 8.6/10)
  • Formats: 10.0/10 (Category avg: 8.6/10)

Who Is the Company Behind Dashtera?

Who Uses This Product?

  • Company Size: 100% Small

What Are Recent G2 Reviews of Dashtera?

Data Bloo

Data Bloo helps over 4,000 online businesses and agencies worldwide improve their decision-making and save reporting hours from their teams using ready-to-use marketing Looker Studio dashboards.

Average Rating: 3.0/5.0

Total Reviews: 2

How Do G2 Users Rate Data Bloo?

  • Dashboards: 10.0/10 (Category avg: 9.0/10)
  • Steps to Answer: 10.0/10 (Category avg: 8.6/10)
  • Formats: 10.0/10 (Category avg: 8.6/10)

Who Is the Company Behind Data Bloo?

Who Uses This Product?

  • Company Size: 100% Small

What Are Recent G2 Reviews of Data Bloo?

DataCalculus

DataCalculus “ Self-service advanced analytics without data science skills ” DataCalculus is autonomous software for sophisticated analytics to make the future happen now, without the need for data science skills. We believe that powerful analytical tools should be accessible to everyone, and our software is designed to be easy, fun, and fast for all. DataCalculus automatically handles all the complexities behind the scenes to provide the ultimate user experience for you. Through extensive research and development, we have created a general-purpose software that can analyze any tabular dataset and be mastered in just a few hours. With complete data privacy and security, our on-premise solution is like a private autonomous aircraft that can take you wherever you want without you needing to know how to pilot.

Average Rating: 3.8/5.0

Total Reviews: 2

Who Is the Company Behind DataCalculus?

Who Uses This Product?

  • Company Size: 100% Large

What Are Recent G2 Reviews of DataCalculus?

DataDynamic

Online and offline market research analysis and reporting tools for beginners and experts. Easily import/merge different datasets, edit data, create or recode new variables. Create and export complex tables including native support for many KPIs like NPS and EPS. Quickly export your tables to Excel or PDF. Easily build complex Powerpoint or PDF reports across hierarchical structures contained in your data. DataDynamic can even e-mail your reports directly using your own e-mail server.

Average Rating: 4.5/5.0

Total Reviews: 2

How Do G2 Users Rate DataDynamic?

  • Dashboards: 10.0/10 (Category avg: 9.0/10)
  • Steps to Answer: 9.2/10 (Category avg: 8.6/10)
  • Formats: 9.2/10 (Category avg: 8.6/10)

Who Is the Company Behind DataDynamic?

Who Uses This Product?

  • Company Size: 50% Large, 50% Small

What Are Recent G2 Reviews of DataDynamic?

DataMaaS

DataMaaS is a “Metrics as a Service” business with a cloud-based service model that unifies the data within your company, puts the business in control of its information and displays “Metrics with Meaning” enabling transparency, collaboration and new insights across your organization. Our Critical Information Centre combines our pre-built metric and KPI View ,process Flows and your disparate data to provide collective intelligence to answer your most critical questions.

Average Rating: 4.8/5.0

Total Reviews: 2

How Do G2 Users Rate DataMaaS?

  • Dashboards: 10.0/10 (Category avg: 9.0/10)
  • Steps to Answer: 10.0/10 (Category avg: 8.6/10)
  • Formats: 10.0/10 (Category avg: 8.6/10)

Who Is the Company Behind DataMaaS?

Who Uses This Product?

  • Company Size: 50% Medium, 50% Small

What Are Recent G2 Reviews of DataMaaS?

DAXRM

DAXRM – The All-in-One SEO & Marketing Operating System for Agencies DAXRM is an all-in-one digital agency extended relationship management platform — built by marketers, for marketers. It combines SEO, paid media, analytics, reporting, and client management into a single, powerful ecosystem. With DAXRM, all your marketing data lives in one place. Track performance across SEO, PPC, local search, social media, and conversions, uncover growth opportunities, and automate reporting — without juggling multiple tools. DAXRM delivers a true all-in-one SEO solution, including Local Rank Tracking, SEO Audits, Marketing & SEO Dashboards, and advanced white-label reporting designed specifically for agencies. Powerful Reporting & White-Label Solutions DAXRM offers two powerful reporting options: Google Looker Studio Integration Instantly generate advanced, customizable dashboards using Looker Studio. Create professional, white-labeled reports with live data at the click of a button. In-Built Custom Drag-and-Drop Reporting Design fully white-labelled reports using DAXRM’s built-in reporting engine. Drag, drop, customize, and schedule automated reports to be delivered to clients daily, weekly, or monthly — no third-party tools required. Perfect for agencies that want flexibility, automation, and full branding control. Advanced SEO & Local Rank Tracking With DAXRM Local Rank Tracker, monitor keyword rankings across any city, region, device, or search engine in real time. Track Google & Bing rankings Monitor local map pack performance Compare historical time periods Analyze ranking volatility and trends Identify SEO opportunities faster Pair this with automated SEO Audits to uncover technical issues, on-page gaps, and optimization opportunities — all in one dashboard. Marketing & SEO Dashboards DAXRM’s Marketing and SEO Dashboards give you a complete overview of your campaigns: SEO performance & keyword visibility Paid media ROI Website traffic & conversions Local SEO & GMB insights Social media engagement All data is visualized in clean, easy-to-understand dashboards that clients love. Built for Agencies: White-Label Everything DAXRM is a fully white-label solution for agencies: Custom domain Agency branding & logo Branded client dashboards White-labeled reports & emails Client-friendly portals Your clients see your brand, not a third-party tool. DAXRM — We streamline your marketing data, so you can focus on insights and growth. DAXRM – Key Features ● Client Management Manage clients and projects, access real-time marketing data, generate invoices, create reports, and centralize communication — all from one platform. ● Project Management Organize tasks, manage teams, and track progress using customizable project templates built for marketing workflows. ● All-in-One SEO Solution Local rank tracking, SEO audits, keyword monitoring, performance analysis, and actionable insights — no extra tools required. ● Marketing & SEO Dashboards Pre-built and custom dashboards that showcase SEO, PPC, traffic, conversions, and ROI in one unified view. ● Looker Studio Reporting Leverage the power of Looker Studio to create highly customizable, interactive, and white-labeled reports instantly. ● In-Built White-Label Reporting Custom drag-and-drop reports with automated scheduling for hands-free client reporting. Marketing & Analytics Integrations ● Google Ads Manage PPC campaigns, analyze performance, track ROI, and explore keyword insights. ● Google Analytics Understand user behavior, segment audiences, track conversions, and measure campaign success. ● Google My Business (GBP) Track local search visibility, calls, directions, reviews, and engagement. ● Google Search Console Monitor search queries, pages, indexing status, and average rankings. ● Facebook Page Insights Analyze engagement, reach, demographics, and audience interactions. ● Facebook Ads Optimize ad performance, track conversions, and measure ROI. ● Microsoft Ads Manage PPC campaigns, keyword performance, reporting, and ROI tracking. ● Bing Webmaster Tools Review search performance, crawl errors, rankings, and page insights. ● Accounting & Other Integrations Xero and additional connectors to centralize business and marketing data.

Average Rating: 5.0/5.0

Total Reviews: 10

How Do G2 Users Rate DAXRM?

  • Has the product been a good partner in doing business?: 9.7/10 (Category avg: 9.0/10)
  • Dashboards: 9.2/10 (Category avg: 9.0/10)
  • Steps to Answer: 10.0/10 (Category avg: 8.6/10)
  • Formats: 10.0/10 (Category avg: 8.6/10)

Who Is the Company Behind DAXRM?

  • Seller: DAXRM
  • Year Founded: 2020
  • HQ Location: Melbourne, AU
  • Twitter: @DigiAgencyXRM
    2 Twitter followers
  • LinkedIn® Page: www.linkedin.com
    1 employees on LinkedIn®

Who Uses This Product?

  • Company Size: 60% Small, 20% Large

What Do G2 Reviewers Say About DAXRM?

AI-generated summary from verified user reviews

Pros
  • Users enjoy the time-saving features of DAXRM, streamlining client management and reporting for agencies and small businesses.
  • Users value the effective content optimization and support from DAXRM, enhancing their SEO strategies and data visualization.
  • Users commend DAXRM for its excellent customer support and effective tools for content optimization and data visualization.
  • Users appreciate the easy data visualization and personalized support from DAXRM, enhancing their data management experience.
  • Users appreciate the user-friendly design of DAXRM, making it easy for everyone to navigate and utilize effectively.
Cons
  • Users desire more integration options with platforms like Twitter and Instagram for better functionality in DAXRM.
  • Users feel that keyword automation tools in DAXRM are lacking and need significant improvement for better functionality.
  • Users find a lack of information on special functions, complicating usability for those with limited technical knowledge.
  • Users find the learning curve steep for some features, requiring prior programming knowledge that not all have.
  • Users request more customization options for DAXRM to better tailor reports to their specific campaign needs.

What Are Recent G2 Reviews of DAXRM?

Dezbor

Dezbor is a transformative no-code platform redefining data dashboard creation. Connect to your database, manipulate drag-and-drop components, and tailor them to meet your business requirements. Dezbor's unparalleled flexibility and simplicity make it a powerful tool for businesses of all sizes. With Dezbor, you can own your data and turn it into actionable insights without writing a single line of code.

Average Rating: 4.5/5.0

Total Reviews: 2

How Do G2 Users Rate Dezbor?

  • Has the product been a good partner in doing business?: 5.0/10 (Category avg: 9.0/10)

Who Is the Company Behind Dezbor?

Who Uses This Product?

  • Company Size: 50% Medium, 50% Large

What Are Recent G2 Reviews of Dezbor?

DISQOVER

DISQOVER is a knowledge discovery platform that links siloed data using knowledge graph and semantic technologies, helping life sciences organizations accelerate their drug development activities. Users can search across disparate public and private data sources through a single interface that enables easy and efficient data discovery and exploration. DISQOVER allows researchers and collaborators to swiftly access valuable insights in one place, ensuring that information isn’t overlooked for faster and more accurate decision-making. With DISQOVER, organizations enjoy the benefits of FAIR data, facilitating interoperability, and connectivity with other applications while building a scalable enterprise-linked data ecosystem. Additionally, DISQOVER’s open plug-in architecture allows an organization to seamlessly connect specialized artificial intelligence (AI) services to annotated, standardized, and structured data. DISQOVER is also available with natural language processing (NLP) capabilities ensuring users can maximize the value of their internal unstructured data, along with unstructured public data. Developed specifically for life sciences companies, DISQOVER has over 10,000 users ranging from scientific researchers, bioinformaticians, data scientists, and business profiles. DISQOVER can be deployed to support across the entire drug development life cycle and has four major application areas: R&D, Clinical, Regulatory, and Cross-Functional Intelligence. Customers include AstraZeneca, Amgen, the Princess Máxima Center for Pediatric Oncology, e-therapeutics, among others.

Average Rating: 4.5/5.0

Total Reviews: 4

How Do G2 Users Rate DISQOVER?

  • Has the product been a good partner in doing business?: 10.0/10 (Category avg: 9.0/10)
  • Dashboards: 9.2/10 (Category avg: 9.0/10)
  • Steps to Answer: 6.7/10 (Category avg: 8.6/10)
  • Formats: 5.8/10 (Category avg: 8.6/10)

Who Is the Company Behind DISQOVER?

Who Uses This Product?

  • Company Size: 75% Small, 25% Medium

What Do G2 Reviewers Say About DISQOVER?

AI-generated summary from verified user reviews

Pros
  • Users value the data accuracy provided by DISQOVER, thanks to its ontology-based knowledge graph integration.
  • Users appreciate the ontology-based knowledge graph in DISQOVER for its ability to integrate and structure data effectively.
  • Users appreciate the ease of use of DISQOVER, simplifying data search and exploration significantly.
  • Users appreciate the easy integrations of DISQOVER, simplifying data linking and structuring through ontology-based knowledge graphs.
  • Users value the ontology-based knowledge graph integration in DISQOVER, enhancing data linking and structuring capabilities.
Cons
  • Users find DISQOVER to be complex and difficult to learn, which hampers their overall experience and usability.
  • Users find DISQOVER to be complex and difficult to learn, which hampers their overall usability experience.
  • Users find DISQOVER to be complex and difficult to learn, leading to frustration in navigating the platform.
  • Users find DISQOVER to be complex and difficult to learn, hindering their overall user experience.
  • Users find the learning curve steep, making it complex and difficult to master DISQOVER effectively.

What Are Recent G2 Reviews of DISQOVER?

EazyBI Cloud

eazyBI provides easy-to-use drag-and-drop creation of reports, charts and dashboards. Analyze imported data measures by any dimension, identify trends and top/bottom performers, start from summary overview and drill into details.

Average Rating: 3.8/5.0

Total Reviews: 2

Who Is the Company Behind EazyBI Cloud?

  • Seller: eazyBI
  • Year Founded: 2011
  • HQ Location: Jurmala, LV
  • Twitter: @eazybi
    719 Twitter followers
  • LinkedIn® Page: www.linkedin.com
    30 employees on LinkedIn®

Who Uses This Product?

  • Company Size: 100% Large

What Are Recent G2 Reviews of EazyBI Cloud?

Envisio

Envisio is a strategic planning and performance management platform designed exclusively for public sector organizations to plan, track, manage, and report on progress toward organizational goals. Envisio supports governments, educational institutions, healthcare organizations, and nonprofits that need to align staff with strategic goals, manage projects, and drive community outcomes, all while maintaining transparency and accountability. At its core, Envisio helps organizations connect day-to-day work with higher-level strategic objectives and increase visibility of progress and impact. Rather than functioning solely as a task or project management tool, it focuses on strategy execution, enabling users to define goals, track measurable outcomes, and understand how individual initiatives contribute to broader priorities. Key capabilities and use cases include: Strategic plan management Bring your strategic plan to life. Define strategic priorities, actions, projects, and outcomes and track progress over time. Envisio supports long-range plans, multi-year strategies, and planning frameworks commonly used in the public sector. Performance measurement and reporting The Envisio platform allows teams to monitor KPIs, performance measures, and outcomes through dashboards and structured reports. These views are used to support internal decision-making and external reporting to leadership, boards, or the public. Reports can be auto-generated and scheduled for different audiences. Project management Envisio includes a full suite of project management tools designed for public sector work. Projects, programs, and capital improvement initiatives can be tied directly to strategic goals, helping teams understand how their work supports organizational priorities. Cross-department collaboration Multiple departments and stakeholders can contribute updates within a shared system, reducing reliance on disconnected spreadsheets, documents, or slide decks. Public transparency and trust-building Many organizations use Envisio to share progress publicly through beautiful, research-backed dashboards that explain priorities, show progress, and share results in a compelling, accessible format. AI-assisted reporting and analysis The Envisio platform includes tools that assist with summarizing progress, identifying trends, creating visuals, and generating narrative content to support reporting workflows. Reduction of manual work Organizations that use Envisio report significant time savings around report creation, chasing progress updates, and making decisions. Envisio is typically used by strategy teams, performance managers, executive leadership, city management offices, and departmental leads who are responsible for planning, tracking, and communicating organizational performance. Its features reflect the governance, accountability, accessibility, and reporting needs specific to public sector environments.

Average Rating: 4.7/5.0

Total Reviews: 14

How Do G2 Users Rate Envisio?

  • Has the product been a good partner in doing business?: 9.6/10 (Category avg: 9.0/10)

Who Is the Company Behind Envisio?

  • Seller: Envisio Solutions
  • Company Website:
  • Year Founded: 2012
  • HQ Location: Vancouver, CA
  • Twitter: @Envisioinc
    836 Twitter followers
  • LinkedIn® Page: www.linkedin.com
    43 employees on LinkedIn®

Who Uses This Product?

  • Top Industries: Government Administration
  • Company Size: 71% Medium, 21% Large

What Do G2 Reviewers Say About Envisio?

AI-generated summary from verified user reviews

Pros
  • Users commend the exceptional customer support from Envisio, noting the responsiveness and evolution with their needs.
  • Users value the accountability features of Envisio, enhancing transparency and progress tracking for major initiatives.
  • Users find Envisio to be intuitive and easy to learn, streamlining project tracking and reporting for various audiences.
  • Users value the extensive training and support which enhances their experience and fosters community engagement.
  • Users commend the user-friendly interface of Envisio, making it easy to train and engage others effectively.
Cons
  • Users express frustration over limited reporting capabilities, particularly in accessing historical data and past reports.
  • Users find the dashboard issues can hinder usability, although bugs are typically resolved swiftly.
  • Users face a steep learning curve with Envisio, despite having access to helpful resources and support.
  • Users report integration difficulties with Envisio when connecting to other reporting tools, hindering seamless functionality.
  • Users experience a steeper learning curve than anticipated, though support resources help in overcoming challenges.

What Are Recent G2 Reviews of Envisio?

What Are G2 Users Discussing About Envisio?

Frappe Insights

Frappe Insights is an open-source data visualisation and analytics tool that helps you to analyse and optimise your business. It has been designed for a predictable and great user experience. It is built on top of Frappe Framework and is available for free. Features: - A range of data visualisation options, including charts, graphs, tables, and pivot tables - Has a user-friendly interface - Allows customisations - Supports collaboration

Average Rating: 3.3/5.0

Total Reviews: 2

How Do G2 Users Rate Frappe Insights?

  • Has the product been a good partner in doing business?: 7.5/10 (Category avg: 9.0/10)
  • Dashboards: 6.7/10 (Category avg: 9.0/10)
  • Steps to Answer: 6.7/10 (Category avg: 8.6/10)
  • Formats: 5.0/10 (Category avg: 8.6/10)

Who Is the Company Behind Frappe Insights?

Who Uses This Product?

  • Company Size: 50% Medium, 50% Small

What Do G2 Reviewers Say About Frappe Insights?

AI-generated summary from verified user reviews

Pros
  • Users enjoy the ease of use in building dashboards and reports with live data effortlessly.
  • Users appreciate the ease of creating dashboards and reports with live data, simplifying business analytics significantly.
Cons
  • Users note the limitations in storage, particularly with advanced analytics on large datasets affecting performance.
  • Users experience limited advanced analytics features in Frappe Insights, especially when handling large datasets.
  • Users face slow performance when handling large datasets, impacting the usability of Frappe Insights' advanced analytics features.

What Are Recent G2 Reviews of Frappe Insights?

Gemini Data

Gemini Enterprise is a cloud-native, no-code platform designed to seamlessly integrate generative AI with your organization's critical business data. By creating a contextual layer atop existing data sources, it enables rapid decision-making through a secure and trustworthy AI experience. This user-friendly platform allows both technical and non-technical users to connect, manage, and analyze data without the need for specialized IT skills, accelerating the adoption of AI-driven insights across the enterprise. Key Features and Functionality: - Data Connectivity: Easily connect to various enterprise data sources, including sales, finance, products, supply chain, and security, facilitating comprehensive data integration. - No-Code Interface: Utilize a wizard-driven, no-code environment that simplifies data importation and modeling, eliminating the need for complex coding or query languages. - Semantic Layer Creation: Develop a semantic understanding of your data to enhance accuracy, specificity, and explainability, thereby minimizing AI hallucinations. - Generative AI Agnostic: Apply the latest generative AI models to your business data without requiring machine learning expertise, fine-tuning, or additional training. - Enterprise AI Assistant: Interact with an AI assistant capable of answering business-related questions and generating analytical reports, streamlining information retrieval and reporting processes. Primary Value and Problem Solved: Gemini Enterprise addresses the challenge of integrating generative AI into existing business infrastructures by providing a straightforward, secure, and efficient platform. It empowers organizations to harness AI capabilities without the typical complexities associated with data integration and model training. By enabling rapid deployment and broad adoption, Gemini Enterprise enhances decision-making processes, improves operational efficiency, and delivers a higher return on AI investments.

Average Rating: 3.5/5.0

Total Reviews: 2

How Do G2 Users Rate Gemini Data?

  • Has the product been a good partner in doing business?: 10.0/10 (Category avg: 9.0/10)
  • Dashboards: 8.3/10 (Category avg: 9.0/10)
  • Steps to Answer: 8.3/10 (Category avg: 8.6/10)
  • Formats: 8.3/10 (Category avg: 8.6/10)

Who Is the Company Behind Gemini Data?

Who Uses This Product?

  • Company Size: 50% Medium, 50% Small

What Are Recent G2 Reviews of Gemini Data?

Grunt.pro

Grunt Pro is a PowerPoint add-in designed for everyone working with reports or business presentations in PowerPoint. Grunt can help you to improve on four important areas when using PowerPoint: → Work more efficiently → Enhance the quality of your slides → Enhance your workflow and reduce stress → Create impact with your presentations Create automated presentations and generate reports with a click: → Easy data visualization → Automatic alignment, sizing, and formatting → Dynamic templates that adjust to your needs → Strong Excel connection with PowerPoint It is developed for Consultants, Financial Analysts, Financial controllers, Project Managers, CFOs, Business Development Managers, Sales Managers, Investment Banking Analysts, Business Analysts, Investment Managers, Managing Directors, and anyone working with business presentations and PowerPoint.

Average Rating: 5.0/5.0

Total Reviews: 2

How Do G2 Users Rate Grunt.pro?

  • Dashboards: 10.0/10 (Category avg: 9.0/10)
  • Steps to Answer: 10.0/10 (Category avg: 8.6/10)
  • Formats: 10.0/10 (Category avg: 8.6/10)

Who Is the Company Behind Grunt.pro?

  • Seller: Grunt
  • Year Founded: 2015
  • HQ Location: Oslo, NO
  • LinkedIn® Page: www.linkedin.com
    37 employees on LinkedIn®

Who Uses This Product?

  • Company Size: 50% Large, 50% Medium

What Do G2 Reviewers Say About Grunt.pro?

AI-generated summary from verified user reviews

Pros
  • Users praise the ease of use of Grunt.pro, finding it simplifies and speeds up PowerPoint presentation creation.
  • Users find Grunt.pro's easy creation features invaluable for quickly crafting structured PowerPoint presentations.
  • Users appreciate the efficiency of Grunt.pro, noting substantial time savings in PowerPoint presentation creation.
  • Users find the presentation capabilities of Grunt.pro invaluable for saving time and enhancing efficiency in PowerPoint tasks.
  • Users find Grunt.pro's quick creation feature tremendously helpful for efficiently building PowerPoint presentations in less time.
Cons
  • Users find the file sharing limitations frustrating, as shared tables become uneditable images for those without the tool.
  • Users find the limited font options of Grunt.pro restrict its usability, particularly for those needing RTL and Arabic support.
  • Users find the limited formatting options in Grunt.pro restrict usability, especially for languages like Arabic.
  • Users note the limited options for language and formatting support, hindering usability for a broader audience.
  • Users note a limited vocabulary in Grunt.pro, which restricts usability for non-English speakers.

What Are Recent G2 Reviews of Grunt.pro?

IGXITE

IGXITE Intelligence Center automates the collection of information from all a business's data sources into customizable workspaces and alerts.

Average Rating: 4.8/5.0

Total Reviews: 2

How Do G2 Users Rate IGXITE?

  • Dashboards: 10.0/10 (Category avg: 9.0/10)
  • Steps to Answer: 10.0/10 (Category avg: 8.6/10)
  • Formats: 10.0/10 (Category avg: 8.6/10)

Who Is the Company Behind IGXITE?

  • Seller: IGXITE
  • Year Founded: 2006
  • HQ Location: Scottsdale, US
  • LinkedIn® Page: www.linkedin.com
    29 employees on LinkedIn®

Who Uses This Product?

  • Company Size: 100% Medium

What Are Recent G2 Reviews of IGXITE?

Industrytics

Make better business decisions, automate your data process and optimise your business with Decision Intelligence. With industrytics, you can connect, analyse and visualise all the metrics and data about your business and the feedback from your stakeholders in an intelligent 360° business dashboard and get data-driven and AI-powered improvement suggestions for your SME business. Always up to date. Find the right data in one place and unlock unrecognised potential with intelligent analysis.

Average Rating: 5.0/5.0

Total Reviews: 2

How Do G2 Users Rate Industrytics?

  • Dashboards: 10.0/10 (Category avg: 9.0/10)
  • Steps to Answer: 10.0/10 (Category avg: 8.6/10)
  • Formats: 10.0/10 (Category avg: 8.6/10)

Who Is the Company Behind Industrytics?

Who Uses This Product?

  • Company Size: 50% Small, 50% Medium

What Are Recent G2 Reviews of Industrytics?

Bijou Barry
BB
Researched and written by Bijou Barry
Updated June 24, 2026