Best Data Visualization Tools - Page 15

How Many Data Visualization Tools Products Does G2 Track?

Total Products under this Category: 478

Category Stats (Aug 2026)

  • Average Rating: 4.43/5 The average rating of products in this category, based on all submitted ratings
  • Top Trending Product: Supersimple (+0.89%) - Among all products in this category, Supersimple recorded the largest rating increase compared to last month

Last updated: August 04, 2026

How Does G2 Rank Data Visualization Tools Products?

Why You Can Trust G2's Software Rankings:

  • 30 Analysts and Data Experts
  • 26,100+ Authentic Reviews
  • 478+ Products
  • Unbiased Rankings

G2's software rankings are built on verified user reviews, rigorous moderation, and a consistent research methodology maintained by a team of analysts and data experts. Each product is measured using the same transparent criteria, with no paid placement or vendor influence. While reviews reflect real user experiences, which can be subjective, they offer valuable insight into how software performs in the hands of professionals. Together, these inputs power the G2 Score, a standardized way to compare tools within every category.

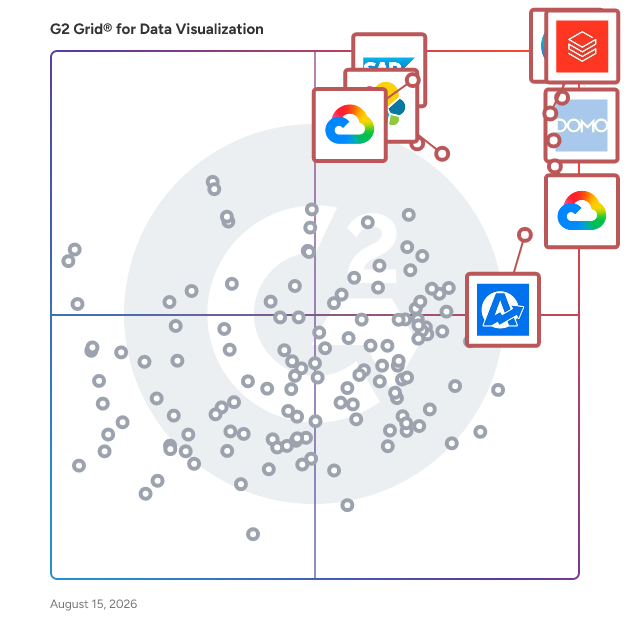
G2 Grid® for Data Visualization Tools

G2 Grid® for Data Visualization Tools plotting products by satisfaction and market presence

Highlighted products: Canva, Databricks, Domo, Looker, Data Studio, Elastic Stack, SAP HANA Cloud, and AgencyAnalytics.

Underlying data: [Grid® JSON](https://www.g2.com/categories/data-visualization-tools/grids.json?focus%5B%5D=canva&focus%5B%5D=databricks&focus%5B%5D=domo&focus%5B%5D=looker&focus%5B%5D=data-studio&focus%5B%5D=elastic-stack&focus%5B%5D=sap-hana-cloud-2025-10-01&focus%5B%5D=agencyanalytics)

Sponsored

Mitratech AssureHire

Compliant, Efficient Background Screening with a Focus on Candidate Experience Accredited by the PBSA (Professional Background Screening Association) and as a SOC2 certified provider, we deliver background screening solutions that prioritize accuracy, speed, and a positive candidate journey. Accelerate Your Hiring with Confidence: 1. Rapid, Reliable Results: Don't let slow background checks create hiring bottlenecks. Mitratech’s completes 98% of background checks in less than 24 hours. This allows you to make informed decisions quickly and secure top talent faster. 2. Embedded Compliance & Reduced Risk: Our technology simplifies critical compliance steps, including consent management and adverse action workflows, helping you maintain best practices, reduce human error, and ensure your screening process is consistently fair and legally sound. 3. Optimized Candidate Experience: Mitratech offers an intuitive, fully remote, mobile-first interface. This streamlines the process for applicants, improves completion rates, and reflects positively on your employer brand. Comprehensive Screening, Dedicated Support: Mitratech offers a wide array of screening services including criminal history, employment and education verification, drug testing, and more helping us serve diverse industry needs. Beyond technology, every client receives world-class support, providing expert guidance and unlimited support via phone, text, or email. We are committed to being a true partner in building your safe and productive workplace. Explore Mitratech for a smarter, faster, and more candidate-friendly approach to background screening.

Visit website

OfficeReports

OfficeReports Presento est un outil puissant conçu pour rationaliser le processus de transformation des tableaux croisés de recherche de marché d'Excel en présentations PowerPoint professionnelles. En automatisant l'extraction, le formatage et la liaison des données, Presento élimine le besoin de copier-coller manuellement, garantissant des rapports sans erreur et prêts à être présentés à chaque fois. Cette intégration permet aux chercheurs de marché de se concentrer davantage sur l'analyse des insights plutôt que de passer d'innombrables heures à préparer des rapports. Caractéristiques clés et fonctionnalités : - Liaison de données automatisée : Connecte directement les tableaux croisés Excel aux tableaux et graphiques PowerPoint, permettant des mises à jour de données fluides. - Extraction intelligente de données : Identifie et met à jour les valeurs correctes même lorsque les rapports Excel changent entre les vagues d'enquête, maintenant l'exactitude des rapports. - Visualisations personnalisables : Offre des types de graphiques avancés comme les graphiques de quadrant et les graphiques à barres divergentes, ainsi que des infographies personnalisables telles que des curseurs et des graphiques de jauge. - Mise en forme conditionnelle : Met en évidence les insights clés à l'aide d'indicateurs visuels comme des flèches haut/bas et des icônes personnalisées pour souligner les points de données significatifs. - Automatisation des rapports : Facilite la création de rapports récurrents et d'études de suivi en automatisant le processus de reporting, économisant du temps et réduisant les erreurs. Valeur principale et solutions pour les utilisateurs : Presento répond aux défis courants rencontrés par les chercheurs de marché, tels que la tâche chronophage et sujette aux erreurs de transfert manuel de données d'Excel à PowerPoint. En automatisant ce processus, Presento accélère non seulement la génération de rapports mais améliore également l'exactitude et la cohérence. Les utilisateurs peuvent commencer à construire des rapports tôt, même avec des données préliminaires, et les mettre à jour facilement à mesure que de nouvelles données deviennent disponibles. Cette efficacité permet aux chercheurs de livrer des insights plus rapidement, de se concentrer sur l'analyse des données et de produire des présentations professionnelles de haute qualité avec un minimum d'effort.

Average Rating: 4.0/5.0

Total Reviews: 11

Who Is the Company Behind OfficeReports?

  • Vendeur: OfficeReports
  • Année de fondation: 2009
  • Emplacement du siège social: Copenhagen, Denmark
  • Twitter: @OfficeReports
    241 abonnés Twitter
  • Page LinkedIn®: www.linkedin.com
    3 employés sur LinkedIn®

Who Uses This Product?

  • Company Size: 55% Small, 36% Medium

What Do G2 Reviewers Say About OfficeReports?

AI-generated summary from verified user reviews

Pros
  • Les utilisateurs apprécient la facilité d'utilisation d'OfficeReports, offrant un accès structuré et organisé à des informations cruciales sans effort.
  • Les utilisateurs apprécient l'intégration transparente avec MS Excel et PowerPoint, améliorant leurs capacités de reporting et d'analyse.
  • Les utilisateurs apprécient l'efficacité des rapports d'OfficeReports, permettant des mises à jour rationalisées et un accès simplifié aux données pour les réunions.
  • Les utilisateurs adorent la visualisation de données efficace dans OfficeReports, rendant les informations complexes faciles à digérer et à référencer.
  • Les utilisateurs apprécient les capacités d'automatisation d'OfficeReports, permettant une génération de rapports efficace avec une intégration transparente d'Excel et PowerPoint.
Cons
  • Les utilisateurs rencontrent des problèmes d'intégration frustrants avec OfficeReports, ce qui entrave l'intégration fluide des données et les analyses avancées.
  • Les utilisateurs font face à une dépendance à Microsoft Office, ce qui peut limiter ceux qui utilisent des options logicielles alternatives.
  • Les utilisateurs rencontrent des options de personnalisation limitées dans OfficeReports, ce qui entrave leur capacité à effectuer des analyses de données avancées efficacement.
  • Les utilisateurs expriment leur frustration face à la flexibilité limitée d'OfficeReports, ce qui entrave les besoins de personnalisation avancée et d'intégration de données.
  • Les utilisateurs sont souvent confrontés à un mauvais service client, ce qui affecte négativement leur expérience globale avec OfficeReports.

What Are Recent G2 Reviews of OfficeReports?

What Are G2 Users Discussing About OfficeReports?

Omniscope Evo

Visokio builds Omniscope Evo, complete and extensible BI software for data processing, analytics and reporting. A smart experience on any device. Start from any data in any shape, load, blend, transform and explore it, extract insights through ML algorithms, then produce interactive reports and dashboards to share your findings. Omniscope is not only an all-in-one self-service BI tool with a responsive UX on all modern devices, but also a powerful and extensible platform: you can augment data workflows with Python / R scripts and enhance reports with any JS visualisation. Whether you’re a data manager, scientist or analyst, Omniscope is your complete solution: from data, through analytics to visualisation. 🧽 Data Prep, ETL: build workflows to load, stream, blend and transform any data. 🔍 Analytics: leverage machine learning, extract insights and perform visual exploration. 📊 Visualisation: design interactive reports, publish and share your results. 📜 Extensible: augment data pipelines with your Python / R scripts, enhance reports with any JS based visualisation. 🚀 Scalable: big data preparation and live query dashboards on SQL databases. 🤝 Collaboration: multi-user synchronised edits on workflows and dashboards. 🤖 Automation API: schedule parameterised data refresh & report updates, trigger tasks, alerts, edit & query data. 💐 Universal: a fresh and smart experience on any device: Windows, Mac, Linux, Android, iOS. 🏢 Deployment: on-premises or on your cloud. Built-in user permissions / OIDC / SSO 🎨 White-label: host branded data solutions and embedded analytics

Average Rating: 4.7/5.0

Total Reviews: 21

How Do G2 Users Rate Omniscope Evo?

  • Has the product been a good partner in doing business?: 9.5/10 (Category avg: 9.0/10)

Who Is the Company Behind Omniscope Evo?

  • Seller: Visokio
  • Year Founded: 2002
  • HQ Location: London, GB
  • Twitter: @Visokio
    255 Twitter followers
  • LinkedIn® Page: www.linkedin.com
    8 employees on LinkedIn®

Who Uses This Product?

  • Top Industries: Information Technology and Services
  • Company Size: 65% Small, 17% Large

What Are Recent G2 Reviews of Omniscope Evo?

What Are G2 Users Discussing About Omniscope Evo?

Rally KPI

Real time curation of your companys operations. It lets you define targets for your company, teams or individuals and periodically showcases their performance, giving you a panoramic view of your company and everything in it.

Average Rating: 4.2/5.0

Total Reviews: 3

How Do G2 Users Rate Rally KPI?

  • Has the product been a good partner in doing business?: 8.3/10 (Category avg: 9.0/10)
  • Dashboards: 9.2/10 (Category avg: 9.0/10)
  • Steps to Answer: 9.2/10 (Category avg: 8.6/10)
  • Formats: 9.2/10 (Category avg: 8.6/10)

Who Is the Company Behind Rally KPI?

Who Uses This Product?

  • Company Size: 67% Medium, 33% Large

What Are Recent G2 Reviews of Rally KPI?

RC-Dashboard and Database Tool

RC-Dashboard and Database Tool combines powerful and flexible analytics with high-quality visualisation of the results obtained. Data on accounts, portfolios and financial ratios are loaded and manipulated using a flexible set of routines and algorithms and then presented through a dashboard. The software supports analysis by risk or finance teams within financial institutions and their presentation to a wider audience or managers and analysts.

Average Rating: 4.2/5.0

Total Reviews: 3

How Do G2 Users Rate RC-Dashboard and Database Tool?

  • Has the product been a good partner in doing business?: 8.3/10 (Category avg: 9.0/10)
  • Dashboards: 9.2/10 (Category avg: 9.0/10)
  • Steps to Answer: 9.2/10 (Category avg: 8.6/10)
  • Formats: 9.2/10 (Category avg: 8.6/10)

Who Is the Company Behind RC-Dashboard and Database Tool?

  • Seller: Risk Control Limited
  • Year Founded: 2001
  • HQ Location: London, GB
  • Twitter: @RiskControlLtd
    273 Twitter followers
  • LinkedIn® Page: www.linkedin.com
    21 employees on LinkedIn®
  • Phone: +44 (0)20 3307 0730

Who Uses This Product?

  • Company Size: 33% Large, 33% Medium

What Are Recent G2 Reviews of RC-Dashboard and Database Tool?

Selfr

Selfr is a plug-and-play AI-powered platform that helps data analysts and business people build automated pipelines that turn data from multiple sources into live BI dashboards. It eliminates the need to hire expensive data engineers to build and maintain a data stack, and automates a lot of tedious manual tasks.

Average Rating: 4.5/5.0

Total Reviews: 3

How Do G2 Users Rate Selfr?

  • Has the product been a good partner in doing business?: 10.0/10 (Category avg: 9.0/10)
  • Dashboards: 10.0/10 (Category avg: 9.0/10)
  • Steps to Answer: 8.3/10 (Category avg: 8.6/10)
  • Formats: 9.2/10 (Category avg: 8.6/10)

Who Is the Company Behind Selfr?

  • Seller: Selfr
  • Year Founded: 2021
  • HQ Location: New York, US
  • LinkedIn® Page: www.linkedin.com
    8 employees on LinkedIn®

Who Uses This Product?

  • Company Size: 67% Medium, 33% Small

What Are Recent G2 Reviews of Selfr?

Shrood BI

Shrood est une entreprise de solutions d'intelligence d'affaires spécialisée dans l'analyse du commerce de détail omnicanal, de la vente en gros, de la chaîne d'approvisionnement, de l'immobilier et de la gestion immobilière.

Average Rating: 4.5/5.0

Total Reviews: 3

How Do G2 Users Rate Shrood BI?

  • Tableaux: 9.4/10 (Category avg: 9.0/10)
  • Étapes pour répondre: 9.4/10 (Category avg: 8.6/10)
  • Formats: 8.9/10 (Category avg: 8.6/10)

Who Is the Company Behind Shrood BI?

  • Vendeur: Shrood BI
  • Année de fondation: 2017
  • Emplacement du siège social: San Francisco, US
  • Page LinkedIn®: www.linkedin.com
    4 employés sur LinkedIn®

Who Uses This Product?

  • Company Size: 67% Medium, 33% Large

What Are Recent G2 Reviews of Shrood BI?

SlideSense

Automatisez les graphiques interactifs PowerPoint pour raconter des histoires d'affaires en salle de réunion. Dynamisez vos PPTs avec le plugin SlideSense et automatisez la visualisation des données dans votre système.

Average Rating: 4.5/5.0

Total Reviews: 3

How Do G2 Users Rate SlideSense?

  • the product a-t-il été un bon partenaire commercial?: 8.3/10 (Category avg: 9.0/10)
  • Tableaux: 9.2/10 (Category avg: 9.0/10)
  • Étapes pour répondre: 9.2/10 (Category avg: 8.6/10)
  • Formats: 9.2/10 (Category avg: 8.6/10)

Who Is the Company Behind SlideSense?

  • Vendeur: Straive
  • Année de fondation: 1980
  • Emplacement du siège social: Singapore, Singapore
  • Page LinkedIn®: www.linkedin.com
    12,349 employés sur LinkedIn®

Who Uses This Product?

  • Company Size: 67% Small, 33% Large

What Are Recent G2 Reviews of SlideSense?

Spontivly

Spontivly is a data analytics platform that transforms marketing data chaos into clear, actionable insights, enabling teams to make data-driven decisions, optimize campaigns, and demonstrate ROI.

Average Rating: 5.0/5.0

Total Reviews: 3

How Do G2 Users Rate Spontivly?

  • Has the product been a good partner in doing business?: 10.0/10 (Category avg: 9.0/10)
  • Dashboards: 10.0/10 (Category avg: 9.0/10)
  • Steps to Answer: 10.0/10 (Category avg: 8.6/10)
  • Formats: 10.0/10 (Category avg: 8.6/10)

Who Is the Company Behind Spontivly?

  • Seller: Spontivly
  • Year Founded: 2018
  • HQ Location: Saint Petersburg, US
  • Twitter: @spontivlydata
    32 Twitter followers
  • LinkedIn® Page: www.linkedin.com
    19 employees on LinkedIn®

Who Uses This Product?

  • Company Size: 100% Small

What Are Recent G2 Reviews of Spontivly?

Sprucely.io

Sprucely.io provides visual data analytics as a service. It is an AI dashboard software that automates your data insights pipeline. It takes data from a multitude of sources and creates interactive decision intelligence to share or integrate with your services. In seconds. Sprucely.io's AI assistants help you automatically generate spot-on dashboard layouts and complex chart setups according to your input with an assisted flow that help ensure you always get the data you want, presented the way you want. Sprucely.io even excels in automatically generating dashboards with more advanced features, such as breaking down data by time seasonality.

Average Rating: 4.8/5.0

Total Reviews: 3

How Do G2 Users Rate Sprucely.io?

  • Has the product been a good partner in doing business?: 10.0/10 (Category avg: 9.0/10)

Who Is the Company Behind Sprucely.io?

Who Uses This Product?

  • Company Size: 50% Medium, 50% Small

What Do G2 Reviewers Say About Sprucely.io?

AI-generated summary from verified user reviews

Pros
  • Users value the ease of use of Sprucely.io, finding it simple to automate tasks and access data effortlessly.
  • Users value the data visualization and insights from Sprucely.io, enhancing business impact through easy access and security.
  • Users appreciate the easy integrations of Sprucely.io, allowing seamless configuration and implementation of various file types.
  • Users appreciate the implementation ease of Sprucely.io, highlighting smooth configuration and seamless software integration.
  • Users value the visual representation of large data sets, which provides deeper insights impacting business effectively.
Cons
  • Users are frustrated by the slow performance of Sprucely.io, particularly when handling multiple files efficiently.

What Are Recent G2 Reviews of Sprucely.io?

Stagraph

Vous pouvez publier des données prétraitées et des visualisations de données créées sous des formes variables - vectorielles ou matricielles, statiques, interactives ou animées, hors ligne ou en ligne.

Average Rating: 4.2/5.0

Total Reviews: 3

How Do G2 Users Rate Stagraph?

  • the product a-t-il été un bon partenaire commercial?: 8.3/10 (Category avg: 9.0/10)
  • Tableaux: 8.3/10 (Category avg: 9.0/10)
  • Étapes pour répondre: 8.3/10 (Category avg: 8.6/10)
  • Formats: 9.2/10 (Category avg: 8.6/10)

Who Is the Company Behind Stagraph?

Who Uses This Product?

  • Company Size: 67% Medium, 33% Large

What Are Recent G2 Reviews of Stagraph?

Stimulsoft BI

Stimulsoft BI is a complete Business Intelligence, client-server solution that provides reporting and analytics. The front end provides facility to visualize data. The back end provides data processing and storing.

Average Rating: 4.5/5.0

Total Reviews: 3

How Do G2 Users Rate Stimulsoft BI?

  • Has the product been a good partner in doing business?: 10.0/10 (Category avg: 9.0/10)
  • Dashboards: 10.0/10 (Category avg: 9.0/10)
  • Steps to Answer: 10.0/10 (Category avg: 8.6/10)
  • Formats: 10.0/10 (Category avg: 8.6/10)

Who Is the Company Behind Stimulsoft BI?

  • Seller: Stimulsoft
  • Year Founded: 2002
  • HQ Location: Tallinn, EE
  • Twitter: @Stimulsoft
    275 Twitter followers
  • LinkedIn® Page: www.linkedin.com
    20 employees on LinkedIn®

Who Uses This Product?

  • Company Size: 67% Small, 33% Medium

What Do G2 Reviewers Say About Stimulsoft BI?

AI-generated summary from verified user reviews

Pros
  • Users commend the great customer support of Stimulsoft BI, appreciating their helpfulness with issues and licensing.
  • Users value the easy creation of reports in Stimulsoft BI, finding it simple to integrate into applications.
  • Users value the easy integrations of Stimulsoft BI, facilitating seamless use within their applications daily.
  • Users find implementation easy, appreciating smooth integration and helpful customer support during the process.
  • Users value the cost-effective functionality of Stimulsoft BI, noting its ease of integration and excellent support.

What Are Recent G2 Reviews of Stimulsoft BI?

What Are G2 Users Discussing About Stimulsoft BI?

Structr

Structr est la plateforme d'application graphique la plus avancée au monde.

Average Rating: 4.5/5.0

Total Reviews: 3

How Do G2 Users Rate Structr?

  • the product a-t-il été un bon partenaire commercial?: 6.7/10 (Category avg: 9.0/10)
  • Tableaux: 8.9/10 (Category avg: 9.0/10)
  • Étapes pour répondre: 8.3/10 (Category avg: 8.6/10)
  • Formats: 8.9/10 (Category avg: 8.6/10)

Who Is the Company Behind Structr?

  • Vendeur: Structr
  • Année de fondation: 2011
  • Emplacement du siège social: Frankfurt am Main, DE
  • Twitter: @structr
    1,436 abonnés Twitter
  • Page LinkedIn®: www.linkedin.com
    9 employés sur LinkedIn®

Who Uses This Product?

  • Company Size: 67% Small, 33% Medium

What Are Recent G2 Reviews of Structr?

Suntek Reporting

Turn complex data into visual insights anyone can understand with Suntek Reporting. Eliminate the countless hours spent staring at spreadsheets. Let us decode complex data so the focus can be placed on what’s important - growing the business! Our user-friendly interface scores and tracks business performance. This allows users to know exactly where their business stands in real-time. We break down data sets into simple KPI scores which provide actionable insights that allow for an improved bottom line. With Suntek Reporting’s predictive analytics users can make informed decisions that will lead to: *Increased Revenue *Better Customer Service *Improved Employee Efficiency *Greater Market Share Use Suntek Reporting to eliminate the pain involved in complex reporting, and feel the confidence that comes from improving performance and profitability.

Average Rating: 5.0/5.0

Total Reviews: 3

How Do G2 Users Rate Suntek Reporting?

  • Has the product been a good partner in doing business?: 10.0/10 (Category avg: 9.0/10)
  • Dashboards: 10.0/10 (Category avg: 9.0/10)
  • Steps to Answer: 6.7/10 (Category avg: 8.6/10)
  • Formats: 6.7/10 (Category avg: 8.6/10)

Who Is the Company Behind Suntek Reporting?

Who Uses This Product?

  • Company Size: 100% Small

What Are Recent G2 Reviews of Suntek Reporting?

Talligence

Unlock the full potential of your Tally® data with Talligence, an AI and ML-driven business intelligence tool. It offers intuitive dashboards, key performance indicators, and a smart virtual assistant to transform complex data into actionable insights. Key Features: • Insightful Dashboards: Navigate through pre-defined dashboards for sales, purchases, and more, tailored to your business needs. • KPI Tracking: Set targets on industry-standard KPIs and receive alerts when they’re met. • AI Virtual Assistant: Ask questions like “What’s my sales this week?” and get instant, insightful responses. • User Management: Control permissions and secure access with a native mobile app. • Secure Data Transfer: Sync your data securely to the cloud via Tally® ODBC connections. Why Talligence? • Simplicity: Easy to use and implement. • Affordability: Eliminates total cost of ownership. • Efficiency: Provides daily financial oversight and detailed analysis. Experience the simplicity and power of Talligence. Start your free trial and take the first step towards smarter business intelligence.

Average Rating: 4.7/5.0

Total Reviews: 3

How Do G2 Users Rate Talligence?

  • Dashboards: 9.4/10 (Category avg: 9.0/10)
  • Steps to Answer: 9.4/10 (Category avg: 8.6/10)
  • Formats: 8.9/10 (Category avg: 8.6/10)

Who Is the Company Behind Talligence?

Who Uses This Product?

  • Company Size: 67% Small, 33% Medium

What Are Recent G2 Reviews of Talligence?

TallyGraphs

Tableaux de bord d'affaires pour Tally

Average Rating: 4.5/5.0

Total Reviews: 3

How Do G2 Users Rate TallyGraphs?

  • Tableaux: 10.0/10 (Category avg: 9.0/10)
  • Étapes pour répondre: 10.0/10 (Category avg: 8.6/10)
  • Formats: 10.0/10 (Category avg: 8.6/10)

Who Is the Company Behind TallyGraphs?

  • Vendeur: DataPlanet
  • Année de fondation: 2017
  • Emplacement du siège social: Chennai, IN
  • Page LinkedIn®: www.linkedin.com
    2 employés sur LinkedIn®

Who Uses This Product?

  • Company Size: 100% Medium

What Are Recent G2 Reviews of TallyGraphs?

Bijou Barry
BB
Researched and written by Bijou Barry
Updated June 24, 2026