Best Data Visualization Tools - Page 37

How Many Data Visualization Tools Products Does G2 Track?

Total Products under this Category: 762

Category Stats (Nov 2026)

  • Average Rating: 4.44/5 The average rating of products in this category, based on all submitted ratings
  • Top Trending Product: Upsolve AI (+1.75%) - Among all products in this category, Upsolve AI recorded the largest rating increase compared to last month

Last updated: November 01, 2026

How Does G2 Rank Data Visualization Tools Products?

Why You Can Trust G2's Software Rankings:

  • 30 Analysts and Data Experts
  • 22,900+ Authentic Reviews
  • 762+ Products
  • Unbiased Rankings

G2's software rankings are built on verified user reviews, rigorous moderation, and a consistent research methodology maintained by a team of analysts and data experts. Each product is measured using the same transparent criteria, with no paid placement or vendor influence. While reviews reflect real user experiences, which can be subjective, they offer valuable insight into how software performs in the hands of professionals. Together, these inputs power the G2 Score, a standardized way to compare tools within every category.

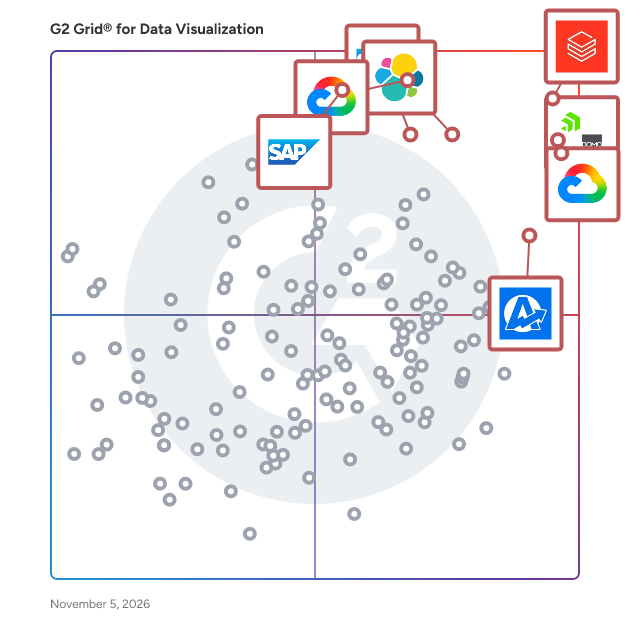
G2 Grid® for Data Visualization Tools

G2 Grid® for Data Visualization Tools plotting products by satisfaction and market presence

Highlighted products: Databricks, Domo, Looker, Data Studio, Elastic Stack, AgencyAnalytics, SAP HANA Cloud, and SAP Analytics Cloud.

Underlying data: [Grid® JSON](https://www.g2.com/categories/data-visualization-tools/grids.json?focus%5B%5D=databricks&focus%5B%5D=domo&focus%5B%5D=looker&focus%5B%5D=data-studio&focus%5B%5D=elastic-stack&focus%5B%5D=agencyanalytics&focus%5B%5D=sap-hana-cloud-2025-10-01&focus%5B%5D=sap-analytics-cloud&segment=all)

Jawg Maps

Create a map that integrates seamlessly into your website with our APIs. The Jawg platform provides enterprise-grade mapping services built from both OpenSource and proprietary tools, as well as OpenStreetMap data. Far from simply being a map customizing tool, Jawg provides you with statistics that enable you to adapt your product according to the needs of your users. Take control of your maps: https://www.jawg.io/

Who Is the Company Behind Jawg Maps?

  • Seller: Jawg
  • Year Founded: 2015
  • HQ Location: Bagneux, FR
  • LinkedIn® Page: www.linkedin.com
    6 employees on LinkedIn®

JetPack Data

JetPack Data is a platform which transforms instantly and automatically any data file into analysis.

Average Rating: 4.5/5.0

Total Reviews: 4

How Do G2 Users Rate JetPack Data?

  • Has the product been a good partner in doing business?: 10.0/10 (Category avg: 9.0/10)

Who Is the Company Behind JetPack Data?

Who Uses This Product?

  • Company Size: 75% Small, 25% Large

What Are Recent G2 Reviews of JetPack Data?

What Are G2 Users Discussing About JetPack Data?

Junu.io

Junu.io is a Business Analytics Platform tailored to Professional Service Organizations. With Junu.io you get instant access to operational and financial reports, where you benefit from best-in-class analytics. We integrate with +20 of your already existing business tools.

Average Rating: 5.0/5.0

Total Reviews: 1

Who Is the Company Behind Junu.io?

  • Seller: Junu.io
  • Year Founded: 2019
  • HQ Location: Copenhagen, DK
  • LinkedIn® Page: www.linkedin.com
    12 employees on LinkedIn®

Who Uses This Product?

  • Company Size: 100% Large

What Are Recent G2 Reviews of Junu.io?

AI can help you find the answers. G2 helps you trust them.

Connect G2 to Claude or ChatGPT for answers grounded in G2's trusted reviews, comparisons, and pricing from real user insights.

How it works

Keen

Who Is the Company Behind Keen?

Keen.io

Keen.io is the complete event data management solution. Our platform can handle all aspects of your event data management, from collection to application. Stream, store, query, and present your data all in one place and get a competitive advantage over the competition. Keen allows you to get a true view of your product usage and interaction through event-based data. We make it easy to dive into the product data you need, allowing you to identify and solve product issues, enhance user experiences, and ship product rollouts faster.

Average Rating: 4.4/5.0

Total Reviews: 12

How Do G2 Users Rate Keen.io?

  • Has the product been a good partner in doing business?: 9.3/10 (Category avg: 9.0/10)

Who Is the Company Behind Keen.io?

  • Seller: Keen IO
  • Year Founded: 2011
  • HQ Location: San Antonio, Texas
  • LinkedIn® Page: www.linkedin.com
    18 employees on LinkedIn®

Who Uses This Product?

  • Top Industries: Computer Software
  • Company Size: 75% Small, 25% Medium

What Are Recent G2 Reviews of Keen.io?

What Are G2 Users Discussing About Keen.io?

Klar

Klar is business intelligence for teams that do not have a data team. Connect a live database, upload a spreadsheet, or link Stripe, Shopify or GA4. Klar reads your schema, profiles the columns, and builds a working dashboard - KPIs, charts and insights - from a structure it has never seen before. The difference is what the numbers are computed from. For a live database connection Klar queries your data in place, read-only, and aggregates across every row. It does not copy your database, and it does not sample. Where other tools quietly estimate from a subset, Klar computes exact totals. It also refuses rather than guesses. When a question cannot be answered properly - when the data sits across two systems that cannot be joined - Klar blocks the chart and says so, instead of returning a confident number that is wrong. AI is included rather than metered separately: ask a question in plain English, get dashboards generated automatically, and get insights grounded in the dataset rather than invented explanations. Klar will not tell you why a number moved, because it cannot know that. Built for operators at growing companies and for multi-entity groups whose numbers live in several systems at once.

Who Is the Company Behind Klar?

Kravklar

Kravklar is a NIS2 compliance self-assessment tool for Norwegian SMBs. It evaluates organizational maturity across all 10 security categories in NIS2 Article 21, generates a radar chart visualization, and provides a prioritized gap analysis with board-ready PDF reports. Free tier includes the full 56-question assessment with scores. Paid tier adds detailed gap analysis, action plans, and exportable reports.

Who Is the Company Behind Kravklar?

Kyubit Business Intelligence

Kyubit Business Intelligence is a self-hosted BI and analytics platform for organizations that want secure, flexible reporting without relying on cloud-only infrastructure or per-user licensing. Kyubit connects directly to existing Microsoft SSAS / OLAP multidimensional and Tabular models, while also allowing organizations to turn SQL databases, Excel, and CSV data into analytics-ready semantic models using a visual, no-code modeling environment. Business users and analysts can quickly explore data with drag-and-drop grid analysis, drill-downs, slicers, calculated measures, time intelligence, ad hoc reporting, interactive dashboards, KPIs, and scheduled report delivery. Kyubit is designed for organizations that want to keep their analytics and business data within their own infrastructure while still providing modern self-service analytics across teams. Key capabilities include: • Self-hosted and on-premise BI deployment • Deep support for Microsoft SSAS / OLAP and Tabular models • Visual semantic modeling for SQL databases, Excel, and CSV data • Advanced grid analysis and ad hoc reporting • Interactive dashboards, charts, KPIs, and scorecards • Time intelligence and period comparison • Scheduled reports and email subscriptions • Embedded analytics using HTML and JavaScript • Role-based security and centralized governance • Multitenant deployment for serving multiple organizations • White-label options for enterprise deployments • Perpetual and annual subscription licensing Kyubit is particularly well suited to organizations already using Microsoft Analysis Services or relational databases that want to extend their existing data infrastructure with a lightweight, web-based analytics layer. Unlike many cloud BI platforms, Kyubit can be deployed entirely within the customer's own environment and uses server/edition-based licensing rather than requiring a separate cloud subscription for every report consumer. The result is a practical BI platform for self-service analytics, operational reporting, dashboarding, embedded BI, and governed enterprise analytics — while maintaining control over data, infrastructure, and licensing.

Average Rating: 4.4/5.0

Total Reviews: 12

How Do G2 Users Rate Kyubit Business Intelligence?

  • Has the product been a good partner in doing business?: 9.4/10 (Category avg: 9.0/10)

Who Is the Company Behind Kyubit Business Intelligence?

Who Uses This Product?

  • Company Size: 42% Medium, 42% Small

What Are Recent G2 Reviews of Kyubit Business Intelligence?

Lattice Grid

Lattice Grid is a JavaScript data grid built for applications that work with real data volumes and real users. The grid itself does what a serious grid has to: virtualised rows and columns into the millions, frozen columns and pinned rows, column groups and bands, sorting, multi-column filtering with a filter row and per-column menus, grouping with aggregates, pivoting, tree data, merged cells, row numbers, find-in-grid, autosize, saved views and column state that round-trips, keyboard navigation throughout, right-to-left and localised UI, light and dark themes, and WCAG 2.2 AA. Editing covers inline cells with validation and optimistic write-back that reverts on refusal, a built-in row form for adding and editing records, fill handle, clipboard, undo, row-scoped formulas, threaded cell comments, and manual row ordering that survives a sort, including dragging a row into another group. An audit mode compares the grid against a snapshot and marks every added, removed and changed row with the prior value. Export to CSV and Excel, import with preview. Underneath is a data engine rather than an array. Point the grid at a Parquet file on object storage, a ClickHouse or DuckDB table, a MotherDuck database, an Elasticsearch index or a Splunk search, and filters, sorting, paging, grouping and aggregates are pushed to the source. The browser holds only the visible blocks, and the grid reports what it could not push rather than doing it quietly. A local DuckDB engine handles files dropped onto the page with nothing uploaded. The Data Router connects one live feed to many viewers without coupling them. A stream of keyed updates, whether a WebSocket, a polled endpoint or a query result, is applied once and fanned out to every subscriber by predicate, so a grid, a KPI strip, a chart and a map each see their own slice and stay in step at thousands of updates a second. Viewers can be related to each other, so a selection in one narrows the others; routes can be persisted and restored; and the same feed reaches other browser tabs. It is what lets a screen with six panels be six subscribers to one dataset instead of six copies of it. Every other view is a viewer of that dataset: eighteen chart types, KPI tiles, a statistics panel, a timeline, Kanban, Gantt, and map layers on deck.gl or Leaflet, all following the grid's filter and selection. A dashboard is a JSON spec, not a page of wiring. An optional AI layer answers questions over the data and proposes edits through a governed, vetoable path. Zero runtime dependencies, TypeScript types throughout, and adapters for React, Vue, Svelte, Angular, Web Components and htmx. Licensing is a one-time fee per domain with a year of support. No per-developer seats, no phone-home.

Who Is the Company Behind Lattice Grid?

LeanSuite KPI Dashboards

Live KPI dashboards for the shop floor: output, downtime and losses against targets, from each line up to company roll-ups.

Who Is the Company Behind LeanSuite KPI Dashboards?

  • Seller: LeanSuite
  • Year Founded: 2021
  • HQ Location: Ontario, Canada
  • LinkedIn® Page: www.linkedin.com
    9 employees on LinkedIn®

Leapfrog Works

Visualise and communicate ground conditions with fast, dynamic 3D geological modelling for civil & environmental projects.

Who Is the Company Behind Leapfrog Works?

  • Seller: Seequent
  • Year Founded: 2003
  • HQ Location: Christchurch, NZ
  • LinkedIn® Page: www.linkedin.com
    794 employees on LinkedIn®

Leonardo

Leonardo is a visualization, web spreadsheet, and dashboarding analysis tool developed by PARIS Technologies. Leonardo is the ideal complement to a centralized data management system such as Olation, allowing users to gain valuable insights from their data. With a user-friendly interface, it enables individuals and teams to create stunning visualizations and interactive dashboards that facilitate data exploration and storytelling. The tool seamlessly connects to the centralized data management system, pulling data from various sources and automatically updating visualizations in real-time. effectively communicates trends, patterns, and relationships within the data. Users can easily filter and drill-down into the data, providing deeper analysis and uncovering hidden insights. Collaboration features allow for sharing and collaboration of visualizations, enabling stakeholders to access and interact with updated data visualizations anytime, anywhere. This visualization tool is ideal for data analysts, business analysts, and decision-makers who rely on data-driven insights to guide their strategic decisions. It empowers users to understand complex data through intuitive visual representations and facilitates data-driven storytelling for persuasive presentations and reports. With seamless integration with the centralized data management system, this visualization tool enhances the value of the data, enabling users to extract actionable insights and drive informed decision-making.

Who Is the Company Behind Leonardo?

Lighthouse by WorkWave

Lighthouse is a mobile workforce management platform for cleaning and security contractors. Lighthouse provides complete visibility of distributed teams and helps you monitor cleaning task completion, and scheduled work or guard touring and patrols, visitor management and other physical security operations as they happen. Lighthouse adds time- and money-saving capabilities to view, manage and automate operations in the field, allowing you to improve service delivery, gain operational efficiency and reduce risk. Lighthouse has easy-to-use features that allow you to know where your workers and assets are at all times, capture evidence of services performed and handle the unexpected. • Real-time GPS location tracking and live maps • Mobile forms and activity reports • Messages and alerts • Duress and notifications • Scheduled work and exception reports • Analytics dashboard and reports • Mobile time and attendance

Average Rating: 4.4/5.0

Total Reviews: 9

How Do G2 Users Rate Lighthouse by WorkWave?

  • Has the product been a good partner in doing business?: 8.7/10 (Category avg: 9.0/10)

Who Is the Company Behind Lighthouse by WorkWave?

  • Seller: WorkWave
  • Year Founded: 1984
  • HQ Location: Holmdel, NJ
  • LinkedIn® Page: www.linkedin.com
    474 employees on LinkedIn®

Who Uses This Product?

  • Company Size: 82% Medium, 9% Large

What Are Recent G2 Reviews of Lighthouse by WorkWave?

Bijou Barry
BB
Researched and written by Bijou Barry
Updated June 24, 2026