Best Statistical Analysis Software - Page 13

Last updated: March 3, 2025

How Many Statistical Analysis Software Products Does G2 Track?

Total Products under this Category: 189

Category Stats (Nov 2026)

  • Average Rating: 4.25/5 (↑0.01 vs Oct 2026) The average rating of products in this category, based on all submitted ratings
  • Top Trending Product: Toluna Start (+0.26%) - Among all products in this category, Toluna Start recorded the largest rating increase compared to last month

Last updated: November 18, 2026

How Does G2 Rank Statistical Analysis Software Products?

Why You Can Trust G2's Software Rankings:

  • 30 Analysts and Data Experts
  • 17,400+ Authentic Reviews
  • 189+ Products
  • Unbiased Rankings

G2's software rankings are built on verified user reviews, rigorous moderation, and a consistent research methodology maintained by a team of analysts and data experts. Each product is measured using the same transparent criteria, with no paid placement or vendor influence. While reviews reflect real user experiences, which can be subjective, they offer valuable insight into how software performs in the hands of professionals. Together, these inputs power the G2 Score, a standardized way to compare tools within every category.

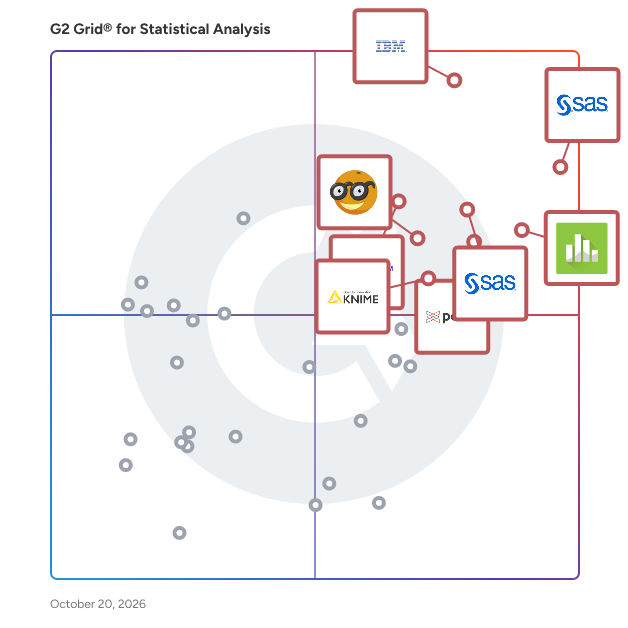
G2 Grid® for Statistical Analysis Software

G2 Grid® for Statistical Analysis Software plotting products by satisfaction and market presence

Highlighted products: SAS Viya, IBM SPSS Statistics, Minitab Statistical Software, Base SAS, Posit Team, Qualtrics Market Research, Orange, and KNIME.

Underlying data: [Grid® JSON](https://www.g2.com/categories/statistical-analysis/grids.json?focus%5B%5D=sas-sas-viya&focus%5B%5D=ibm-spss-statistics&focus%5B%5D=minitab-statistical-software&focus%5B%5D=base-sas&focus%5B%5D=posit-team&focus%5B%5D=qualtrics-market-research&focus%5B%5D=orange&focus%5B%5D=knime-analytics-platform)

Velocity (by Research Velocity)

Survey analysis software for research agencies: crosstabs, weighting and editable client reports, in a browser. Velocity (by Research Velocity) is survey analysis software for market research agencies. Open an SPSS, CSV or Excel survey file and it tabulates every question, with weights, subgroups, NETs and significance tests. Every figure can be inspected for who it counts, its base and the test behind it. A report starts from the analyses as slides with headlines, charts and the base, weight and test beneath each one, and exports as editable PowerPoint. On the Professional plan an exported deck can be updated when the data changes, and reports can go to Google Slides. Velocity (by Research Velocity) also opens a Q project: a QPack, or a .Q file with its data. It reads the definitions, weight and tables, counts each table again and compares its figures with the PowerPoint exported from Q. Q's R and JavaScript rules are kept and not run. The Advanced plan adds key drivers, TURF, price testing, correspondence analysis, factor analysis and segments. Velocity (by Research Velocity) does not have MaxDiff, conjoint or latent class. Analysis runs in the browser on your computer. Projects are saved to your account in the European Union. Subscriptions are for UK work use; the 14-day trial needs no card. An alternative to Q Research Software, Displayr and SPSS.

Who Is the Company Behind Velocity (by Research Velocity)?

Voonix

Who Is the Company Behind Voonix?

AI can help you find the answers. G2 helps you trust them.

Connect G2 to Claude or ChatGPT for answers grounded in G2's trusted reviews, comparisons, and pricing from real user insights.

How it works

WinStat

Input your data directly in Excel, or use one of the many import possibilites that Excel offers.

Who Is the Company Behind WinStat?

WorkStudy+

WorkStudy+ is a software application suite for performing time studies, work sampling and other work measurement data collection and analysis.

Who Is the Company Behind WorkStudy+?

XLfit

Who Is the Company Behind XLfit?

  • Seller: IDBS
  • Year Founded: 1989
  • HQ Location: Woking, England, United Kingdom
  • LinkedIn® Page: www.linkedin.com
    330 employees on LinkedIn®

ZIPPYDOC

Who Is the Company Behind ZIPPYDOC?

  • Seller: ZIPPYDOC
  • Year Founded: 2021
  • HQ Location: Frankfurt, DE
  • LinkedIn® Page: www.linkedin.com
    1 employees on LinkedIn®

Zometric DOE & Experiments Management

DOE & Experiments Management answers the question every process engineer keeps asking: which parameter combination actually delivers the best yield? It pairs a full statistical Design of Experiments engine with an experiments-management system, so every trial is designed, executed, analysed and archived on the same record. The next engineer who asks "did we try this?" gets an answer in seconds. Statistical DOE capabilities: * Definitive Screening designs up to 48 factors * Full Factorial and Fractional Factorial designs * Response Surface Methodology * Taguchi methods * Mixture DOE for 2 to 7 components * Response Optimizer to find the final settings across one or more responses * Power and resolution computed up front, before runs are wasted, not discovered after Experiments management capabilities: * Design and planning tools: define factors and levels, generate the run sheet, assign runs to shifts * Data collection integration: feed measurements directly from gauges, instruments or Zometric Edge into the experiment record, with no manual transcription and no transcription errors * Experiment repository: a centralised archive of every trial with factors, levels, runs, measurements, conclusions and the engineer who ran it. Searchable, comparable, citable * Knowledge management: search past experiments by material, parameter or outcome. Never repeat a failed trial. Onboard a new process engineer with the full experimental history of the line Every experiment is analysed with the complete Statistical AI engine behind the Zometric platform: main effects, interactions, residuals and optimization, each with a plain-language AI interpretation written for the engineer, manager or auditor reading it. Grounded in established methodology: classical DOE (Fisher, Box, Taguchi), Response Surface Methodology, Six Sigma DMAIC and the AIAG SPC manual. Fully browser-based with nothing to install. Free pilot configurable in 2 to 3 weeks with your real factory data.

Who Is the Company Behind Zometric DOE & Experiments Management?

Zometric Statistical AI

Statistical AI is the analytical engine behind the Zometric platform: a comprehensive, browser-based statistics suite built for quality engineers, Six Sigma practitioners, process engineers and auditors, not just statisticians. It answers one question: what is the data actually telling you about the process? 130 statistical tools across 14 categories: * SPC Control Charts (19 tools): Xbar-R, Xbar-S, I-MR, P, NP, C, U, Laney-P, Laney-U, CUSUM, EWMA and more, plus Box-Cox and Johnson transformations for non-normal data * Process Capability (12 tools): normal, non-normal, nonparametric, binomial and Poisson capability, machine capability per ISO 22514-3, and Capability Six-Pack * Measurement System Analysis (9 tools): Type 1 GRR, Crossed GRR in AIAG format, Nested GRR, Linearity & Bias, Attribute Agreement, with worksheet generators * Hypothesis Tests (19 tools): t, z, proportion and variance tests, equivalence, normality, outlier, tolerance intervals and bootstrap * ANOVA and Regression: one-way ANOVA, fitted line, multiple regression, logistic (binary, ordinal, nominal), orthogonal, PLS, and ICH Q1E compliant stability studies for pharmaceutical shelf life * Design of Experiments: Definitive Screening up to 48 factors, Full and Fractional Factorial, Mixture DOE, and Response Optimizer * Bioassay (6 tools): parallel line, slope ratio, quantal response, four-parameter logistic and USP cylinder-plate potency methods * Plus Reliability and warranty prediction, Nonparametric tests, Multivariate analysis, Acceptance Sampling (ANSI Z1.4 / Z1.9 AQL plans), 21 graphical analysis tools and random data generators The differentiator: every chart, test and model is read by an AI layer and explained in plain language, written for the engineer, manager or auditor looking at it. Teams stop guessing what a p-value or Cpk means and start acting on it. Built for the standards your regulators and customers already require: AIAG SPC and MSA manuals, ANSI Z1.4 and Z1.9, ICH Q10, and 21 CFR Part 11. Fully browser-based with nothing to install. Works standalone with data from any source, and its APIs embed into every other Zometric module, so the same validated statistics run your live SPC, gauge studies and experiments. Free pilot configurable in 2 to 3 weeks.

Who Is the Company Behind Zometric Statistical AI?

Bijou Barry
BB
Researched and written by Bijou Barry