Best Enterprise Predictive Analytics Software - Page 3

How Many Predictive Analytics Software Products Does G2 Track?

Total Products under this Category: 425

Category Stats (Oct 2026)

  • Average Rating: 4.44/5 The average rating of products in this category, based on all submitted ratings
  • Top Trending Product: Salesloft (+1.52%) - Among all products in this category, Salesloft recorded the largest rating increase compared to last month

Last updated: October 15, 2026

How Does G2 Rank Predictive Analytics Software Products?

Why You Can Trust G2's Software Rankings:

  • 30 Analysts and Data Experts
  • 32,200+ Authentic Reviews
  • 425+ Products
  • Unbiased Rankings

G2's software rankings are built on verified user reviews, rigorous moderation, and a consistent research methodology maintained by a team of analysts and data experts. Each product is measured using the same transparent criteria, with no paid placement or vendor influence. While reviews reflect real user experiences, which can be subjective, they offer valuable insight into how software performs in the hands of professionals. Together, these inputs power the G2 Score, a standardized way to compare tools within every category.

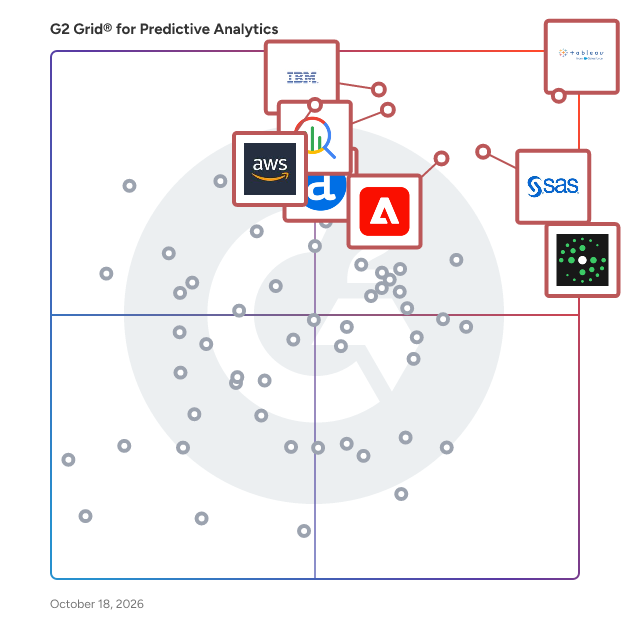
G2 Grid® for Predictive Analytics Software

G2 Grid® for Predictive Analytics Software plotting products by satisfaction and market presence

Highlighted products: Tableau, Salesloft, IBM Cognos Analytics, SAS Viya, Alteryx, Google Cloud BigQuery, Adobe Analytics, and Amazon Quick.

Underlying data: [Grid® JSON](https://www.g2.com/categories/predictive-analytics/grids.json?focus%5B%5D=tableau&focus%5B%5D=salesloft&focus%5B%5D=ibm-cognos-analytics&focus%5B%5D=sas-sas-viya&focus%5B%5D=alteryx&focus%5B%5D=google-cloud-bigquery&focus%5B%5D=adobe-analytics&focus%5B%5D=amazon-quick&segment=enterprise)

ibi WebFOCUS

The ibi WebFOCUS® platform is an enterprise business intelligence and analytics solution equipped with data management, visual discovery, predictive analytics, and powerful visualizations. Combining these capabilities and data science in one unified platform, the WebFOCUS solution helps make data-driven decisions across the enterprise providing reports, dashboards, and customer-facing applications at scale.

Average Rating: 4.4/5.0

Total Reviews: 149

How Do G2 Users Rate ibi WebFOCUS?

  • Has the product been a good partner in doing business?: 8.9/10 (Category avg: 8.9/10)
  • Algorithms: 8.1/10 (Category avg: 8.6/10)

Who Is the Company Behind ibi WebFOCUS?

  • Seller: ibi
  • Year Founded: 1975
  • HQ Location: Fort Lauderdale, FL
  • Twitter: @infobldrs
    32,864 Twitter followers
  • LinkedIn® Page: www.linkedin.com
    890 employees on LinkedIn®
  • Phone: 212-736-4433

Who Uses This Product?

  • Top Industries: Information Technology and Services, Government Administration
  • Company Size: 57% Large, 32% Medium

What Are Recent G2 Reviews of ibi WebFOCUS?

What Are G2 Users Discussing About ibi WebFOCUS?

Plotly Dash Enterprise

Dash is the trusted solution for operationalizing Python models, allowing data science teams to focus on data and models, while still producing and deploying enterprise-ready apps. What would typically require a team of back-end developers, front-end developers and IT can all be done with Dash. It enables data science teams to build, design, deploy, and securely manage data-driven applications that align with your business goals. Companies can deliver on their data, analytic, and AI initiatives quickly and effectively -- no JavaScript, CSS, CronJobs or DevOps required.

Average Rating: 4.8/5.0

Total Reviews: 36

How Do G2 Users Rate Plotly Dash Enterprise?

  • Has the product been a good partner in doing business?: 8.8/10 (Category avg: 8.9/10)
  • Algorithms: 9.2/10 (Category avg: 8.6/10)

Who Is the Company Behind Plotly Dash Enterprise?

  • Seller: Plotly
  • Year Founded: 2013
  • HQ Location: Montréal, CA
  • Twitter: @plotlygraphs
    41,308 Twitter followers
  • LinkedIn® Page: www.linkedin.com
    103 employees on LinkedIn®

Who Uses This Product?

  • Top Industries: Computer Software
  • Company Size: 47% Small, 31% Large

What Do G2 Reviewers Say About Plotly Dash Enterprise?

AI-generated summary from verified user reviews

Pros
  • Users appreciate the easy charting features of Plotly Dash Enterprise, enabling beautiful visualizations without coding.
  • Users appreciate the coding ease of Plotly Dash Enterprise, simplifying the creation of stunning visualizations effortlessly.
  • Users appreciate the excellent customer support of Plotly Dash Enterprise, enhancing their overall experience and productivity.
  • Users appreciate the ease of dashboard management in Plotly Dash Enterprise, creating efficient visualizations effortlessly.
  • Users love the user-friendly data visualization features of Plotly Dash Enterprise, enabling stunning dashboards effortlessly.

What Are Recent G2 Reviews of Plotly Dash Enterprise?

What Are G2 Users Discussing About Plotly Dash Enterprise?

Spotfire Analytics

Spotfire® is a visual data science platform designed to help organizations address complex, industry-specific challenges by effectively utilizing data. This solution offers a range of flexible packaging options tailored to meet the diverse needs of teams at various stages of their visual data science journey. Turn raw data into real-time decisions with powerful, interactive visual analytics with Spotfire® Analytics. Spotfire Analytics is designed for business agility, enabling every user to explore data visually, uncover patterns quickly, and make confident, data-driven decisions without writing a single line of code. As a self-service visual data science solution, it empowers teams across roles and departments to gain fast, actionable insights that drive impact. With its no-code interactive dashboards and rich visual exploration capabilities, Spotfire Analytics connects natively to hundreds of cloud, on-premises, and real-time data sources. Built-in geoanalytics extend the power of analysis with multi-layer mapping and seamless integration of spatial data, while data wrangling and transformation can be performed directly within the visual interface, making it easy to clean, shape, and blend data as you analyze. AI-assisted recommendations and anomaly detection help uncover hidden patterns, suggest the most meaningful visualizations, and accelerate the path to discovery. Customizable visualizations, workflows, and an intuitive interface ensure that insights are not only easier to create but also easier to share. With seamless collaboration features, Spotfire Analytics enables teams to work together, align on insights, and act decisively. Whether the goal is to analyze trends, detect anomalies, or unlock location-based intelligence, Spotfire Analytics delivers the speed, flexibility, and depth needed to make smarter decisions with confidence. Explore and understand your data visually, uncover hidden insights, and build powerful analytics applications - all without writing a single line of code. Spotfire Analytics combines advanced interactive visualizations and intuitive data wrangling in one environment. Connect to hundreds of data sources, from files to real-time streaming data, and transform messy data directly within your visuals. Built-in AI recommendations help you find patterns, anomalies, and trends faster. With flexible visualizations, spatial analytics, and custom applications, anyone can turn raw data into actionable insights in minutes. Designed for business agility, Spotfire Analytics empowers every user to explore, analyze, and share results confidently - turning questions into decisions. Best for: Analysts, data-savvy professionals, and teams looking to explore and share data visually with maximum flexibility.

Average Rating: 4.2/5.0

Total Reviews: 328

How Do G2 Users Rate Spotfire Analytics?

  • Has the product been a good partner in doing business?: 8.4/10 (Category avg: 8.9/10)
  • AI Text Summarization: 8.3/10 (Category avg: 8.1/10)
  • Algorithms: 6.3/10 (Category avg: 8.6/10)
  • AI Text Generation: 8.3/10 (Category avg: 8.1/10)

Who Is the Company Behind Spotfire Analytics?

Who Uses This Product?

  • Who Uses This: Student, Manager
  • Top Industries: Oil & Energy, Information Technology and Services
  • Company Size: 52% Large, 26% Medium

What Do G2 Reviewers Say About Spotfire Analytics?

AI-generated summary from verified user reviews

Pros
  • Users appreciate the powerful and flexible data visualization capabilities of Spotfire Analytics, enhancing their data exploration experience.
  • Users appreciate the ease of use of Spotfire Analytics, enabling quick insights and effective decision-making with complex data.
  • Users love the transformative interactive visualizations of Spotfire, simplifying complex data for clear understanding across teams.
  • Users appreciate the easy integrations of Spotfire Analytics, enhancing accuracy and enabling robust AI-powered analytics seamlessly.
  • Users rave about Spotfire's powerful analytics capabilities, enabling advanced data handling and insightful visualizations seamlessly.
Cons
  • Users find Spotfire's steep learning curve challenging, particularly for those unfamiliar with data modeling and scripting.
  • Users find the learning difficulty significant, especially for beginners navigating advanced features and options in Spotfire.
  • Users find the licensing costs high, making Spotfire Analytics less accessible for smaller organizations.
  • Users find the steep learning curve of Spotfire Analytics challenging, especially regarding advanced features and user interface.
  • Users often face a steep learning curve with Spotfire Analytics, making initial use challenging for newcomers.

What Are Recent G2 Reviews of Spotfire Analytics?

What Are G2 Users Discussing About Spotfire Analytics?
Bijou Barry
BB
Researched and written by Bijou Barry
Updated