Best Manufacturing Intelligence Software - Page 13

How Many Manufacturing Intelligence Software Products Does G2 Track?

Total Products under this Category: 196

Category Stats (Sep 2026)

  • Average Rating: 4.44/5 The average rating of products in this category, based on all submitted ratings
  • Top Trending Product: Plutoshift (+0.86%) - Among all products in this category, Plutoshift recorded the largest rating increase compared to last month

Last updated: September 15, 2026

How Does G2 Rank Manufacturing Intelligence Software Products?

Why You Can Trust G2's Software Rankings:

  • 30 Analysts and Data Experts
  • 2,300+ Authentic Reviews
  • 196+ Products
  • Unbiased Rankings

G2's software rankings are built on verified user reviews, rigorous moderation, and a consistent research methodology maintained by a team of analysts and data experts. Each product is measured using the same transparent criteria, with no paid placement or vendor influence. While reviews reflect real user experiences, which can be subjective, they offer valuable insight into how software performs in the hands of professionals. Together, these inputs power the G2 Score, a standardized way to compare tools within every category.

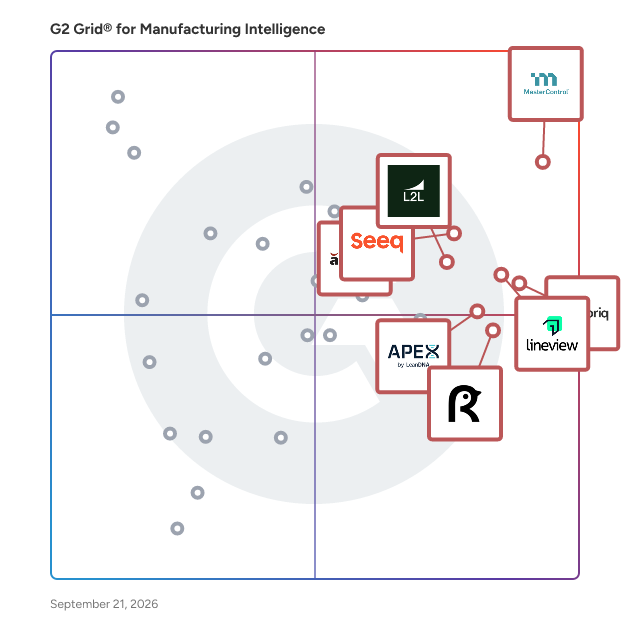
G2 Grid® for Manufacturing Intelligence Software

G2 Grid® for Manufacturing Intelligence Software plotting products by satisfaction and market presence

Highlighted products: MasterControl Manufacturing Excellence, Fabriq, Lineview, Seeq, aPriori Manufacturing Intelligence Platform, L2L, Factbird, and APEX.

Underlying data: [Grid® JSON](https://www.g2.com/categories/manufacturing-intelligence/grids.json?focus%5B%5D=mastercontrol-manufacturing-excellence&focus%5B%5D=fabriq-fabriq&focus%5B%5D=lineview&focus%5B%5D=seeq&focus%5B%5D=apriori-manufacturing-intelligence-platform&focus%5B%5D=l2l&focus%5B%5D=factbird&focus%5B%5D=leandna-apex)

Sunday BizSystems Asset Tracking Database

Asset Tracking Database is an asset tracking software that tracks and controls calibrated equipment and manages preventive maintenance schedules.

Who Is the Company Behind Sunday BizSystems Asset Tracking Database?

Teeptrak

TeepTrak — Real-Time Manufacturing Performance Overview TeepTrak is a real-time manufacturing performance platform that gives factories instant visibility into OEE, downtime, scrap, and plan attainment—line by line and site by site. It blends simple operator inputs with data from sensors/PLCs to surface losses as they happen and drive frontline action. Built for: Plant & operations leaders, production and quality managers, and continuous improvement teams across discrete and process industries. Key Features & Functionality PerfTrak (OEE & Downtime): Real-time OEE (A/P/Q), stoppage timelines, and loss Pareto to recover hidden capacity. QualTrak (In-Process Quality & SPC): Digital checks, SPC trends, first-pass yield, and scrap tracking to catch deviations early. PaceTrak (Throughput vs Plan): Target-vs-actual (takt) dashboards, plan attainment, and variance alerts to keep crews on pace. ProcessTrak (Process Parameters): Live monitoring of temperature/pressure/humidity and recipe conformance to stabilize runs. Add-ons: PerfTrak OPC UA for modern, secure machine connectivity; MoniTrak to broadcast KPIs on line-side or meeting-room screens. Fast start: Quick installation (often under an hour) and compatibility across mixed machine parks (legacy + modern). Deployment Cloud-first rollout with edge data collection. Operator-friendly terminals/tablets and role-based dashboards. Configurable alerts/notifications and escalation paths. Outcomes You Can Expect Faster recovery from losses and stabilized processes. Lower scrap and measurable OEE uplift. A shared single source of truth across shifts and sites. Value Proposition Positioning Purpose-built, real-time production performance—not a generic app builder or static reporting tool. TeepTrak focuses on OEE, downtime, quality, pace, and process stability with line-ready modules operators adopt quickly. What Makes It Different Out-of-the-box modules (PerfTrak, QualTrak, PaceTrak, ProcessTrak) → less custom building, faster time-to-value. Fast rollout & broad compatibility (often <1h to get started; works with both legacy and modern equipment). Native OPC UA option (PerfTrak OPC UA) for secure, modern connectivity. KPI broadcasting with MoniTrak for instant, shared visibility across shifts and sites. Global footprint & credibility (Paris HQ; Chicago & Shenzhen sales presence; ecosystem recognition). How It Changes Customers’ Lives Less firefighting, more control: real-time alerts surface bottlenecks, micro-stops, and quality drifts before they cascade. Standardized excellence: multi-site dashboards and reason-code capture enable weekly loss reviews and repeatable CI routines. Faster wins: quick deployment and operator-first UX mean teams act in days—not months—accelerating measurable improvement.

Who Is the Company Behind Teeptrak?

  • Seller: Teeptrak
  • Year Founded: 2014
  • HQ Location: Paris, France
  • LinkedIn® Page: www.linkedin.com
    18 employees on LinkedIn®

TilliT

The TilliT Digital Manufacturing Operations software enables fully paperless operations by integrating production, quality, and maintenance processes in a single low-code cloud platform. Light-weight and easily deployed TilliT combines asset performance monitoring, OEE, work order execution, quality management, knowledge management and production scheduling driven by workflow automation and AI optimization. By connecting to existing equipment or by using our suite of IoT sensors, TilliT brings together people, products, processes and equipment for complete operational control.

Average Rating: 4.0/5.0

Total Reviews: 1

Who Is the Company Behind TilliT?

  • Seller: TilliT
  • Year Founded: 2021
  • HQ Location: Brisbane City, AU
  • Twitter: @GoTilliT
    11 Twitter followers
  • LinkedIn® Page: www.linkedin.com
    8 employees on LinkedIn®

Who Uses This Product?

  • Company Size: 100% Medium

What Are Recent G2 Reviews of TilliT?

True ValueHub

True ValueHub is an AI and cloud-based software that helps manufacturing companies identify 30%+ cost savings on purchased parts and assemblies in mechanical, electro-mechanical and electronics categories. Our solution increases visibility into the true cost of manufacturing custom purchased parts and assemblies across the globe. It is an easy-to-use, intuitive AI engine that provides detailed breakdown of the total landed cost (Should Cost, Could Cost, Best Cost). It reduces the sourcing cycle time and new product time-to-market. AI-Powered Sourcing Co-pilot: Continuous background analysis of custom purchased portfolios to identify cost-saving opportunities and potential risks across 50+ countries Comprehensive Process Coverage: Support for 130+ manufacturing processes Zero RFQ Capability: Automated instant quote generation through digital factory Scope 3 Emissions Analytics: Built-in carbon footprint assessment and reduction recommendations for sustainable sourcing Design Optimization: Integrated DFM (Design for Manufacturing) recommendations Our cloud-based solution can be calibrated to specific supply chain needs, ready for use within days and seamlessly integrated with existing ERP/PLM applications. True ValueHub was developed by procurement and engineering practitioners with decades of strategic sourcing, manufacturing and engineering experience. It delivers measurable cost savings and unlocks real value for manufacturing companies.

Who Is the Company Behind True ValueHub?

Vanti Analytics

with Vanti, operations managers can increase bottom-line productivity in hours by focusing on each unit.

Average Rating: 5.0/5.0

Total Reviews: 1

How Do G2 Users Rate Vanti Analytics?

  • Has the product been a good partner in doing business?: 10.0/10 (Category avg: 9.1/10)

Who Is the Company Behind Vanti Analytics?

Who Uses This Product?

  • Company Size: 100% Small

What Do G2 Reviewers Say About Vanti Analytics?

AI-generated summary from verified user reviews

Pros
  • Users appreciate the advanced recommendations and visuals provided by Vanti Analytics, enhancing data utilization significantly.
  • Users love the enhanced visuals of Vanti Analytics, discovering valuable insights from their data like never before.
  • Users value the insightful visualizations and recommendations offered by Vanti Analytics, revealing hidden data potentials.
Cons
  • Users note that there are limited options available on the charts, affecting their analytical flexibility.

What Are Recent G2 Reviews of Vanti Analytics?

Vimana

Who Is the Company Behind Vimana?

  • Seller: VIMANA
  • Year Founded: 2009
  • HQ Location: Naperville, US
  • LinkedIn® Page: www.linkedin.com
    57 employees on LinkedIn®

VT-APS (VT-Advanced Planning and Scheduling)

T-APS Advanced Program and Scheduling Product Ease of Use: 1. Optimizing input conditions is simple 2. Provide 40 multi-objective optimization evaluations in 11 categories 3. Multi-objective can be optimized in any combination with target weighting order as needed 4. Plan to respond quickly to customers and suppliers 5. No complicated rules design 6. Provides 32 built-in optimization generation algorithms 7. The sequence of up-and-down operations is associated with dynamic preparation time minimization optimization 8. The processing process is an alternative multi-resource (machine) automatic optimal selection of multi-resource parallel processing MPCM 9. Support mesh process structure diagram and parallel processing of processes 10. Non-24-hour work calendar and supports multiple time slots in one shift 11. Dynamic scheduling realizes the fixed-period (fixed/locked machining sequence within N days) processing tasks in T+N days

Average Rating: 5.0/5.0

Total Reviews: 1

Who Is the Company Behind VT-APS (VT-Advanced Planning and Scheduling)?

Who Uses This Product?

  • Company Size: 100% Medium

What Do G2 Reviewers Say About VT-APS (VT-Advanced Planning and Scheduling)?

AI-generated summary from verified user reviews

Pros
  • Users appreciate the automation capabilities of VT-APS, allowing for efficient scheduling and time management.
  • Users value the scheduling efficiency of VT-APS, allowing them to prioritize other important tasks effectively.

What Are Recent G2 Reviews of VT-APS (VT-Advanced Planning and Scheduling)?

WATS

WATS is a Test Data Management solution for Electronics Manufacturing. It automates real-time data collection and gives easy access to your data and a Global overview of manufacturing. Features include Live Dashboards, True First Pass Yield Analysis, Step-Fail Pareto, Rolling Yield, Process Yield, Process Capability Analysis, Alarming, SPC/Run-Charts, Repair Interface and Repair Statistics, Manual Inspection, Software and MAC Distribution, and much more.

Who Is the Company Behind WATS?

Xentara

AI, cloud, and data technologies have evolved rapidly. In contrast, traditional control systems remain rigid and incompatible. Legacy systems often involve complex hardware and wiring and rely on old control technology. Modern manufacturers need a way to bridge legacy and emerging technologies to overcome the limitations of traditional systems and enable next-level productivity, quality, and sustainability. embedded ocean was established to fill this critical gap between modern digital technologies and traditional industrial technologies to unlock the potential of software-defined control. Xentara is a modern edge platform for industrial control - designed to meet the demands of real-time automation at the edge, empowering software-defined control systems. It offers both event-driven and cyclic processes - ensuring real-time responsiveness while maintaining scheduled efficiency designed for ultra-high precision (up to 100kHz) - tailored for the most demanding applications. Xentara functions as a bridge between OT (Operational Technology) and IT (Information Technology) - enabling seamless integration across domains, boosting interoperability & semantic abstraction - unlocking smarter, more connected, modular, and efficient industrial systems.

Who Is the Company Behind Xentara?

Zometric Live Dashboards

Zometric Live Dashboards decide what every operator, supervisor and plant head sees when they look up. Drag-and-drop dashboards aggregate every part of the operation, quality, production and maintenance, into the view each role needs, self-updating around the clock in 100+ languages. Build any view from one designer: * Drag-and-drop layout for any dashboard, any KPI, any module. The plant head's view, the operator's view and the corporate view come from the same designer * Multi-module aggregation puts quality, production and maintenance side by side on one screen, so the morning meeting stops being a tour of three different reports * Leadership-ready roll-ups: the same data model serves machine-level dashboards and corporate views. The CEO and the operator look at consistent numbers, just at different altitudes Built for the factory environment: * Self-updating slides at a configurable interval. No manual refresh, no stale numbers, no meeting that opens with "the data is from last week" * 24x7 shopfloor operation, designed for always-on TV display in noisy factory environments. The dashboard survives a network blip, a browser refresh and a Monday morning * 100+ languages with one-click translation, so the operator in Japan, the engineer in India and the plant head in Brazil see the same dashboard in their own language Because dashboards draw from the same live backbone as Zometric's SPC, production, maintenance and inspection modules, there is no manual report assembly and no stale data. The number on the wall is the number in the system. Browser-based with nothing to install, running on shopfloor TVs, desktops, tablets and phones. Free pilot configurable in 2 to 3 weeks with your real factory data.

Who Is the Company Behind Zometric Live Dashboards?

Nathan Calabrese
NC
Researched and written by Nathan Calabrese
Updated October 3, 2024