Best Exploration Software - Page 2

How Many Exploration Software Products Does G2 Track?

Total Products under this Category: 36

Category Stats (Sep 2026)

  • Average Rating: 4.24/5 (↓0.01 vs Aug 2026) The average rating of products in this category, based on all submitted ratings

Last updated: September 16, 2026

How Does G2 Rank Exploration Software Products?

Why You Can Trust G2's Software Rankings:

  • 30 Analysts and Data Experts
  • 100+ Authentic Reviews
  • 36+ Products
  • Unbiased Rankings

G2's software rankings are built on verified user reviews, rigorous moderation, and a consistent research methodology maintained by a team of analysts and data experts. Each product is measured using the same transparent criteria, with no paid placement or vendor influence. While reviews reflect real user experiences, which can be subjective, they offer valuable insight into how software performs in the hands of professionals. Together, these inputs power the G2 Score, a standardized way to compare tools within every category.

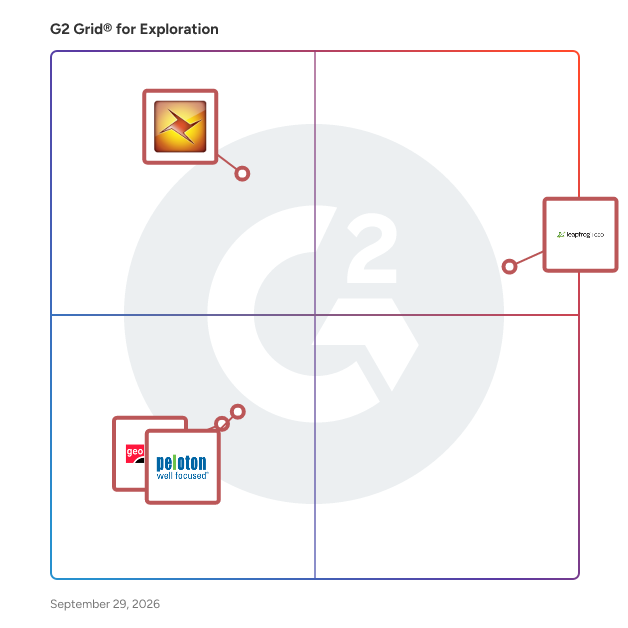
G2 Grid® for Exploration Software

G2 Grid® for Exploration Software plotting products by satisfaction and market presence

Highlighted products: Leapfrog Geo, Petrel E&P Software Platform, WellView, and geoSCOUT.

Underlying data: [Grid® JSON](https://www.g2.com/categories/exploration/grids.json?focus%5B%5D=leapfrog-geo&focus%5B%5D=schlumberger-petrel-e-p-software-platform&focus%5B%5D=wellview&focus%5B%5D=geoscout)

Drillbench Dynamic Drilling Simulation Software

Dynamic drilling simulations for pressure control, well control, blow out control, managed and underbalanced operations.

Who Is the Company Behind Drillbench Dynamic Drilling Simulation Software?

  • Seller: SLB
  • Year Founded: 1846
  • HQ Location: Houston, TX
  • Twitter: @Schlumberger
  • LinkedIn® Page: www.linkedin.com
    81,934 employees on LinkedIn®
  • Ownership: LSE:SCL

Genesis Planning and Follow Up (PFU)

Genesis PFU allows you to plan an intervention by designing a new activity sequence based on historical data. The intervention plan is followed up with actual times from executed operations.

Who Is the Company Behind Genesis Planning and Follow Up (PFU)?

GeoFrame Reservoir Characterization Software

GeoFrame reservoir characterization software provides a comprehensive solution for your integrated seismic, geological, mapping, and petrophysical interpretation needs.

Who Is the Company Behind GeoFrame Reservoir Characterization Software?

  • Seller: SLB
  • Year Founded: 1846
  • HQ Location: Houston, TX
  • Twitter: @Schlumberger
  • LinkedIn® Page: www.linkedin.com
    81,934 employees on LinkedIn®
  • Ownership: LSE:SCL

Geology by Seisware

Geology by SeisWare places traditional geologic interpretation tools, including tops picking and log correlation, into a dynamic 3D environment. Any changes in interpretation are immediately reflected in 2D and 3D space, with structural surfaces and zone interval maps updating on the fly. Dynamic cross sections can be moved through the reservoir to check for accuracy and consistency in interpretations. Best of all, Geology is fully integrated with Geophysics by SeisWare, for a complete sub-surface interpretation solution.

Who Is the Company Behind Geology by Seisware?

GeoX Exploration Risk, Resource, and Value Assessment Software

GeoX exploration risk, resource, and value assessment software provides easy-to-use and scalable decision support for consistent, unbiased, and accurate assessments of your exploration opportunities in any environment or risk scenario.

Who Is the Company Behind GeoX Exploration Risk, Resource, and Value Assessment Software?

  • Seller: SLB
  • Year Founded: 1846
  • HQ Location: Houston, TX
  • Twitter: @Schlumberger
  • LinkedIn® Page: www.linkedin.com
    81,934 employees on LinkedIn®
  • Ownership: LSE:SCL

Grain-e

Digital Twin of Wellbore Geology Digitalising Sediment Description using AI: From Grain Images to Reservoir Insights Our team has developed a powerful new approach that uses machine learning to transform how geologists interact with cuttings samples. By combining high-resolution imagery, artificial intelligence, and interactive filtering tools, we’re making it possible to measure thousands of individual grains automatically and accurately in each cutting sample, delivering detailed sedimentological data in a fraction of the time. From Cuttings to Clean Data To create consistent data, samples are processed using the proprietary approach of Rockwash Geodata. The samples go through a fully automated washing process. Each samples is photographed under controlled lighting. Each image captures fine details of a 43 mm by 28 mm area at extremely high resolution (4000 x 6000 pixels). Smart Grain Segmentation (AI) The real breakthrough lies in what happens next. Using a proprietarily trained segment anything model, we segment the image—identifying and outlining individual grains. This gives us a digital map of the grains in each sample. We then calculate properties like grain size, roundness, sphericity, and average colour for each grain. However, the process isn’t perfect. Sometimes the model mistakes a bit of shale or paint for a grain, or combines multiple grains into one. That’s why we’ve developed an interactive filtering system that lets geologists review and refine the output. With sliders and visual tools, users can filter out grains based on colour, size, shape, brightness, and whether the grain is clearly visible in the foreground. This ensures only representative grains are included in the final datasets. Sedimentary statistics The ability to get grain size, sorting, sphericity and other characteristics on thousands of grains allows for a vast dataset to understand the sedimentology. With the ability to filter out shale contamination, cavings, drilling additives and partially obscured background grains allows for a clean high confidence sedimentological information in even highly contaminated samples. Geomechanics (Pore Pressure module) An exciting feature is the ability to identify “splintery” cavings—elongated fragments that can indicate high pore pressure zones in the subsurface. These features often appear in over-pressured formations where the rock breaks due to higher pore pressure than mud weight. Automatically detecting and quantifying these features identifies early warning signs for drilling hazards and informs geomechanical models in offset wells. Stratigraphic subdivision With the ability to extract colours from each grain, given the high-quality consistent lighting we can build stratigraphic logs based on bulk colour (majority of the grains) and trace colour (few or single occurrence grains in a sample). These colour logs can reveal subtle changes in bulk or trace mineralogy relating to provenance and depositional environments. Why It Matters This approach has several big advantages. First, it creates a consistent, repeatable way to describe sediments. Whether you’re working on a single well or comparing data across a basin, the measurements are objective and data-driven. Second, it dramatically speeds up analysis. Instead of estimating colours and composition under the microscope, the system analyses thousands of grains in each sample, with hundreds of samples in a well. Third, it opens up new types of data that were previously hard to capture at scale. Properties like sphericity, trace colour, or the presence of splintery cavings can now be logged quantitatively and consistently. Applications Reservoir Characterisation: Detailed grain properties help assess sorting, depositional energy, and potential permeability. Drilling Safety: Detection of splintery cavings can support real-time pore pressure prediction. Stratigraphy and Correlation: Colour logs and grain statistics assists correlation between wells and identification of subtle lithological changes. Cuttings Digitisation: With a growing move towards digital well data, this method provides a scalable way to digitise physical samples at scale and integrate all your data into subsurface models. Looking Ahead We’re refining the system and expanding its capabilities. Talk to us about your specific problems and we will develop the tools to extract the statistics you most need!

Who Is the Company Behind Grain-e?

Haul Infinity

Integrated open-pit mine planning software. All in intuitive, interactive 3D.

Who Is the Company Behind Haul Infinity?

  • Seller: Alastri
  • Year Founded: 2012
  • HQ Location: Perth, AU
  • LinkedIn® Page: www.linkedin.com
    4 employees on LinkedIn®

IFS Upstream Oil and Gas

IFS Upstream Oil and Gas is enterprise software covering operations from field to financials, including production operations, accounting, land management, and geospatial information. It supports lease acquisition, revenue and joint venture accounting, asset lifecycle management, and field data capture.

Average Rating: 3.5/5.0

Total Reviews: 4

Who Is the Company Behind IFS Upstream Oil and Gas?

  • Seller: IFS
  • Year Founded: 1983
  • HQ Location: Linkoping , Sweden
  • Twitter: @ifs
    18,002 Twitter followers
  • LinkedIn® Page: www.linkedin.com
    9,233 employees on LinkedIn®
  • Ownership: STO: IFS

Who Uses This Product?

  • Company Size: 50% Medium, 25% Large

What Are Recent G2 Reviews of IFS Upstream Oil and Gas?

What Are G2 Users Discussing About IFS Upstream Oil and Gas?

IMDEX HUB-IQ

MDEXHUB-IQ™ is the secure, cloud-based portal for validating field data seamlessly transmitted from the drill rig.

Who Is the Company Behind IMDEX HUB-IQ?

  • Seller: Reflex
  • Year Founded: 1984
  • HQ Location: Balcatta, AU
  • LinkedIn® Page: www.linkedin.com
    13 employees on LinkedIn®

iPro Transients+

Transients+ is a pressure transient analysis (PTA) software package. Transients+ allows handling of huge volume of raw pressure, rate and cumulative volume data. Its GUI-based data editor facilitates quick and easy editing of these and other data in desired units.

Who Is the Company Behind iPro Transients+?

  • Seller: Plano Research
  • Year Founded: 2001
  • HQ Location: Plano, US
  • Twitter: @PRC_Software
    28 Twitter followers
  • LinkedIn® Page: www.linkedin.com
    4 employees on LinkedIn®

iRoc GeoTrak

GeoTrak is a web-based Exploration Toolkit with a quick, accurate, and intuitive graphical interface for Resource Calculations and Prospect Tracking. GeoTrak offers a highly interactive Input classification with the flexibility to accept reservoir input parameters by lead, prospect, and other classes.

Who Is the Company Behind iRoc GeoTrak?

  • Seller: Plano Research
  • Year Founded: 2001
  • HQ Location: Plano, US
  • Twitter: @PRC_Software
    28 Twitter followers
  • LinkedIn® Page: www.linkedin.com
    4 employees on LinkedIn®

Isatis.neo

Isatis.neo is a geostatistical modeling and spatial data-analysis software application used to characterize spatial variability, generate quantitative estimates, evaluate uncertainty, and support decision-making in resource and environmental contexts. It helps users analyze spatial datasets, estimate variables of interest, simulate spatial phenomena, and quantify associated uncertainty using deterministic and stochastic methods grounded in geostatistical theory. The software is used in fields where decisions depend on understanding how natural or engineered variables vary in space. Common applications include mineral resource estimation, geometallurgical domaining, environmental site characterization, groundwater assessment, soil contamination mapping, subsurface property modeling, renewable energy site assessment, and geological CO₂ storage evaluation. Users import spatial data, examine its distribution and structure, compute variograms, apply kriging or simulation algorithms, and produce 2D/3D spatial representations. Isatis.neo enables the integration of multiple data sources, such as drillhole samples, geophysical measurements, field observations, and raster datasets, into consistent spatial models. Users can incorporate geological or environmental constraints, evaluate sampling strategies, generate multiple realizations to assess uncertainty, and quantify risk associated with spatial estimates. Python integration and workflow automation enable the software to be tailored to organizational procedures and integrated with broader modeling or data-processing frameworks. Industries using Isatis.neo include mining and exploration, environmental consulting, energy (oil and gas, geothermal, and renewables), civil engineering, agriculture and soil science, hydrogeology, and government agencies engaged in natural resource evaluation and environmental regulation. In research settings, the software is used in geosciences, ecology, hydrology, and spatial statistics for quantitative analysis of spatial datasets. Key features: - Comprehensive geostatistical toolbox: Includes methods for exploratory spatial data analysis, variogram modeling, kriging (univariate and multivariate), conditional simulations, trend modeling, multivariate correlations, and uncertainty quantification. - Workflow management and automation: Provides a structured environment for building reproducible modeling sequences, automating repetitive tasks, and standardizing procedures across teams or projects through batch scripting and configurable workflows. - Spatial data visualization and model inspection: Supports 2D/3D visualization of raw data, structural inputs, estimation results, and simulation outputs, allowing users to examine spatial patterns, evaluate model behavior, and compare alternative scenarios. - Python extensibility: Allows users to write custom functions, create derived variables, call external Python libraries, and integrate Isatis.neo into larger computational or data-science pipelines. - Cross-industry applicability: Utilized in mining for grade estimation and resource classification; in environmental studies for plume delineation and remediation planning; in hydrogeology for aquifer property modeling; in energy for subsurface characterization; and in agriculture for soil property mapping.

Who Is the Company Behind Isatis.neo?

  • Seller: Geovariances
  • Year Founded: 1986
  • HQ Location: Avon, FR
  • Twitter: @Geovariances
    402 Twitter followers
  • LinkedIn® Page: linkedin.com
    38 employees on LinkedIn®
landAMPS

landAMPS solution is the web platform, which is critical to the management of project, infrastructure asset and organizational information. The Web platform's dashboard-focused interface gives users of geoAMPS software a centralized repository of data that ensure easy and secure access in the office or in the field.

Who Is the Company Behind landAMPS?

  • Seller: GeoAMPS
  • Year Founded: 2010
  • HQ Location: N/A
  • Twitter: @geoAMPS
    220 Twitter followers
  • LinkedIn® Page: www.linkedin.com
    1 employees on LinkedIn®

Malcolm Interactive Fluid Characterization Software

Malcom Interactive Fluid Characterization Software enables the processing and interpretation of analytical chemistry data to provide greater insights into hydrocarbon samples.

Who Is the Company Behind Malcolm Interactive Fluid Characterization Software?

  • Seller: SLB
  • Year Founded: 1846
  • HQ Location: Houston, TX
  • Twitter: @Schlumberger
  • LinkedIn® Page: www.linkedin.com
    81,934 employees on LinkedIn®
  • Ownership: LSE:SCL
Neya Kumaresan
NK
Researched and written by Neya Kumaresan
Updated October 3, 2024