Best Data Warehouse Solutions - Page 11

How Many Data Warehouse Solutions Products Does G2 Track?

Total Products under this Category: 153

Category Stats (Nov 2026)

  • Average Rating: 4.38/5 The average rating of products in this category, based on all submitted ratings
  • Top Trending Product: Synopsis (+0.77%) - Among all products in this category, Synopsis recorded the largest rating increase compared to last month

Last updated: November 01, 2026

How Does G2 Rank Data Warehouse Solutions Products?

Why You Can Trust G2's Software Rankings:

  • 30 Analysts and Data Experts
  • 8,000+ Authentic Reviews
  • 153+ Products
  • Unbiased Rankings

G2's software rankings are built on verified user reviews, rigorous moderation, and a consistent research methodology maintained by a team of analysts and data experts. Each product is measured using the same transparent criteria, with no paid placement or vendor influence. While reviews reflect real user experiences, which can be subjective, they offer valuable insight into how software performs in the hands of professionals. Together, these inputs power the G2 Score, a standardized way to compare tools within every category.

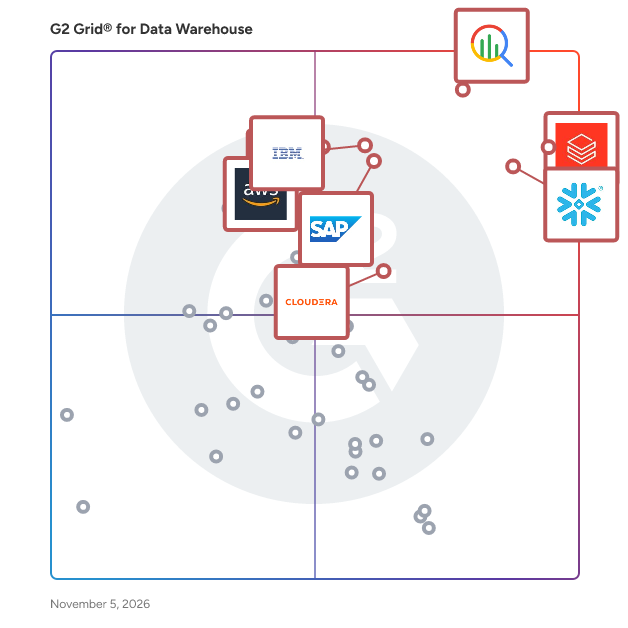
G2 Grid® for Data Warehouse Solutions

G2 Grid® for Data Warehouse Solutions plotting products by satisfaction and market presence

Highlighted products: Databricks, Google Cloud BigQuery, Snowflake, SAP Datasphere, IBM watsonx.data, Amazon Redshift, Teradata Autonomous Knowledge Platform, and Cloudera.

Underlying data: [Grid® JSON](https://www.g2.com/categories/data-warehouse/grids.json?focus%5B%5D=databricks&focus%5B%5D=google-cloud-bigquery&focus%5B%5D=snowflake&focus%5B%5D=sap-datasphere&focus%5B%5D=ibm-watsonx-data&focus%5B%5D=amazon-redshift&focus%5B%5D=teradata-autonomous-knowledge-platform&focus%5B%5D=cloudera&segment=all)

Whatagraph

Whatagraph is the marketing intelligence platform where reporting scales without scaling the team behind it. One governed data foundation powers every destination your team uses — client reports, dashboards, AI tools, BigQuery — so the same trustworthy numbers show up everywhere, without anyone in the middle. The agency stops adding a reporting hire for every ten new clients, because the data layer scales, not the headcount. The data team stops being a ticket queue between marketing and its own numbers, because marketing can self-serve from the same governed foundation the analyst uses. And every cross-channel decision — where to move spend, which campaign to scale, which one to stop — runs on numbers that mean the same thing on Monday as they do on Friday, whether the answer comes from a report, a dashboard, or an AI tool. One foundation. Every destination. No operational tax for growing on top of it.

Average Rating: 4.5/5.0

Total Reviews: 271

How Do G2 Users Rate Whatagraph?

  • Ease of Use: 8.9/10 (Category avg: 8.8/10)

Who Is the Company Behind Whatagraph?

  • Seller: Whatagraph
  • Year Founded: 2015
  • HQ Location: Amesterdam, Netherlands
  • LinkedIn® Page: www.linkedin.com
    54 employees on LinkedIn®

Who Uses This Product?

  • Who Uses This: CEO, Marketing Manager
  • Top Industries: Marketing and Advertising, Information Technology and Services
  • Company Size: 77% Small, 18% Medium

What Do G2 Reviewers Say About Whatagraph?

AI-generated summary from verified user reviews

Pros
  • Users commend the lightning-fast customer support of Whatagraph, ensuring timely assistance directly from the dashboard.
  • Users praise automation in Whatagraph, saving valuable time while creating polished, client-ready reports effortlessly.
  • Users love the customizability of Whatagraph, as it enhances report aesthetics and engagement effortlessly.
  • Users appreciate the ease of use in Whatagraph, enabling quick report creation and seamless integration of data sources.
  • Users love the easy integrations with Whatagraph, allowing seamless access to various data sources for efficient reporting.
Cons
  • Users find Whatagraph to be expensive, making it challenging for solopreneurs to invest long-term.
  • Users find the slow loading frustrating, especially during presentations or tight deadlines, affecting overall productivity.
  • Users note occasional compatibility issues with certain platforms, which may impact their overall experience with Whatagraph.
  • Users face connection issues with Whatagraph, limiting data analysis from personal media accounts effectively.
  • Users experience frustrating editing issues with glitches during simultaneous edits, limiting functionality under tight deadlines.

What Are Recent G2 Reviews of Whatagraph?

What Are G2 Users Discussing About Whatagraph?

XoroLMS

XoroLMS is a cloud based labor management solution which integrates with existing WMS, ERP, and Payroll systems to automate the cumbersome data-crunching process and provides one platform to define, measure and track Individual productivity as well as KPIs in real time. XoroLMS is fmedium to large scale warehousing and distribution companies who are looking to reduce costs and improve productivity of their labor-intensive operation.

Who Is the Company Behind XoroLMS?

  • Seller: Xorosoft
  • Year Founded: 2014
  • HQ Location: Burnaby, BC
  • LinkedIn® Page: www.linkedin.com
    73 employees on LinkedIn®

Yres

Yres is a data warehouse automation platform for Microsoft Azure, developed by Plainwater in the Netherlands. It is built for data and BI teams that want a governed, query-ready data warehouse under Power BI without writing and maintaining ETL pipelines by hand. The principle is simple: you don't write pipelines, you add metadata. In the Yres web application you configure a data source, select the tables and choose a load type. Yres then generates the Azure Data Factory pipelines, the staging and history tables and the load schedule. Nobody writes a pipeline manually, and every generated pipeline follows the same tested pattern. Data loading and history Yres loads sources incrementally and keeps full history using slowly changing dimensions type 2 (SCD2), so every change in the source system is preserved and every report can be reproduced as of any date. Load types include full load, delta load and change feed. Each load is logged and monitored, with load status, health checks and data retention built in. Any table can be rolled back to a point in time, including its history and surrogate keys. Connectors Yres has its own connectors for AFAS and Exact Online, the two most common ERP systems in the Netherlands. It also reads SAP (via SAP Analytics Cloud, Datasphere and Business Data Cloud), Salesforce, Microsoft Dynamics 365 Business Central, ServiceNow, HubSpot, SQL Server, Oracle, PostgreSQL, REST APIs and files on SFTP, FTP or SharePoint. Open data sources such as CBS StatLine are available as ready-made sources. An optional Parquet change feed delivers the data to Azure Data Lake Storage for Microsoft Fabric or Databricks. Your own Azure tenant, no lock-in Everything runs inside the customer's own Azure subscription: the Azure Data Factory, the Azure SQL Database, the metadata and the keys in Azure Key Vault. Plainwater never hosts or touches your data. If you stop the subscription, you receive a licence key and the installation keeps loading. Deployment runs through Azure DevOps repositories and CI/CD pipelines, and customers can be given access to them on request. Pricing Pricing is fixed and public, from EUR 350 per month, with no per-row, per-user or per-connector fees. The comparison with TimeXtender, AnalyticsCreator and building it yourself on Azure Data Factory and dbt is published and sourced on yres.eu. Who uses Yres Yres is used by mid-sized organisations in manufacturing and food, housing associations, healthcare and business services, among them Aviko, Paragon Customer Communications, Koninklijke Visio and housing association 'thuis. Plainwater is an official partner of AFAS, Exact Online and SAP, and Yres is listed on the Microsoft Marketplace.

Who Is the Company Behind Yres?

Shalaka Joshi
SJ
Researched and written by Shalaka Joshi
Updated October 3, 2024