Best Data Visualization Tools - Page 43

How Many Data Visualization Tools Products Does G2 Track?

Total Products under this Category: 762

Category Stats (Nov 2026)

  • Average Rating: 4.44/5 The average rating of products in this category, based on all submitted ratings
  • Top Trending Product: Upsolve AI (+1.75%) - Among all products in this category, Upsolve AI recorded the largest rating increase compared to last month

Last updated: November 01, 2026

How Does G2 Rank Data Visualization Tools Products?

Why You Can Trust G2's Software Rankings:

  • 30 Analysts and Data Experts
  • 22,900+ Authentic Reviews
  • 762+ Products
  • Unbiased Rankings

G2's software rankings are built on verified user reviews, rigorous moderation, and a consistent research methodology maintained by a team of analysts and data experts. Each product is measured using the same transparent criteria, with no paid placement or vendor influence. While reviews reflect real user experiences, which can be subjective, they offer valuable insight into how software performs in the hands of professionals. Together, these inputs power the G2 Score, a standardized way to compare tools within every category.

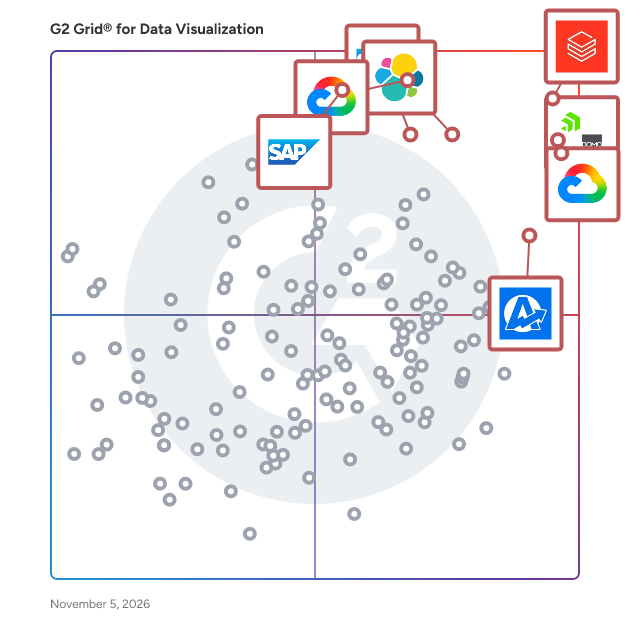
G2 Grid® for Data Visualization Tools

G2 Grid® for Data Visualization Tools plotting products by satisfaction and market presence

Highlighted products: Databricks, Domo, Looker, Data Studio, Elastic Stack, AgencyAnalytics, SAP HANA Cloud, and SAP Analytics Cloud.

Underlying data: [Grid® JSON](https://www.g2.com/categories/data-visualization-tools/grids.json?focus%5B%5D=databricks&focus%5B%5D=domo&focus%5B%5D=looker&focus%5B%5D=data-studio&focus%5B%5D=elastic-stack&focus%5B%5D=agencyanalytics&focus%5B%5D=sap-hana-cloud-2025-10-01&focus%5B%5D=sap-analytics-cloud&segment=all)

Quirkos

Quirkos helps researchers explore qualitative text: managing sources, tagging and coding, and developing frameworks to understand connections in their projects. Bring in text from transcripts, documents, PDFs, websites and on-line surveys, and explore them all in one place. Live visualizations keep users close to the data, and show trends as they emerge. An easy-to-use interface increases coding speed, and allows users to get going fast. Flexible and visual reports allow findings to be shared in creative and accessible ways, including Word and PDF export.

Average Rating: 4.8/5.0

Total Reviews: 2

Who Is the Company Behind Quirkos?

Who Uses This Product?

  • Company Size: 100% Small

What Are Recent G2 Reviews of Quirkos?

What Are G2 Users Discussing About Quirkos?

R++

Who Is the Company Behind R++?

  • Seller: R++
  • Year Founded: 2016
  • HQ Location: Toulouse, FR
  • LinkedIn® Page: www.linkedin.com
    7 employees on LinkedIn®

AI can help you find the answers. G2 helps you trust them.

Connect G2 to Claude or ChatGPT for answers grounded in G2's trusted reviews, comparisons, and pricing from real user insights.

How it works

RasXP

Rasello is a cloud enterprise software solutions company with Software as a Service (SaaS) and Platform as a Service (PaaS).

Who Is the Company Behind RasXP?

  • Seller: Rasello
  • Year Founded: 2011
  • HQ Location: Masaki, TZ
  • LinkedIn® Page: www.linkedin.com
    15 employees on LinkedIn®

RateInfo

Digital Rate Display is an all-in-one cloud-based SaaS platform designed to automate and elevate how financial institutions, foreign exchange centers, hotels, retail stores, and businesses present live currency exchange rates, interest rates, and financial metrics across digital screens. By replacing traditional static boards and manual updating processes, Digital Rate Display enables businesses to stream accurate, real-time rate changes effortlessly across multiple screens, branches, and physical locations from a single centralized dashboard.

Who Is the Company Behind RateInfo?

RATH

Automated data exploratory analysis and visualization tools. RATH is beyond an open-source alternative to Data Analysis and Visualization tools such as Tableau. It automates your Exploratory Data Analysis workflow with an Augmented Analytic engine by discovering patterns, insights, causals and presents those insights with powerful auto-generated multi-dimensional data visualization.

Average Rating: 4.0/5.0

Total Reviews: 1

Who Is the Company Behind RATH?

Who Uses This Product?

  • Company Size: 100% Small

What Are Recent G2 Reviews of RATH?

Reeport

Reeport helps building smart data reports and share them through Excel, Power Point, PDF and more.

Average Rating: 5.0/5.0

Total Reviews: 1

How Do G2 Users Rate Reeport?

  • Has the product been a good partner in doing business?: 10.0/10 (Category avg: 9.0/10)

Who Is the Company Behind Reeport?

Who Uses This Product?

  • Company Size: 100% Large

What Are Recent G2 Reviews of Reeport?

What Are G2 Users Discussing About Reeport?

RentViewer Asset Management Studio for Real Estate

RentViewer is a portfolio reporting platform built for multifamily and manufactured housing owner-operators. RentViewer connects to your property management system - Yardi, AppFolio, Entrata, or Rent Manager - and automatically delivers the dashboards and reports your asset management team needs to run a better portfolio. Many owner-operators managing 2,000 to 20,000 units are stuck in the same place: analysts spending hours rebuilding the same Excel reports every week, leadership reviewing data that's already out of date. RentViewer replaces that process with up-to-date, accurate data in one place - without requiring your team to touch a spreadsheet. Asset Management Studio is our flagship product. It gives your analysts a complete data foundation - occupancy trends, budget vs. actual, leasing performance, and more - all connected to your property management system. Most customers are fully up and running within 30 days. RentViewer is built for owner-operators with a dedicated reporting team and recurring KPI review meetings. If that's your company, we're probably a strong fit. If not, we'll tell you that upfront.

Who Is the Company Behind RentViewer Asset Management Studio for Real Estate?

  • Seller: RentViewer
  • Year Founded: 2018
  • HQ Location: Rochester Hills, US
  • LinkedIn® Page: www.linkedin.com
    3 employees on LinkedIn®

Reochart

Reochart is a web-based animated chart maker that turns raw data into polished, motion-driven visuals in under two minutes. Paste your numbers, pick from 30+ chart types, customize the design, and export as MP4, GIF, PNG, or SVG for presentations, social media posts, investor updates, newsletters, and reports. Most chart tools produce static images. Reochart animates every chart by default. Bar charts climb into place, waterfall charts step through each driver one by one, funnels narrow stage by stage, timelines animate milestones onto the line, and number counters count up to a final value. The result is a visual that holds attention in a LinkedIn feed, a live pitch, or a board deck in a way a static spreadsheet screenshot does not. The chart library covers the formats founders, marketers, consultants, and analysts actually need: bar, line, area, donut, funnel, waterfall, timeline, roadmap, 2x2 matrix, Sankey diagram, KPI scorecard, number counter, bullet chart, lollipop chart, grouped and stacked bar charts, diverging bar charts, bar chart races, pictograms, highlight tables, and more. Each chart type is purpose-built for a specific kind of story rather than a single generic engine stretched across everything. Data entry works directly in the browser. Paste from Excel or Google Sheets, edit in a built-in spreadsheet grid, or use preloaded sample data to explore a chart type before entering your own numbers. Every chart comes with a live preview that updates as you edit, so you see exactly what you are getting before you export. Design customization includes 15+ color themes across light, dark, and seasonal palettes, plus a brand kit where Pro users can upload a custom logo and set brand colors that override the default palette. Export formats cover every common destination: MP4 for presentations and social feeds, GIF for email and Slack, PNG for print and documents, SVG for any screen. Reochart also includes a library of 1,750+ animated icons with 12 animation styles, exportable in the same formats as charts. Icons are free on every plan with no usage limits. The product is built for speed and simplicity. There is no design learning curve, no blank canvas, and no video editing software required. The entire workflow from opening the editor to downloading a finished animated chart takes about two minutes. Reochart offers a free plan with 3 exports per month and a Pro plan starting at $8 per month that removes the watermark, unlocks unlimited exports, and enables brand kit features.

Who Is the Company Behind Reochart?

Reportabl.io

Reportabl is a Cloud based data platform and reporting solution for Small to Medium sized organisation. We specialise in data and reporting for Health, Accounting and Sports Organisations.

Who Is the Company Behind Reportabl.io?

Report AI 365

Report AI 365 is AI reporting software that turns plain-English questions into verified, branded reports from your Microsoft business data. Finance, sales and operations teams often wait days for reports, and most companies have no BI analyst to build them. With Report AI 365, anyone on the team can ask a question the way they would ask a colleague and receive a finished report built from live data. Key features: • Plain-English questions, with a short clarifying question when something is ambiguous • Verified numbers: figures are calculated in code and checked against the source; anything that cannot be confirmed is withheld and explained • Finished reports with KPI cards, tables, charts and an AI summary, saved and refreshed on demand • Branded PDF export and print, with your logo and colours • Business context: teach it your own terms and definitions once • Connectors: Dynamics 365 Business Central, Power BI, SQL Server, Analysis Services (OLAP cubes), Excel and REST APIs Security: read-only connections, your existing permissions apply, credentials are stored encrypted, two-step sign-in, and your data is never used to train AI models. Built for finance, sales and operations teams at small and mid-sized companies.

Who Is the Company Behind Report AI 365?

ReportDash

ReportDash is a comprehensive, no-code platform designed to streamline marketing data management by integrating over 60 marketing platforms into a unified hub. It enables users to effortlessly connect data sources, create custom reports and dashboards, and export data to tools like Looker Studio and Google Sheets. With ReportDash, marketers can build their first report in minutes, breaking free from data silos and gaining real-time insights to optimize campaign performance and boost ROI. Key Features and Functionality: - Data Integration: Connects with over 60 marketing platforms, including Google Ads, Facebook, LinkedIn, TikTok, X (Twitter), Google Analytics, and Shopify, providing a centralized view of all marketing efforts. - Customizable Dashboards and Reports: Offers intuitive features and customizable templates, allowing users to create interactive dashboards and reports tailored to their unique objectives. - Data Blending: Enables users to combine complex datasets across various sources within minutes, facilitating comprehensive cross-channel analysis without the need for coding skills. - Automated Reporting: Allows scheduling and automation of report updates, ensuring data refreshes in real-time without manual intervention. - Secure Data Storage: Provides reliable data pipelines and warehouses, ensuring data is securely stored and readily accessible for analysis. Primary Value and User Solutions: ReportDash addresses the challenges marketers face in managing and analyzing data from multiple platforms. By consolidating data into a single, user-friendly interface, it eliminates the need for manual data pulls and complex integrations. This empowers users to focus on strategic decision-making, optimize marketing spend, and improve campaign ROI with data-driven insights. Additionally, its scalability and ease of use make it suitable for businesses of all sizes, from solo marketers to large enterprises.

Average Rating: 4.4/5.0

Total Reviews: 12

How Do G2 Users Rate ReportDash?

  • Has the product been a good partner in doing business?: 9.3/10 (Category avg: 9.0/10)

Who Is the Company Behind ReportDash?

Who Uses This Product?

  • Company Size: 42% Medium, 33% Small

What Do G2 Reviewers Say About ReportDash?

AI-generated summary from verified user reviews

Pros
  • Users value the effective analytics from ReportDash, enabling quick and thorough data analysis for clients.
  • Users highlight the effective reporting capabilities of ReportDash, enabling efficient and thorough data analysis for clients.
  • Users find ReportDash's reporting features effective for swift and thorough data analysis for clients.
Cons
  • Users experience a steep learning curve with ReportDash, making it harder for new users to adapt quickly.

What Are Recent G2 Reviews of ReportDash?

What Are G2 Users Discussing About ReportDash?

Bijou Barry
BB
Researched and written by Bijou Barry
Updated June 24, 2026