Best Data Visualization Tools - Page 28

How Many Data Visualization Tools Products Does G2 Track?

Total Products under this Category: 762

Category Stats (Nov 2026)

  • Average Rating: 4.44/5 The average rating of products in this category, based on all submitted ratings
  • Top Trending Product: Upsolve AI (+1.75%) - Among all products in this category, Upsolve AI recorded the largest rating increase compared to last month

Last updated: November 01, 2026

How Does G2 Rank Data Visualization Tools Products?

Why You Can Trust G2's Software Rankings:

  • 30 Analysts and Data Experts
  • 22,900+ Authentic Reviews
  • 762+ Products
  • Unbiased Rankings

G2's software rankings are built on verified user reviews, rigorous moderation, and a consistent research methodology maintained by a team of analysts and data experts. Each product is measured using the same transparent criteria, with no paid placement or vendor influence. While reviews reflect real user experiences, which can be subjective, they offer valuable insight into how software performs in the hands of professionals. Together, these inputs power the G2 Score, a standardized way to compare tools within every category.

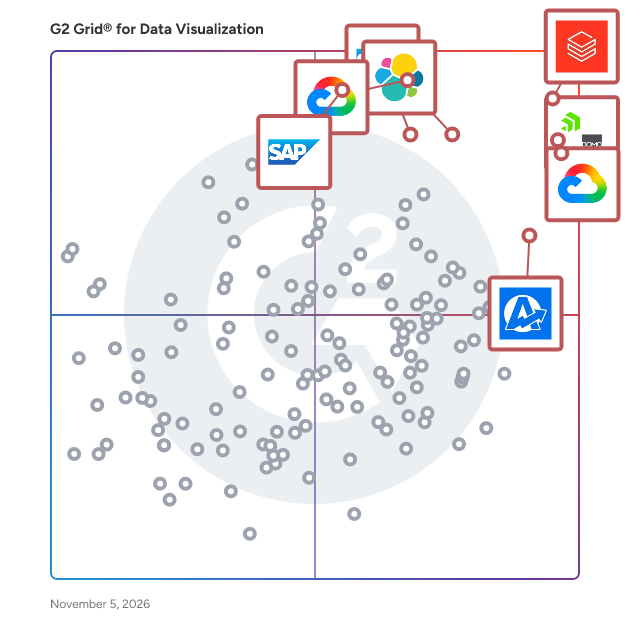
G2 Grid® for Data Visualization Tools

G2 Grid® for Data Visualization Tools plotting products by satisfaction and market presence

Highlighted products: Databricks, Domo, Looker, Data Studio, Elastic Stack, AgencyAnalytics, SAP HANA Cloud, and SAP Analytics Cloud.

Underlying data: [Grid® JSON](https://www.g2.com/categories/data-visualization-tools/grids.json?focus%5B%5D=databricks&focus%5B%5D=domo&focus%5B%5D=looker&focus%5B%5D=data-studio&focus%5B%5D=elastic-stack&focus%5B%5D=agencyanalytics&focus%5B%5D=sap-hana-cloud-2025-10-01&focus%5B%5D=sap-analytics-cloud&segment=all)

BizView

VSquare enables complete data protection, disaster recovery and business continuity for VMware and Hyper-V.

Who Is the Company Behind BizView?

Bold Metrics

Bold Metrics is the leading AI solution for apparel retailers and brands looking to boost conversion, reduce returns and elevate the retail experience around sizing. Bold Metrics technology enables brands to build a scalable library of shopper digital twins, unlocking the power of body data to meet the demands of today's increasingly personalized world by empowering data-led technical design while improving sustainability efforts. Bold Metrics partners with apparel brands and retailers to focus on improving their consumer’s online shopping experience, driving eCommerce sales, minimizing returns, and establishing their credibility as environmentally responsible companies. Bold Metrics’ product suite offers accurate, scalable solutions that are easily integrated and tailored to fit the needs of any brand. What sets Bold Metrics apart as a leading AI solution provider for the apparel retail industry Tailor-accurate body measurement predictions: Bold Metrics has spent years building and training detailed machine learning models for predicting body measurements at a high level of accuracy without requiring the customer to measure themselves or take photos of their bodies while wearing tight-fitted clothing. Customers complete a simple survey to get accurate size recommendations based on individual fit preferences. Providing detailed information on how a garment fits: While providing a size recommendation alone is helpful to shoppers, understanding where the garment is loose or tight on their body gives the customer the chance to make their final sizing decision based on their unique fit preference. Actionable data for brands and retailers: For the first time, apparel brands and retailers can know the body measurements of their actual shoppers. This data can be leveraged to change how brands make their clothes (moving from assumption-based to data-based design), provide key supply chain optimizations, and improve other business areas where this data provides valuable insights. Low-friction onboarding/integration: By providing products through both an API (Virtual Tailor + Sizer) and a Javascript snippet (Smart Size Chart), Bold Metrics can easily integrate onto a myriad of eCommerce platforms and apps requiring limited resources from the client. Bold Metrics Products Virtual Tailor The gold standard for algorithmic body measurement prediction. Trusted by custom clothiers worldwide, the Virtual Tailor is proven to predict over 50 body measurements at a similar level of accuracy to a Master Tailor, with no measuring tape required. Harnessing our proprietary machine learning models to accurately predict body measurements without requiring your customer to take photographs of themselves in tight-fitted clothing. Customers answer four to six simple questions (no measuring tape required), and the Virtual Tailor API returns over fifty body measurements in under 500ms. Why use Virtual Tailor? Accuracy – the Virtual Tailor has been proven to be the most accurate solution on the market in countless studies. Easy to Integrate – our API works with every platform, from Hybris Demandware and Magento to Shopify; your developer will love how easy it is to get started with the Virtual Tailor. Scalable – from 100 to 1 billion monthly predictions; like all our products, the Virtual Tailor was built for scale. White-label experience – no branding requirements, completely seamless integration with your site’s look and feel. Virtual Sizer The fit backbone, solving fit at scale. Meet the Virtual Sizer, our flagship solution that powers fit at some of the largest brands in the world. Gone are the days of recommending the same size in every style; with the Virtual Sizer, you can help shoppers find the right size in the right style based on their unique fit preference. Why use Virtual Sizer? Tailored To Fit - Size can vary by style. Two different styles of jeans can have two different fits, which means two different sizes for some shoppers. Only the Virtual Sizer can help your shoppers find the right size and style based on their unique fit preferences. Sizing made personal - The Virtual Sizer provides detailed information about where garments are loose and tight across the body so your customer can choose a size based on how they like clothes to fit. Customized Recommendations - Leverage purchase and returns data to constantly update recommendations based on your shopper’s behavior and the impact different fits and fabrics have on sizing decisions. Proven Results - The Virtual Sizer is proven to increase conversion rates and decrease return rates. Proven results with clients see an average return rate reduction of 32%, making Bold Metrics a top choice for apparel brands championing sustainability. Smart Size Chart We’re all different, so it’s no surprise that we all like things to fit differently. Go beyond simple size recommendations and allow shoppers to visually see where clothes are tight and loose on their bodies so they can decide based on their unique fit preference. For example, a size 6 shirt might fit a customer best across all garment dimensions but may be tight around the stomach area. Some customers might be okay with this, others might want to see how the next size up fits; the Smart Size Chart makes this possible at the touch of a button. Why use a Smart Size Chart? Accurately predict over 50 body measurements and map to your specific garment data and relevant points of measure. Allow your shoppers to compare different sizes and pick their best fit based on personal fit preferences. Just four to six simple inputs are required (none that need a measuring tape). Easy to add to any existing eCommerce experience by simply copying and pasting a snippet of code. Contactless Fit Contactless Fit™ replicates the fitting room experience so customers can try on one size, then another, compare, and pick what fits them best according to personal fit and style preferences. Your dressing room just went digital. Along with recommending a size, Contactless Fit™ also replicates the fitting room experience, allowing customers to understand how different sizes would fit on their bodies without the need for physical try-on. Why use Contactless Fit? Give your customers an easy way to compare sizes and pick what fits them best based on their unique fit preferences. Contactless Fit™ gives tailor-level accuracy without photos. Four to six simple inputs are required (none needing a measuring tape). Give your in-store staff the tools they need to complement their expertise and allow them to provide a great experience around fit and sizing. iPads, touchscreen displays, robots - it’s all compatible with Contactless Fit™, so you can get started immediately without buying new hardware. Introducing a stand-alone point-of-sale solution with quick and easy scalable deployment to provide your customers with an end-to-end fit experience.

Who Is the Company Behind Bold Metrics?

BrandMap® 9

BrandMap® 9 is a market reserach software that calculates and graphically displays the attribute changes necessary for brand (column) re-positioning to any point on a map.

Who Is the Company Behind BrandMap® 9?

AI can help you find the answers. G2 helps you trust them.

Connect G2 to Claude or ChatGPT for answers grounded in G2's trusted reviews, comparisons, and pricing from real user insights.

How it works

Business Charts for SharePoint Online

## Product Description Business Charts for SharePoint Online by BoostSolutions is a no-code SPFx web part that transforms SharePoint list data into interactive, real-time charts and visual dashboards. Without leaving Microsoft 365, users can select a data source, configure categories, values, and series, and publish charts to SharePoint pages. Charts update automatically when the underlying data changes. The product supports more than 10 chart types, including bar, column, line, pie, doughnut, area, radar, polar area, bubble, scatter, and combination charts. Users can summarize and analyze SharePoint data with automatic sum, average, count, maximum, and minimum calculations, as well as grouping by date or category. Dual Y-axes and multi-metric combination charts allow users to compare data with different units of measurement in a single view. The product also supports consolidating data from multiple lists within a site collection into a single chart. Business Charts automatically inherits SharePoint site themes, supports light and high-contrast dark modes, and allows users to customize chart appearance. Charts can be exported as high-quality images for presentations, reports, or internal emails. They can also be added to Microsoft Teams channels and tabs, allowing teams to view real-time data dashboards directly within Teams. Built on the SPFx framework, the product processes all data in the user’s browser. Data remains within the Microsoft 365 tenant, is not stored on external servers, and follows existing SharePoint and Microsoft 365 permission models. A 30-day, fully functional free trial allows users to test the product and build dashboards using their own SharePoint data.

Who Is the Company Behind Business Charts for SharePoint Online?

C1 by Thesys

We’re building the UI for AI. At Thesys we have built C1, the first production-ready Generative UI API. It lets AI products respond with fully interactive UI in real time. With C1, instead of plain-text answers, agents deliver dashboards, forms, lists, and other rich interfaces that adapt to each query and context. Most AI products still rely on text, which hurts engagement, or teams spend countless hours wiring LLM output to brittle UI templates. Doing this manually is slow to build, hard to maintain, and impossible to scale. C1 changes that. We work with fast-moving startups and large enterprises to power copilots, internal tools, and assistants with intelligent generative interfaces.

Who Is the Company Behind C1 by Thesys?

Canmetry

Online CAN / CAN FD log viewer for diagnostics, validation and calibration engineers at automotive OEMs, suppliers, and diagnostics labs (B2B engineering teams, not a consumer product). Open BLF, MF4, ASC, CSV or candump, map DBC per channel, filter frames, plot signals, export CSV—parsing in a Web Worker on the machine. Alternative to desktop CANoe seat licenses for B2B engineering teams. Pricing: Free (core local viewer).

Who Is the Company Behind Canmetry?

CanvasJS Charts

CanvasJS Charts is an HTML5 Charting library that runs across devices and browsers and has 10x Performance Compared to traditional SVG charting Libraries. This allows you to create rich dashboards that work across devices without compromising on maintainability or functionality of your web application.

Average Rating: 4.6/5.0

Total Reviews: 18

How Do G2 Users Rate CanvasJS Charts?

  • Has the product been a good partner in doing business?: 10.0/10 (Category avg: 9.0/10)

Who Is the Company Behind CanvasJS Charts?

Who Uses This Product?

  • Company Size: 61% Small, 22% Medium

What Are Recent G2 Reviews of CanvasJS Charts?

What Are G2 Users Discussing About CanvasJS Charts?

CarMaker

CarMaker - the simulation software for virtual test driving of passenger cars and light-duty vehicles. Experience it now!

Average Rating: 4.7/5.0

Total Reviews: 3

Who Is the Company Behind CarMaker?

  • Seller: CarMaker
  • Year Founded: 1984
  • HQ Location: Karlsruhe, DE
  • LinkedIn® Page: www.linkedin.com
    339 employees on LinkedIn®

Who Uses This Product?

  • Company Size: 67% Medium, 33% Small

What Are Recent G2 Reviews of CarMaker?

What Are G2 Users Discussing About CarMaker?

Cedo

Who Is the Company Behind Cedo?

  • Seller: Cedo
  • Year Founded: 2024
  • HQ Location: N/A
  • LinkedIn® Page: www.linkedin.com
    2 employees on LinkedIn®

Centrik-ai

Centrik es inteligencia operativa para grupos de hostelería multi-local. Si diriges operaciones, conoces el lunes: cuadrar los Excel de cada local, buscar el dato que falta y explicar por qué un local se ha movido. Centrik reúne esos datos en un solo sitio y te dice qué mirar primero. Qué hace: Sube los datos y documentos que ya usas (Excel, CSV y PDF). No sustituye tu TPV ni tus herramientas actuales. Una pantalla de inicio con lo que merece atención: ventas frente al objetivo, coste laboral, valoración y productividad de cada local, comparados con el mismo mes del año anterior. Cada aviso dice con qué datos se ha calculado y qué límites tiene. Paneles por área: finanzas, personal, producto, clientes y reservas, filtrables por local y por periodo. Un Copiloto que responde con los datos y documentos de tu empresa. Si los datos no bastan para explicar algo, no se lo inventa: te dice qué dato falta. Cuando responde desde un documento, cita el documento y la página. Para quién: directores de operaciones, gerentes y equipos de control de grupos de restaurantes, bares y cafeterías con varios locales. De cero a operativo en menos de una semana, sin migrar sistemas. Tu información es tuya: cada empresa ve solo la suya.

Who Is the Company Behind Centrik-ai?

  • Seller: Centrik
  • Year Founded: 2026
  • HQ Location: MADRID, ES
  • LinkedIn® Page: www.linkedin.com
    1 employees on LinkedIn®

ChaosSearch Data Lake Platform

ChaosSearch helps modern organizations Know Better™ by activating the data lake for analytics. The ChaosSearch Data Lake Platform indexes customers’ cloud data, rendering it fully searchable and enabling analytics at scale with massive reductions of time, cost and complexity. ChaosSearch was purpose-built for cost-effective, highly scalable analytics encompassing full text search, SQL and machine learning capabilities in one unified offering. The patented ChaosSearch technology instantly transforms your cloud object storage (Amazon S3, Google Cloud Storage) into a hot, analytical data lake. Whereas other solutions require dedicated data scientists, engineers and DBAs to manage complex data pipelines and massive ETL data movement between siloed databases, ChaosSearch indexes all data as-is, while auto-detecting native schemas and optimizing for both data size and performance. ChaosSearch reduces data prep time from weeks to minutes through virtual views, presented to data consumers via open APIs (Search, SQL, ML) with full governance and role-based access controls. Users continue working in the tools they know and trust, such as Kibana, Looker, and Tableau. With its revolutionary approach delivered in a fully managed service, ChaosSearch overcomes the cost and complexity of competitive solutions, delivering unlimited scalability, industry-leading resiliency, and massive time and cost savings. Based on these capabilities, ChaosSearch is an ideal replacement for the commonly deployed Elasticsearch (ELK) stack. With ChaosSearch, customers can perform scalable log analytics on AWS S3 or GCS, using the familiar Elasticsearch API for queries, and Kibana for log analytics and visualizations, while reducing costs and improving analytical capabilities.

Average Rating: 4.8/5.0

Total Reviews: 2

Who Is the Company Behind ChaosSearch Data Lake Platform?

Who Uses This Product?

  • Company Size: 50% Small, 50% Large

What Are Recent G2 Reviews of ChaosSearch Data Lake Platform?

What Are G2 Users Discussing About ChaosSearch Data Lake Platform?

Chartbrew

Chartbrew is an open-source web application that can connect directly to databases and APIs and use the data to create beautiful charts. It features a chart builder, editable dashboards, embeddable charts, query & requests editor, and team capabilities. Chartbrew can be self-hosted for free or used as a managed service at chartbrew.com. Charbrew integrations (head over to the website for an up-to-date list) MySQL, PostgreSQL, MongoDB, Firestore, Firebase Realtime Database, Custom REST API, Google Analytics GA4, Customer.io, Strapi, Supabase, and more. Some of Chartbrew's features - Reports branding and white-labeling - Templates support - choose from ones already created for you or even create your own to re-use across your dashboards - Auto-update schedule for your dashboards - Email, Webhook, and Slack alerts with custom triggers - Data anomaly detection - Chart embedding - Shareable reports - Data filters at dashboard-level or chart level - Public data filters - available to viewers - Excel and PDF exports - Granular permissions for your team and clients

Who Is the Company Behind Chartbrew?

Bijou Barry
BB
Researched and written by Bijou Barry
Updated June 24, 2026