Best Data Visualization Tools - Page 19

How Many Data Visualization Tools Products Does G2 Track?

Total Products under this Category: 762

Category Stats (Nov 2026)

  • Average Rating: 4.44/5 The average rating of products in this category, based on all submitted ratings
  • Top Trending Product: Upsolve AI (+1.75%) - Among all products in this category, Upsolve AI recorded the largest rating increase compared to last month

Last updated: November 01, 2026

How Does G2 Rank Data Visualization Tools Products?

Why You Can Trust G2's Software Rankings:

  • 30 Analysts and Data Experts
  • 22,900+ Authentic Reviews
  • 762+ Products
  • Unbiased Rankings

G2's software rankings are built on verified user reviews, rigorous moderation, and a consistent research methodology maintained by a team of analysts and data experts. Each product is measured using the same transparent criteria, with no paid placement or vendor influence. While reviews reflect real user experiences, which can be subjective, they offer valuable insight into how software performs in the hands of professionals. Together, these inputs power the G2 Score, a standardized way to compare tools within every category.

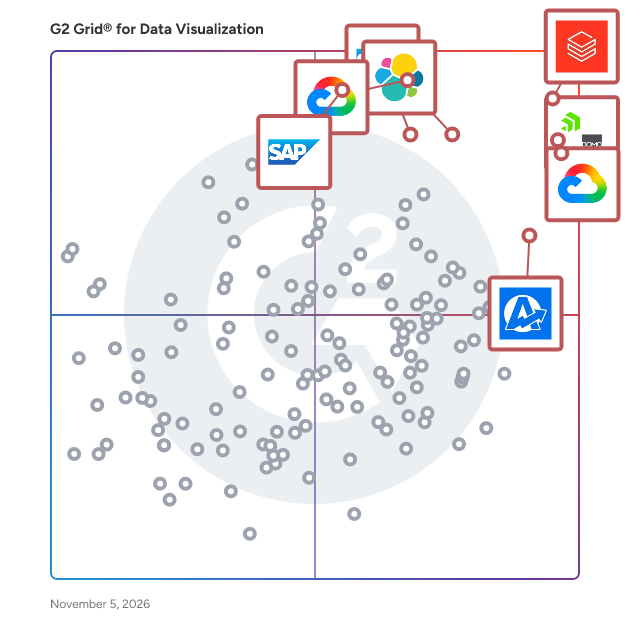
G2 Grid® for Data Visualization Tools

G2 Grid® for Data Visualization Tools plotting products by satisfaction and market presence

Highlighted products: Databricks, Domo, Looker, Data Studio, Elastic Stack, AgencyAnalytics, SAP HANA Cloud, and SAP Analytics Cloud.

Underlying data: [Grid® JSON](https://www.g2.com/categories/data-visualization-tools/grids.json?focus%5B%5D=databricks&focus%5B%5D=domo&focus%5B%5D=looker&focus%5B%5D=data-studio&focus%5B%5D=elastic-stack&focus%5B%5D=agencyanalytics&focus%5B%5D=sap-hana-cloud-2025-10-01&focus%5B%5D=sap-analytics-cloud&segment=all)

Reporting Ninja

Reporting Ninja is a marketing reporting platform for the AI era: every channel in one place, reports built by AI, by you, or straight from Claude and ChatGPT, and delivered client-ready: branded, on schedule, by email, link or client portal. CONNECT. All your marketing data in one place: Google Ads, Meta Ads, GA4, TikTok, LinkedIn Ads, Microsoft Ads, Search Console, Shopify, Mailchimp and 30+ integrations in total. One maintained connection instead of a dozen fragile ones. Every number comes straight from the source API, so nothing is invented. The same data is available in Data Studio, Google Sheets, the REST API and the AI connector (MCP). BUILD. Start from a catalog of 30+ maintained report templates, drag and drop widgets in the report editor, or let AI do it: describe the report you need and the AI Builder drafts it, an AI Widget turns a sentence into a chart, and AI Summaries write the commentary. Working in Claude or ChatGPT? Ask for the data, explore it there, and push the result to Reporting Ninja: it lands as a real report, branded, scheduled and ready to send. Nothing is created until you say so. DELIVER. Set up your brand template once and it applies to every PDF, share link and client portal. Schedule delivery by email, share a live link, or give each client their own portal. Alerts and a weekly digest tell you when a metric moves. Built for agencies, freelancers and in-house marketing teams, from their first client to hundreds of accounts. Everything is included on every plan, from $20/month, with a free 15-day trial.

Average Rating: 5.0/5.0

Total Reviews: 2

How Do G2 Users Rate Reporting Ninja?

  • Has the product been a good partner in doing business?: 10.0/10 (Category avg: 9.0/10)
  • Dashboards: 10.0/10 (Category avg: 9.0/10)
  • Steps to Answer: 8.3/10 (Category avg: 8.6/10)
  • Formats: 8.3/10 (Category avg: 8.6/10)

Who Is the Company Behind Reporting Ninja?

Who Uses This Product?

  • Company Size: 50% Large, 50% Medium

What Are Recent G2 Reviews of Reporting Ninja?

Simcenter Compose

Simcenter™ Compose™ software is a comprehensive environment designed for mathematical computations, data manipulation, visualization, programming, and script debugging. It enables users to perform a wide array of mathematical operations, including linear algebra, matrix manipulations, statistics, differential equations, signal processing, control systems, polynomial fitting, and optimization. With its integrated development environment , Simcenter Compose facilitates the development and automation of algorithms, streamlining repeated computations and processes. Additionally, it offers native support for Computer-Aided Engineering and test result data, enhancing system understanding and supporting model-based development for multi-domain simulations. Key Features: - Numerical Computing: Provides hundreds of powerful mathematical operations and built-in functions for calculations ranging from simple to complex. - Rapid Algorithm Development: Allows users to explore multiple approaches and find solutions faster than with spreadsheets or traditional programming languages like C/C++. - Multi-language Math Environment: Based on the Open Matrix Language and compatible with Octave and Python, offering flexibility in programming. - Process Automation and Scripting: Facilitates the automation of repeated calculations and streamlining of common processes, with useful debugging capabilities. - Plotting and Visualization: Offers 2D and 3D plotting tools to provide richer insights from calculations and data. - Built-in CAE Data Readers: Enables easy import, visualization, and manipulation of data from physical testing and CAE applications like FEA, CFD, electromagnetics, and multibody dynamics. Primary Value and User Solutions: Simcenter Compose empowers engineers, scientists, and product developers to make informed decisions by performing essential engineering calculations based on first principles. Its all-in-one, user-friendly IDE eliminates the need for additional toolboxes, making it a cost-effective solution. The software's accessibility, either as a standalone tool or integrated with other Simcenter products, ensures flexibility and scalability. By automating processes and providing comprehensive data analysis and visualization tools, Simcenter Compose enhances productivity and accelerates the development of algorithms and models.

Average Rating: 4.5/5.0

Total Reviews: 2

How Do G2 Users Rate Simcenter Compose?

  • Dashboards: 9.2/10 (Category avg: 9.0/10)
  • Steps to Answer: 10.0/10 (Category avg: 8.6/10)

Who Is the Company Behind Simcenter Compose?

Who Uses This Product?

  • Company Size: 50% Small, 50% Medium

What Are Recent G2 Reviews of Simcenter Compose?

SimpleKPI

SimpleKPI is KPI software for businesses that want to track performance without a data team. Collect your numbers from spreadsheets, integrations, the API or simple manual entry, then see where every KPI stands against target on live dashboards. KPI Insights explains what changed and why, with trends, anomalies, likely causes and forecasts, and scheduled reports send the results to the people who need them. The built-in AI sets up KPIs, builds dashboards and reports, and answers questions about your data in plain English, with no AI credits to buy. SimpleKPI has been building KPI software since 2007 and is used by more than 1,000 companies in 90 countries. One flat price covers unlimited users, dashboards and reports, so the whole team can see the numbers.

Average Rating: 4.8/5.0

Total Reviews: 2

How Do G2 Users Rate SimpleKPI?

  • Has the product been a good partner in doing business?: 8.3/10 (Category avg: 9.0/10)

Who Is the Company Behind SimpleKPI?

Who Uses This Product?

  • Company Size: 100% Small

What Are Recent G2 Reviews of SimpleKPI?

What Are G2 Users Discussing About SimpleKPI?

AI can help you find the answers. G2 helps you trust them.

Connect G2 to Claude or ChatGPT for answers grounded in G2's trusted reviews, comparisons, and pricing from real user insights.

How it works

SiteLantern

We track every aspect of the business, across any device, across any system, in real-time, so you can monitor your business in greater detail than ever before. Know what's working, and correct what's not.

Average Rating: 4.5/5.0

Total Reviews: 2

How Do G2 Users Rate SiteLantern?

  • Dashboards: 9.2/10 (Category avg: 9.0/10)
  • Steps to Answer: 10.0/10 (Category avg: 8.6/10)
  • Formats: 7.5/10 (Category avg: 8.6/10)

Who Is the Company Behind SiteLantern?

Who Uses This Product?

  • Company Size: 50% Small, 50% Medium

What Are Recent G2 Reviews of SiteLantern?

Sloped

Enable effortless data exploration and analysis. Leverage our built-in integrations or employ custom APIs. Either way your next key insight is simply a search query away.

Average Rating: 5.0/5.0

Total Reviews: 2

How Do G2 Users Rate Sloped?

  • Has the product been a good partner in doing business?: 10.0/10 (Category avg: 9.0/10)

Who Is the Company Behind Sloped?

Who Uses This Product?

  • Company Size: 50% Large, 50% Small

What Do G2 Reviewers Say About Sloped?

AI-generated summary from verified user reviews

Pros
  • Users value the customization options in Sloped, improving their experience and enhancing efficiency across projects.
  • Users find Sloped to be a time-saving and easy-to-use tool that boosts team efficiency in task management.
  • Users value the easy integrations of Sloped, enhancing team collaboration and improving efficiency across projects.
  • Users value the efficiency of Sloped, as it saves time and enhances collaboration on projects.
  • Users value the customization options of Sloped, which enhance their overall user experience and satisfaction.
Cons
  • Users face access issues with Sloped software, requiring a reliable internet connection and time to learn functionalities.
  • Users may find the learning difficulty challenging, requiring time to adapt to Sloped's features and functionalities.

What Are Recent G2 Reviews of Sloped?

Smartbi

Most small businesses don't need another dashboard. They need to know what their numbers mean and what to do next. SmartBI is built around SMARTY, our new AI copilot. Connect GA4, Google Ads, Meta Ads, Facebook, Instagram, Google Business Profile and more. Then tell SMARTY about your business, and it turns your data into clear, actionable recommendations in English or French. SmartBI is more than charts. SMARTY helps you understand what’s happening, why it matters and what to do next. Start free forever with Google Business Profile, no credit card required, or try any paid plan free for 14 days.

Average Rating: 4.0/5.0

Total Reviews: 2

How Do G2 Users Rate Smartbi?

  • Dashboards: 6.7/10 (Category avg: 9.0/10)
  • Steps to Answer: 9.2/10 (Category avg: 8.6/10)
  • Formats: 5.8/10 (Category avg: 8.6/10)

Who Is the Company Behind Smartbi?

Who Uses This Product?

  • Company Size: 100% Medium

What Are Recent G2 Reviews of Smartbi?

TikeanDQ

Tikean provides the best practices to execute your daily operations, ensure smooth business processes and minimal manual data maintenance effort. Ideally, you will get an instant view of all domain/dimension data and its quality status within your ecosystem in just one glance. For example, TikeanDB plugs into SAP organization structures by default and easily provides quality control over global and local data elements (a must-have e.g., for the manufacturing industry to speed up, and ensure the supply process flows!) High-level features contain: 1. Data modelling and Ingestion Dynamic data modelling makes it easy to provision any data domain and source to TikeanDQ. Rich feature set supports merging data from multiple origins and legacy systems into domain views. 2. Fine grained access control Tikean supports commonly used corporate authentication methods and standards. Control data visibility according to corporate policies. 3. Reporting and dashboards Create and maintain meaningful reports, share and distribute with selected audiences. Provide visual insights for fast decision making on corporate functions. 4. Requlatory compliance Meet the compliance requirements with trusted data analysis and insights. Validate the corporate data asset accuracy and timeliness for e.g. GDPR regulation capability. 5. Business rule wizard​ Dynamic data modelling makes it easy to provision any data domain and source to TikeanDQ. Rich feature set supports merging data from multiple origins and legacy systems into domain views. 6. Superfast data views Superfast data queries with no technical skills needed. Combine data from multiple origins into shareable and re-usable views. 7. Reference data Maintain and distribute corporate reference data throughout the corporate functions, using Tikean Reference Data solution (separate subscription module). 8. No-code, logical rule editor Yess, you can make the needed data modelling and configuration without a single line of code. This means that you don't need a coder to assign the rules. Also, the changes can be run immediately. 9. Powerful data validation Set business rules to provide continuous corporate data quality details and metrics. Ingest and validate also temporary (e.g. migration) data sources against corporate data rules. 10. Smooth user experience The intuitive and easy-to-use interface promotes easy system adaptation and use in multiple audiences, including the Business people. 11. Data quality ownership Deploy and Maintain Data Governance specific ownerships to your data assets. Subscribe selected datasets and error reports for the respective stakeholders. 12. Cloud optimized Responsibility from both the costing and environment point-of-view. When ever resources are needed, the solution reserves them and when not, the solution releases them, enabling power and cost savings.

Average Rating: 4.3/5.0

Total Reviews: 2

How Do G2 Users Rate TikeanDQ?

  • Has the product been a good partner in doing business?: 8.3/10 (Category avg: 9.0/10)
  • Dashboards: 8.3/10 (Category avg: 9.0/10)
  • Steps to Answer: 6.7/10 (Category avg: 8.6/10)
  • Formats: 1.7/10 (Category avg: 8.6/10)

Who Is the Company Behind TikeanDQ?

  • Seller: Tikean
  • Year Founded: 2017
  • HQ Location: Helsinki, FI
  • LinkedIn® Page: www.linkedin.com
    3 employees on LinkedIn®

Who Uses This Product?

  • Company Size: 100% Large

What Are Recent G2 Reviews of TikeanDQ?

Vismatica

Vismatica is a dashboard software with a pointandclick interface, that empowers both endusers and I.T. professionals with the ability to easily create client/customer eportals, analytical dashboards, company intranets and extranets, knowledgebases and more.

Average Rating: 4.8/5.0

Total Reviews: 2

How Do G2 Users Rate Vismatica?

  • Has the product been a good partner in doing business?: 10.0/10 (Category avg: 9.0/10)

Who Is the Company Behind Vismatica?

Who Uses This Product?

  • Company Size: 100% Medium

What Are Recent G2 Reviews of Vismatica?

Waytobi

SaaS cloud-based solution to create, track, report, analyze and visualize your company or department KPI`s. Managing of KPI`s has never been that easy. No additional programming skills, learning sessions or webinars required – you can start working and analyzing your business metrics within a minutes. We are helping companies to be on top of their business performance followed by effective, timely and fruitful business decisions only. With our service you can: - Create your own KPIs or choose industry best practices KPI templates from our store - Use calculated and rolling KPIs - Select roles and privileges (4 levels of hierarchy) - Manage your KPI reports and analytics - Visualize and share your performance though the dashboards

Average Rating: 4.5/5.0

Total Reviews: 2

How Do G2 Users Rate Waytobi?

  • Dashboards: 10.0/10 (Category avg: 9.0/10)
  • Steps to Answer: 8.3/10 (Category avg: 8.6/10)
  • Formats: 8.3/10 (Category avg: 8.6/10)

Who Is the Company Behind Waytobi?

  • Seller: Waytobi
  • Year Founded: 2019
  • HQ Location: Hamburg, DE
  • LinkedIn® Page: www.linkedin.com
    3 employees on LinkedIn®

Who Uses This Product?

  • Company Size: 100% Small

What Are Recent G2 Reviews of Waytobi?

We Do Data Science

No Code Data Science in your browser

Average Rating: 4.8/5.0

Total Reviews: 2

How Do G2 Users Rate We Do Data Science?

  • Dashboards: 8.3/10 (Category avg: 9.0/10)
  • Steps to Answer: 8.3/10 (Category avg: 8.6/10)
  • Formats: 6.7/10 (Category avg: 8.6/10)

Who Is the Company Behind We Do Data Science?

Who Uses This Product?

  • Company Size: 67% Small, 33% Medium

What Are Recent G2 Reviews of We Do Data Science?

Whatifolution

Whatifolution makes decision making simple, fast and effective. With its dynamic and intuitive data modelling technology, Whatifolution contributes to the success of literally every business in the world. Whatifolution brings complexity back to simplicity by making data manipulation interactive. With the movement of a mouse or the touch of a finger, a decision maker can ask multiple what if questions by simply moving a line on the chart or adjusting a control button and seeing directly how changing one factor affects everything else.

Average Rating: 4.3/5.0

Total Reviews: 2

How Do G2 Users Rate Whatifolution?

  • Has the product been a good partner in doing business?: 10.0/10 (Category avg: 9.0/10)
  • Dashboards: 9.2/10 (Category avg: 9.0/10)
  • Steps to Answer: 8.3/10 (Category avg: 8.6/10)
  • Formats: 8.3/10 (Category avg: 8.6/10)

Who Is the Company Behind Whatifolution?

Who Uses This Product?

  • Company Size: 100% Medium

What Are Recent G2 Reviews of Whatifolution?

ZingChart

ZingChart is a JavaScript charting library designed to quickly render fast, beautiful charts with big data sets

Average Rating: 4.3/5.0

Total Reviews: 2

Who Is the Company Behind ZingChart?

Who Uses This Product?

  • Company Size: 50% Large, 50% Small

What Are Recent G2 Reviews of ZingChart?

What Are G2 Users Discussing About ZingChart?

Zing Data - Collaborative Business Intelligence

Zing Data is mobile-first collaborative business intelligence that lets you analyze, visualize, and collaborate around data in real-time from iOS, Android, and the web: * Connect & analyze multiple SQL data sources including Snowflake, BigQuery, Postgres, mySQL, Amazon RDS, Google Sheets, Excel, CSV, Databricks, Clickhouse and more * Ask questions in natural language using OpenAI and Google's leading LLMs * Visually query with a drag+drop builder that works on mobile and the web * Create real-time alerts and up-to-the-minute dashboards in just a few taps * Create tables and graphs from your phone -- even save down graphs to your phone's photo gallery and CSVs -- no other mobile BI solution offers this level of functionality * Collaborate with with your team with shared questions using @mentions and chat, all from your phone * Embed analytics on your own website and apps with our Javascript, iframe, and React SDK options Zing differs from other BI tools because it lets you ask questions (not just view dashboards already created) on your phone, and is built ground-up to be easy for anybody at an organization to use. Built by data experts from Facebook and LinkedIn, Zing brings consumer-level ease of use, beautiful UI/UX, a generous free tier, and a social-by-design approach to make your company's data accessible anywhere for everybody at your company.

Average Rating: 4.5/5.0

Total Reviews: 2

How Do G2 Users Rate Zing Data - Collaborative Business Intelligence?

  • Dashboards: 8.3/10 (Category avg: 9.0/10)
  • Steps to Answer: 9.2/10 (Category avg: 8.6/10)
  • Formats: 8.3/10 (Category avg: 8.6/10)

Who Is the Company Behind Zing Data - Collaborative Business Intelligence?

  • Seller: Zing Data
  • Year Founded: 2021
  • HQ Location: San Francisco, US
  • LinkedIn® Page: www.linkedin.com
    1 employees on LinkedIn®

Who Uses This Product?

  • Company Size: 100% Small

What Do G2 Reviewers Say About Zing Data - Collaborative Business Intelligence?

AI-generated summary from verified user reviews

Pros
  • Users commend the swift and responsive customer support of Zing Data, enhancing their overall experience with the platform.

What Are Recent G2 Reviews of Zing Data - Collaborative Business Intelligence?

ActiveReports

What is ActiveReports.NET? ActiveReports.NET is a comprehensive, embeddable reporting tool designed for .NET developers, providing developers and even their end users with the capabilities to create detailed and interactive reports. This robust reporting solution integrates seamlessly with .NET applications, enabling developers to design, publish, and distribute reports efficiently. ActiveReports.NET supports various report types, including RDL, Page, and Section reports, and offers a range of tools for report creation, such as a visual designer, code-behind events, and built-in scripting. Its powerful data-binding options and flexible deployment make it an ideal choice for developers looking to enhance their applications with professional reporting capabilities. Visual Report Designers: Web, Desktop, and Visual Studio Integrated versions of an intuitive drag-and-drop interface for designing complex reports without coding. Rich Data Visualization: Supports charts, graphs, and data visualizations to enhance report readability. Interactive Reporting: Provides features like drill-down, sorting, and parameterized reports for dynamic user interaction. Multi-format Export: Ability to export reports to various formats including PDF, Excel, Word, and HTML. Cross-platform Support: Compatibility with .NET 8.0 ensures flexibility across Windows, Linux, and MacOS. Comprehensive API: Extensive API for customization and integration into existing .NET applications. Subreport and Nested Reports: Supports the creation of subreports and nested reports for detailed data presentation. Flexible Data Sources: Connects to a variety of data sources including SQL databases, XML files, and web services. Customizable Styles: Offers customizable themes and styles to ensure reports match the application’s look and feel. High Performance: Optimized for performance to handle large datasets and complex report processing efficiently. What is ActiveReportsJS? ActiveReportsJS is a powerful web-based client-side reporting tool, allowing developers and report authors to easily design and display reports within their web applications. It supports JavaScript, as well as the major web frameworks, including Angular, React, Vue, and Svelte. ActiveReportsJS supports Continuous, Fixed, and Pageless reports, offers dozens of controls and charts to include in your report, and has features such as drill-down, runtime data filtering, and interactive parameters. The components and features offered by the report designer, in conjunction with the ease of building reports, makes ActiveReportsJS an ideal choice for businesses looking to enhance their web applications with reporting functionality. Visual Report Designers: Design reports without the need to know how to code by using the Web, Desktop, or Visual Studio Code designers and their drag-and-drop interface. Rich Data Visualization: Enhance your data by making use of dozens of charts and components, such as tables and tablix controls, to provide clear and concise views. Interactive Reporting: Allow your users to change how they view their data with features such as custom parameters, drill-down, drill-through, sorting, and filtering. Multi-Form Export: Export your reports to PDF, HTML, and CSV. Cross-Platform Support: ActiveReportsJS supports all of the major frameworks, including Angular, React, Vue, Vite, Next, Nuxt, and Svelte, while the standalone designer can be run on Windows, Linux, and MacOS. Comprehensive API: Integrate the designer and viewer into existing applications easily with the ActiveReportsJS API. Master-Child Report Structure: Take advantage of the subreports component to embed existing reports into master reports. Flexible Data Sources: Bind to multiple data sources, including REST APIs, GraphQL, OData, and CSV. Customizable Themes: Fit the style of the designer and viewer to your application by using one of our built-in themes or design your own.

Average Rating: 5.0/5.0

Total Reviews: 1

How Do G2 Users Rate ActiveReports?

  • Dashboards: 6.7/10 (Category avg: 9.0/10)
  • Steps to Answer: 6.7/10 (Category avg: 8.6/10)
  • Formats: 8.3/10 (Category avg: 8.6/10)

Who Is the Company Behind ActiveReports?

  • Seller: MESCIUS
  • Year Founded: 1980
  • HQ Location: Pittsburgh, PA
  • LinkedIn® Page: www.linkedin.com
    313 employees on LinkedIn®

Who Uses This Product?

  • Company Size: 100% Small

What Are Recent G2 Reviews of ActiveReports?

Acumen

Acumen is a data analytics platform built exclusively for associations by the data experts at Association Analytics. Hundreds of pre-built integrations into the most commonly used association tech systems make it the industry’s go-to analytics choice. With Acumen, associations get a single source of truth for their data with a full 360-degree view of your members’ activity.

Average Rating: 4.0/5.0

Total Reviews: 1

How Do G2 Users Rate Acumen?

  • Has the product been a good partner in doing business?: 10.0/10 (Category avg: 9.0/10)
  • Dashboards: 8.3/10 (Category avg: 9.0/10)
  • Steps to Answer: 6.7/10 (Category avg: 8.6/10)
  • Formats: 8.3/10 (Category avg: 8.6/10)

Who Is the Company Behind Acumen?

Who Uses This Product?

  • Company Size: 100% Small

What Are Recent G2 Reviews of Acumen?

Bijou Barry
BB
Researched and written by Bijou Barry
Updated June 24, 2026