Best Data Visualization Tools - Page 14

How Many Data Visualization Tools Products Does G2 Track?

Total Products under this Category: 478

Category Stats (Aug 2026)

  • Average Rating: 4.43/5 The average rating of products in this category, based on all submitted ratings
  • Top Trending Product: Supersimple (+0.89%) - Among all products in this category, Supersimple recorded the largest rating increase compared to last month

Last updated: August 04, 2026

How Does G2 Rank Data Visualization Tools Products?

Why You Can Trust G2's Software Rankings:

  • 30 Analysts and Data Experts
  • 26,100+ Authentic Reviews
  • 478+ Products
  • Unbiased Rankings

G2's software rankings are built on verified user reviews, rigorous moderation, and a consistent research methodology maintained by a team of analysts and data experts. Each product is measured using the same transparent criteria, with no paid placement or vendor influence. While reviews reflect real user experiences, which can be subjective, they offer valuable insight into how software performs in the hands of professionals. Together, these inputs power the G2 Score, a standardized way to compare tools within every category.

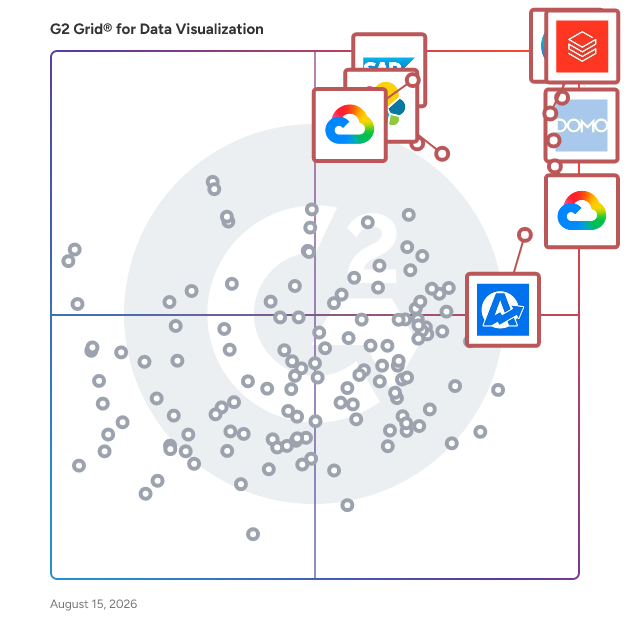
G2 Grid® for Data Visualization Tools

G2 Grid® for Data Visualization Tools plotting products by satisfaction and market presence

Highlighted products: Canva, Databricks, Domo, Looker, Data Studio, Elastic Stack, SAP HANA Cloud, and AgencyAnalytics.

Underlying data: [Grid® JSON](https://www.g2.com/categories/data-visualization-tools/grids.json?focus%5B%5D=canva&focus%5B%5D=databricks&focus%5B%5D=domo&focus%5B%5D=looker&focus%5B%5D=data-studio&focus%5B%5D=elastic-stack&focus%5B%5D=sap-hana-cloud-2025-10-01&focus%5B%5D=agencyanalytics)

Sponsored

Huwise

Huwise is a SaaS data product marketplace developed by a French company based in Paris, with over 15 years of experience. Recognized as a leading European player in data marketplace solutions by independent analyst firms, Huwise powers more than 3,000 data marketplaces across 25 countries. The platform is widely adopted across key industries including Banking & Insurance, Utilities and Energy, Transportation, Retail, Manufacturing and Central & Local Government. Huwise is a leading data product marketplace designed to transform raw data into AI-ready, business-ready data products. Unlike traditional data catalogs that primarily focus on metadata management and data discovery, Huwise actively drives data usage across organizations by converting data into actionable products. The platform is designed for business users, data product owners, data teams, and AI agents, providing a self-service, e-commerce-like experience that makes data more accessible, understandable, and usable across the organization. By enabling secure, governed, and scalable access to trusted data products, Huwise helps Chief Data Officers (CDOs) and Chief Data & AI Officers (CDAIOs) accelerate their data governance strategy, increase data adoption, and maximize the business impact of data and AI initiatives. Targeted at organizations seeking to enhance their data utilization, Huwise stands apart from conventional data platforms such as data lakes and cloud data warehouses. While these technologies are primarily focused on storing and processing large volumes of raw data, Huwise operates on top of the data stack to activate and distribute data. It ensures that data is not only understandable but also governed and directly usable throughout the organization. By complementing existing data catalog solutions, Huwise offers a business-facing access layer that integrates with raw, curated and certified data products, leveraging existing metadata and governance frameworks. The platform is built on data product principles, enabling organizations to publish and manage trusted, ready-to-use data products. Huwise facilitates self-service access to data without the need for technical expertise, ensuring that governance, security, and traceability are maintained across all data usage. Furthermore, it promotes data adoption through collaboration, feedback, and usage analytics, which are essential for driving engagement and maximizing the value of data within the organization. Huwise accelerates AI and analytics use cases by providing high-quality, contextualized data that enhances decision-making processes. Huwise also plays a crucial role in modern data architectures by supporting both the semantic layer and the emerging context layer. The semantic layer standardizes data definitions into business-friendly terms, while the context layer enriches this foundation with usage intelligence, lineage, governance, and real business interactions. This dual-layer approach enables both humans and AI to interpret and trust data accurately, reducing risks associated with misinterpretation or bias. As organizations increasingly adopt data mesh, data product strategies, and AI-driven operations, Huwise offers a modern approach for data sharing that is dedicated to drive data value and enhance business performance. It offers a data marketplace platform that not only organizes data but also activates it to deliver measurable business value. For companies aiming to maximize the potential of their data ecosystem, Huwise provides a future-proof, interoperable layer that bridges storage, governance, and consumption, ultimately accelerating data adoption and AI success at scale.

Visit website

ChartGen.ai

ChartGen.ai: Turn Messy Data into Stunning Charts in Seconds Stop wrestling with complex spreadsheet formulas. ChartGen.ai is your intelligent visual assistant that transforms raw numbers and text descriptions into publication-ready graphs, diagrams, and dashboards. Just upload your file or ask a question, and let our advanced AI handle the design. Why Choose ChartGen.ai ? Text-to-Chart Magic Simply type what you need—'Show me a bar chart of monthly sales growth'—and watch our AI chart generator build it instantly. No coding required. Instant File Visualization Upload your CSV or Excel (XLSX). Our engine automatically analyzes the data structure, identifies trends, and suggests the most effective visualization formats. Powered by Top-Tier AI Models Leveraging the latest intelligence from GPT-5.2, Claude Sonnet 4.5, and Gemini 3 Pro, ChartGen.ai ensures accurate data interpretation and aesthetically pleasing color palettes every time. How to Create Charts with AI in 3 Steps 1.Upload or Describe: Drag and drop your dataset or simply describe the chart you visualize. 2.AI Analysis: Our algorithms clean your data and select the perfect chart type (Bar, Line, Pie, Scatter, etc.). 3.Customize & Export: Tweak colors and labels in real-time, then export as High-Res PNG, SVG, or shareable links. The Ultimate AI Data Visualization Tool Whether you are a Business Analyst needing a quick report, a Marketer visualizing campaign ROI, or a Student working on a thesis, ChartGen.ai simplifies the process. Unlike traditional tools like Excel or Tableau, we offer a conversational interface for data. Ready for deeper insights? ChartGen.ai is just the beginning. As a product of Ada.im , our users can seamlessly upgrade to the full AI Data Analyst experience—complete with predictive analytics, multi-source integration, and team collaboration.

Average Rating: 4.7/5.0

Total Reviews: 3

How Do G2 Users Rate ChartGen.ai?

  • Steps to Answer: 8.3/10 (Category avg: 8.6/10)

Who Is the Company Behind ChartGen.ai?

Who Uses This Product?

  • Company Size: 100% Small

What Do G2 Reviewers Say About ChartGen.ai?

AI-generated summary from verified user reviews

Pros
  • Users value the intuitive and speedy chart creation of ChartGen.ai, enhancing their data analysis workflow significantly.
  • Users appreciate the ease of use of ChartGen.ai, seamlessly integrating into their workflow for quick, intuitive chart creation.
  • Users highlight the time-saving capability of ChartGen.ai, transforming data into polished charts almost instantly.
  • Users love the natural workflow of ChartGen.ai, making chart creation effortless and efficient for ad-hoc analysis.
  • Users commend the intuitive design of ChartGen.ai, enabling quick transformations of data into professional charts effortlessly.
Cons
  • Users note the limited customization options of ChartGen.ai, feeling constrained for advanced and specialized dashboard designs.
  • Users find the limited formatting options frustrating for advanced customization compared to traditional BI tools.

What Are Recent G2 Reviews of ChartGen.ai?

ClarityQB

Our enterprise-class Business Intelligence (BI) solution empowers your business, allowing you to visualise your data with drag-and-drop dashboard creation. ClarityQB is a web-based query and reporting tool designed for simple self-service analytics to enable any user to create insights into your business operations.

Average Rating: 4.0/5.0

Total Reviews: 3

How Do G2 Users Rate ClarityQB?

  • Dashboards: 10.0/10 (Category avg: 9.0/10)
  • Steps to Answer: 6.7/10 (Category avg: 8.6/10)
  • Formats: 6.7/10 (Category avg: 8.6/10)

Who Is the Company Behind ClarityQB?

Who Uses This Product?

  • Company Size: 67% Medium, 67% Small

What Do G2 Reviewers Say About ClarityQB?

AI-generated summary from verified user reviews

Pros
  • Users find ClarityQB easy to use, enhancing data accessibility and supporting effective data-driven decision making.
  • Users praise the customer support of ClarityQB for its user-friendly solutions that enhance focus on core business issues.
  • Users value the customizability of ClarityQB, enabling easy dashboard personalization without programming skills.
  • Users value the ease of use of ClarityQB, effectively addressing core business issues with user-friendly solutions.
  • Users value the easy creation feature of ClarityQB, allowing simple drag-and-drop customization without programming hassles.
Cons
  • Users find insufficient information on sharing and annotating dashboards, limiting effective collaboration and data analysis.
  • Users experience limitations in storage, causing some features to feel slow or constrained in performance.
  • Users feel that some features are limited and slow to load, impacting their overall experience with ClarityQB.
  • Users find the limited collaboration functionality of ClarityQB hinders effective teamwork and sharing of insights.
  • Users report performance issues in ClarityQB, hindering collaborative editing and sharing of dashboards effectively.

What Are Recent G2 Reviews of ClarityQB?

Contour BI

Contour BI is an easy-to-use platform for interactive reporting, data analysis and report distribution. The Contour BI platform provides access to all corporate data sources, builds interactive reports with zero programming and publishes interactive reports to your local network and the web.

Average Rating: 4.0/5.0

Total Reviews: 3

How Do G2 Users Rate Contour BI?

  • Has the product been a good partner in doing business?: 6.7/10 (Category avg: 9.0/10)
  • Dashboards: 10.0/10 (Category avg: 9.0/10)
  • Steps to Answer: 10.0/10 (Category avg: 8.6/10)
  • Formats: 10.0/10 (Category avg: 8.6/10)

Who Is the Company Behind Contour BI?

Who Uses This Product?

  • Company Size: 67% Medium, 33% Large

What Are Recent G2 Reviews of Contour BI?

DataReportive

DataReportive is a powerful SaaS platform that helps businesses automate data reporting, create interactive dashboards, and deliver real-time insights. With seamless integration across popular data sources like Google Analytics, Salesforce, Excel, MySQL, and more, DataReportive makes it easy to track KPIs, visualize metrics, and generate customized reports. Automate report delivery via email or PDF, collaborate with your team, and make data-driven decisions without manual work. Boost productivity, improve reporting accuracy, and stay on top of business performance — all in one easy-to-use platform.

Average Rating: 4.3/5.0

Total Reviews: 3

How Do G2 Users Rate DataReportive?

  • Has the product been a good partner in doing business?: 8.3/10 (Category avg: 9.0/10)
  • Dashboards: 9.2/10 (Category avg: 9.0/10)
  • Steps to Answer: 9.2/10 (Category avg: 8.6/10)
  • Formats: 9.2/10 (Category avg: 8.6/10)

Who Is the Company Behind DataReportive?

Who Uses This Product?

  • Company Size: 67% Large, 33% Small

What Are Recent G2 Reviews of DataReportive?

Data Viewer

The Data Viewer provides data visualization in the form of reports or charts that can be created and customized to suit a business's needs. Silos of data exist in most organizations and yet contain valuable insights into how well the organization is performing and where action is needed. Those silos often include Microsoft Excel workbooks, Microsoft SQL Azure databases, On-Premises data sources accessible through OData or Business Connectivity Services and even SharePoint Lists. These data sources can be connected to, to produce powerful reports displayed in SharePoint or Teams. At Lightning Tools, we put our customers needs first. We offer a range of products that fill genuine gaps within Microsoft SharePoint. Our product is not just the software itself however! When you buy from Lightning Tools, we ensure that you get outstanding customer care from our customer success managers and technical support representatives. Lightning Tools is proud to have achieved the Microsoft Gold Partner status in Application Development, and in Collaboration and Content. We ensure that our in-house developers and technical support staff are Microsoft accredited, so that you benefit from a well developed and supported product. Our products go through rigorous testing internally through our Quality Assurance staff before testing externally through SPCaf from Rencore for code quality. “The Rencore Development Best Practice Certification enables companies that build solutions, product, and add-ins around SharePoint to check if they pass our rigorous tests and audits to sport our program’s seal of quality. With this seal, we approve highest security, sustainability, and effectiveness of the very product. Tested against our ISO 25010-based SharePoint specific metrics, our clients will be constantly reassessing their product quality to ensure they stay up to date with latest best practice once approved by us.” Microsoft Office Apps and Services MVP and Lightning Tools CEO Brett Lonsdale has a strong passion for Microsoft SharePoint and enjoys seeing SharePoint and the Lightning Tools product range grow year on year.

Average Rating: 4.3/5.0

Total Reviews: 3

How Do G2 Users Rate Data Viewer?

  • Has the product been a good partner in doing business?: 9.2/10 (Category avg: 9.0/10)
  • Dashboards: 8.3/10 (Category avg: 9.0/10)

Who Is the Company Behind Data Viewer?

Who Uses This Product?

  • Company Size: 67% Small, 33% Medium

What Are Recent G2 Reviews of Data Viewer?

Grist

Grist combines the best of spreadsheets, databases and app builders. Using a familiar spreadsheet interface, organize your information as a relational database and build drag-and-drop dashboards in minutes. Make the most of your data by ensuring it is well-structured and stored in one place. No duplication, no spreadsheet-wrangling, no merging documents. Collaborate in real time, protecting your data with custom access rules that control permissions down to the cell. Let everyone work from the same data without compromising privacy or stability. Sign up for a free team account or host Grist yourself – either way, your data is always yours.

Average Rating: 4.9/5.0

Total Reviews: 7

How Do G2 Users Rate Grist?

  • Has the product been a good partner in doing business?: 10.0/10 (Category avg: 9.0/10)

Who Is the Company Behind Grist?

  • Seller: Grist Labs
  • Year Founded: 2014
  • HQ Location: New York, US
  • Twitter: @getgrist
    434 Twitter followers
  • LinkedIn® Page: www.linkedin.com
    12 employees on LinkedIn®

Who Uses This Product?

  • Company Size: 100% Small

What Do G2 Reviewers Say About Grist?

AI-generated summary from verified user reviews

Pros
  • Users commend the responsive customer support of Grist, enhancing their overall experience and satisfaction with the product.
  • Users value the customization options in Grist, enabling tailored solutions for diverse spreadsheet needs.
  • Users find Grist easy to use, appreciating its intuitive features and seamless transition from traditional spreadsheet platforms.
  • Users commend Grist for its support for multi-line formulas and advanced features that enhance spreadsheet functionality.
  • Users value the flexibility of Grist, enhancing their spreadsheet experience with advanced features and customization options.
Cons
  • Users find the complex usage of Grist challenging due to UI, forms limitations, and steep learning curve.
  • Users report form issues in Grist, citing a lack of powerful forms and a need for improved UI design.
  • Users find the form limitations of Grist restrictive, needing separate apps for advanced form functionalities.
  • Users find the steep learning curve challenging, particularly due to lengthy video documentation and complex concepts.
  • Users find the missing features, like powerful forms and better UI, hinder the app's overall effectiveness.

What Are Recent G2 Reviews of Grist?

What Are G2 Users Discussing About Grist?

GX LEAF

GX LEAF is a cloud solution used to analyze raw data and identify trends through visual representation of key performance indicators.

Average Rating: 4.3/5.0

Total Reviews: 3

How Do G2 Users Rate GX LEAF?

  • Dashboards: 6.7/10 (Category avg: 9.0/10)
  • Formats: 6.7/10 (Category avg: 8.6/10)

Who Is the Company Behind GX LEAF?

  • Seller: GX
  • Year Founded: 1978
  • HQ Location: Victoria, CA
  • LinkedIn® Page: www.linkedin.com
    12 employees on LinkedIn®

Who Uses This Product?

  • Company Size: 67% Large, 33% Small

What Do G2 Reviewers Say About GX LEAF?

AI-generated summary from verified user reviews

Pros
  • Users find the ease of use in GX LEAF invaluable for managing testing life cycles effectively and efficiently.
  • Users value the effective data visualization capabilities of GX LEAF, enhancing insights through cloud solutions.
  • Users value the easy integrations of GX LEAF, which streamline setup and enhance overall efficiency in testing management.
  • Users value the seamless integrations of GX LEAF, enhancing efficiency and simplifying the setup process for testing management.
  • Users value the intuitive dashboard of GX LEAF, which simplifies tracking and managing testing life cycles effectively.
Cons
  • Users find the complex setup of GX LEAF cumbersome, requiring time and possibly professional assistance for initial configuration.
  • Users find the initial setup complex, often needing professional assistance due to extensive customization options.
  • Users feel the interface navigation could be more user-friendly, hindering their overall experience with the GX LEAF.
  • Users feel the customization options are limited, impacting the overall flexibility and usability of GX LEAF.
  • Users feel the customization options are limited, hindering flexibility in reporting and collaborative workflows.

What Are Recent G2 Reviews of GX LEAF?

HCL MyXalytics

HCL MyXalytics, a part of Intelligent Full Stack Observability offering under HCLSoftware AI & Intelligent Operations framework. It is a Unified Reporting & Predictive Analytics Software. It empowers decision-makers with the clarity they need to drive continuous operational improvements, optimize costs, and minimize risk.

Average Rating: 4.0/5.0

Total Reviews: 3

How Do G2 Users Rate HCL MyXalytics?

  • Dashboards: 10.0/10 (Category avg: 9.0/10)
  • Steps to Answer: 7.5/10 (Category avg: 8.6/10)
  • Formats: 8.3/10 (Category avg: 8.6/10)

Who Is the Company Behind HCL MyXalytics?

  • Seller: HCL Technologies
  • Year Founded: 1999
  • HQ Location: Noida, Uttar Pradesh
  • Twitter: @hcltech
    425,043 Twitter followers
  • LinkedIn® Page: www.linkedin.com
    246,058 employees on LinkedIn®
  • Ownership: NSE - National Stock Exchange of India

Who Uses This Product?

  • Company Size: 67% Small, 33% Medium

What Are Recent G2 Reviews of HCL MyXalytics?

HyperAspect Cognitive Cloud

HyperAspect Cognitive Cloud is an enterprise AI analytics and automation platform that empowers users to leverage big data to drive strategic, efficient decision-making across departments. We bring responsible AI and natural language processing into an organization's core processes with the required security compliance frameworks within data-intensive industries like healthcare, finance, insurance, legal, marketing, retail, professional digital services.

Average Rating: 5.0/5.0

Total Reviews: 6

How Do G2 Users Rate HyperAspect Cognitive Cloud?

  • Has the product been a good partner in doing business?: 10.0/10 (Category avg: 9.0/10)
  • Dashboards: 10.0/10 (Category avg: 9.0/10)
  • Steps to Answer: 10.0/10 (Category avg: 8.6/10)
  • Formats: 10.0/10 (Category avg: 8.6/10)

Who Is the Company Behind HyperAspect Cognitive Cloud?

Who Uses This Product?

  • Company Size: 67% Medium, 33% Small

What Do G2 Reviewers Say About HyperAspect Cognitive Cloud?

AI-generated summary from verified user reviews

Pros
  • Users praise the AI-driven insights of HyperAspect Cognitive Cloud, enhancing their data analysis experience effortlessly.
  • Users praise the user-friendly AI integration of HyperAspect Cognitive Cloud, making advanced data analysis accessible to all.
  • Users appreciate the user-friendly design of HyperAspect Cognitive Cloud, making AI accessible for all skill levels.
  • Users benefit from the helpful customer support that simplifies implementation and enhances productivity with HyperAspect Cognitive Cloud.
  • Users value the easy integrations of HyperAspect Cognitive Cloud for quick deployments and enhanced productivity.
Cons
  • Users find the pricing expensive, making it less accessible for smaller businesses seeking cognitive solutions.
  • Users find the pricing issues challenging, especially for smaller businesses looking to adopt HyperAspect Cognitive Cloud.

What Are Recent G2 Reviews of HyperAspect Cognitive Cloud?

IBM i2 Analyze

IBM i2 Analyze is an enterprise intelligence analysis environment that facilitates information sharing and intelligence production.

Average Rating: 4.7/5.0

Total Reviews: 3

How Do G2 Users Rate IBM i2 Analyze?

  • Dashboards: 8.3/10 (Category avg: 9.0/10)
  • Formats: 8.3/10 (Category avg: 8.6/10)

Who Is the Company Behind IBM i2 Analyze?

Who Uses This Product?

  • Company Size: 67% Large, 33% Small

What Are Recent G2 Reviews of IBM i2 Analyze?

What Are G2 Users Discussing About IBM i2 Analyze?

Juicebox

Create Reports Your Customer Will Love Juicebox takes the pain out of producing data reports and presentations—and you’ll delight customers with beautiful, interactive web experiences. Design once, deliver to 5 or 500 customers. Personalized to each. Modern, interactive charts that tell a story – no coding required. Build with simple spreadsheets, or connect to your database.

Average Rating: 3.7/5.0

Total Reviews: 3

How Do G2 Users Rate Juicebox?

  • Has the product been a good partner in doing business?: 10.0/10 (Category avg: 9.0/10)

Who Is the Company Behind Juicebox?

  • Seller: Juice Analytics
  • Year Founded: 2004
  • HQ Location: Nashville, US
  • Twitter: @JuiceAnalytics
    2,667 Twitter followers
  • LinkedIn® Page: www.linkedin.com
    14 employees on LinkedIn®

Who Uses This Product?

  • Company Size: 33% Medium, 33% Small

What Do G2 Reviewers Say About Juicebox?

AI-generated summary from verified user reviews

Pros
  • Users find Juicebox to be easy to use, significantly reducing cognitive load for less experienced recruiters.

What Are Recent G2 Reviews of Juicebox?

What Are G2 Users Discussing About Juicebox?

MSIGHTS

MSIGHTS has been supporting marketing teams for 17+ years in helping to make their data great for reporting and analysis. Our Platform, a 2019 MarTech Breakthrough Awards winner for "Best Overall Marketing Campaign Management Solution", helps across these critical areas: * Automate the collection, integration, and transformation of all your marketing results sources -- digital, social, search, offline, lead gen, direct mail, media plans, and sales (plus more) -- into reporting-ready datasets. * Streamline marketing analysis with harmonized datasets specifically designed for results analysis, optimization, attribution, MMM, as well as datasets that feed back into your data lake. Go beyond fields from just your taxonomy with MSIGHTS' robust data schema. * Build detailed reporting views and executive dashboards using MSIGHTS' free cloud reporting platform or connect from your own visualization tool like Tableau, Excel, Domo, or Looker (to name a few).

Average Rating: 3.8/5.0

Total Reviews: 6

How Do G2 Users Rate MSIGHTS?

  • Has the product been a good partner in doing business?: 8.3/10 (Category avg: 9.0/10)
  • Dashboards: 10.0/10 (Category avg: 9.0/10)
  • Steps to Answer: 8.3/10 (Category avg: 8.6/10)
  • Formats: 8.3/10 (Category avg: 8.6/10)

Who Is the Company Behind MSIGHTS?

  • Seller: MSIGHTS
  • Company Website:
  • Year Founded: 2004
  • HQ Location: Charlotte, US
  • Twitter: @msights
    225 Twitter followers
  • LinkedIn® Page: www.linkedin.com
    42 employees on LinkedIn®

Who Uses This Product?

  • Company Size: 43% Large, 29% Medium

What Do G2 Reviewers Say About MSIGHTS?

AI-generated summary from verified user reviews

Pros
  • Users value the analytics expertise of MSIGHTS, simplifying complex data integration and enhancing strategic decision-making.
  • Users find MSIGHTS' data compilation and normalization invaluable, significantly simplifying the analytics process and saving time.
  • Users find MSIGHTS valuable for its automation capabilities, significantly reducing time spent on data integration tasks.
  • Users commend MSIGHTS for their exceptional business support, featuring experts who provide strategic guidance and efficient vendor management.
  • Users value the expert communication from MSIGHTS, praising their team's understanding and support in complex implementations.
Cons
  • Users find the limited data visualization options in MSIGHTS frustrating when presenting marketing performance trends to stakeholders.
  • Users highlight the data inaccuracy issues, suggesting a need for better validation and more integrated partners.
  • Users note integration issues with third parties, suggesting improvements for better data validation and vendor collaboration.
  • Users find the lack of customization in MSIGHTS' data visualization options frustrating when presenting marketing trend results.
  • Users express concern about the lack of integrations, which limits connectivity with third-party vendors and partners.

What Are Recent G2 Reviews of MSIGHTS?

What Are G2 Users Discussing About MSIGHTS?

Myriade

In the Age of AI, speed and clarity matter. Myriade empowers data and business teams to become truly data-driven. 10x faster for analysts and SQL-free for business users. Simply ask your questions clearly, and Myriade intelligently handles the entire data exploration process - finding tables, joining fields, writing queries, and presenting clear insights instantly. All interactions happen securely, with zero data retention. With Myriade, getting the right information is effortless.

Average Rating: 4.5/5.0

Total Reviews: 4

How Do G2 Users Rate Myriade?

  • Has the product been a good partner in doing business?: 10.0/10 (Category avg: 9.0/10)

Who Is the Company Behind Myriade?

Who Uses This Product?

  • Company Size: 50% Small, 25% Medium

What Are Recent G2 Reviews of Myriade?

Netcracker Advanced Analytics

Netcracker Advanced Analytics brings data intelligence, visualization and decisioning to help improve business and operational KPIs.

Average Rating: 4.5/5.0

Total Reviews: 3

How Do G2 Users Rate Netcracker Advanced Analytics?

  • Has the product been a good partner in doing business?: 9.4/10 (Category avg: 9.0/10)
  • Dashboards: 8.9/10 (Category avg: 9.0/10)
  • Steps to Answer: 8.3/10 (Category avg: 8.6/10)
  • Formats: 8.3/10 (Category avg: 8.6/10)

Who Is the Company Behind Netcracker Advanced Analytics?

  • Seller: NetCracker
  • Year Founded: 1993
  • HQ Location: Waltham, Massachusetts, United States
  • Twitter: @NetCrackerTech
    4,903 Twitter followers
  • LinkedIn® Page: www.linkedin.com
    8,936 employees on LinkedIn®

Who Uses This Product?

  • Company Size: 67% Large, 33% Medium

What Are Recent G2 Reviews of Netcracker Advanced Analytics?

Ninja Metrics

Ninja Metrics was an advanced predictive analytics company specializing in measuring social influence within digital environments. Their flagship product, the Katana® Social Analytics Engine, utilized complex algorithms to analyze user interactions, enabling businesses to identify, monetize, and retain their most valuable and influential customers. This technology was particularly beneficial for industries such as gaming, retail, e-commerce, and entertainment, providing insights into user behavior and social impact. Key Features and Functionality: - Social Value® Measurement: Quantified the monetary worth of user influence within social networks, allowing companies to understand the financial impact of social interactions. - Predictive Analytics: Forecasted user behaviors, such as spending patterns and churn rates, enabling proactive strategies to enhance user engagement and retention. - Automated Social Graph Analysis: Analyzed complex social networks to identify key influencers and their impact on others, facilitating targeted marketing and personalized user experiences. - Comprehensive Dashboard: Offered a flexible interface supporting segmentation, cohort analysis, churn projections, conversion rates, revenue analysis, and comprehensive KPI tracking. - Easy Integration: Provided a REST-based API compatible with various platforms, including iOS, Android, JavaScript, PHP, Java/C#, C++, and Flash, ensuring seamless integration into existing systems. Primary Value and User Solutions: Ninja Metrics' Katana® Social Analytics Engine addressed the challenge of understanding and leveraging social influence within digital platforms. By accurately measuring Social Value®, businesses could identify not only high-spending customers but also influential users who drive engagement and revenue through their networks. This insight enabled companies to optimize marketing efforts, enhance user retention strategies, and ultimately increase revenue by focusing on both direct spenders and influential users who amplify the reach and impact of their products or services.

Average Rating: 4.2/5.0

Total Reviews: 3

How Do G2 Users Rate Ninja Metrics?

  • Has the product been a good partner in doing business?: 7.5/10 (Category avg: 9.0/10)
  • Dashboards: 9.2/10 (Category avg: 9.0/10)
  • Steps to Answer: 8.3/10 (Category avg: 8.6/10)
  • Formats: 9.2/10 (Category avg: 8.6/10)

Who Is the Company Behind Ninja Metrics?

Who Uses This Product?

  • Company Size: 67% Medium, 33% Small

What Are Recent G2 Reviews of Ninja Metrics?

Bijou Barry
BB
Researched and written by Bijou Barry
Updated June 24, 2026