# Best Analytics Platforms - Page 7

*By [Tian Lin](https://research.g2.com/insights/author/tian-lin)*

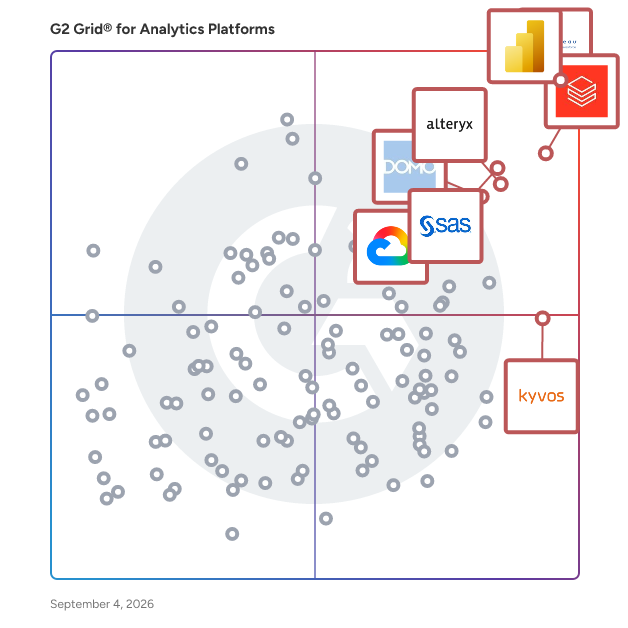
The best analytics platform in 2026 is Microsoft Power BI, rated 4.5 out of 5 on G2 based on 1,600+ verified reviews. For data engineering and machine learning workflows, Databricks and Alteryx both lead at 4.6 stars, with Databricks excelling in governed lakehouse analytics and Alteryx in no-code automation.

1. Microsoft Power BI — 4.5/5 (1,600+ reviews): Microsoft-connected interactive dashboards
2. Tableau — 4.4/5 (3,700+ reviews): Flexible visual dashboard exploration
3. Databricks — 4.6/5 (1,300+ reviews): Governed lakehouse analytics and ML workflows
4. SAS Viya — 4.3/5 (800+ reviews): Cloud analytics for governed data science
5. Alteryx — 4.6/5 (800+ reviews): No-code data preparation and automation

*Updated June 2026. Based on 2026 G2 verified review data across 6,100+ products.*


Analytics platforms provide a tool set for businesses to transform raw data into meaningful, actionable insights. They enable organizations to explore data, uncover trends, forecast future outcomes, and support informed decision making.

Unlike tools limited to reporting on past performance, analytics platforms often include advanced capabilities such as predictive modeling, statistical analysis, and machine learning (ML). These platforms are designed to be flexible and scalable, supporting a wide range of use cases across the business.

These platforms are used in nearly every business function, from marketing and sales to finance, operations, and HR, supporting both strategic planning and day-to-day performance monitoring. From data analysts and scientists to business stakeholders and executives, analytics platforms are used by a wide range of personas. While analysts focus on exploring data and generating insights, self-service tools now enable non-technical users to interact directly with data. IT teams support platform integration and security, reflecting the growing push to democratize data access and embed analytics into daily decision-making across the organization.

Analytics platforms support critical functions such as data blending and modeling, enabling users to combine data from diverse sources and build robust, interconnected data models. The visual outputs — dashboards, reports, and interactive charts — help users explore trends, drill down into granular details, and communicate insights clearly.

Unlike standalone data visualization tools, which are limited to presenting information, analytics platforms encompass the full analytical workflow. Many also offer advanced capabilities such as embedded analytics, natural language query, and augmented analytics, which leverage ML to automate insight discovery and make data exploration more accessible to a broader audience.

Analytics platforms and [business intelligence (BI) software](https://www.g2.com/categories/business-intelligence) often work in tandem to support data-driven organizations. While BI tools focus on tracking and reporting historical performance through dashboards and key performance indicators (KPI), analytics platforms provide broader capabilities that support exploratory analysis and strategic planning. BI answers &quot;what happened,&quot; while analytics platforms help users understand why it happened and what might happen next. Rather than replacing BI, analytics platforms complement it by enabling deeper insights and empowering a wider range of users across the organization.

To qualify for inclusion in the Analytics Platforms category, a product must:

- Ingest and integrate data from a wide range of structured and semi-structured sources
- Prepare and transform data using built-in tools for cleaning, enrichment, and formatting
- Support connections to diverse data sources, including file uploads, databases, application programming interfaces (API), and SaaS apps
- Enable users to model data relationships, join datasets, and explore data interactively
- Offer tools to build meaningful business reports, dashboards, and visualizations
- Allow creation and sharing of internal analytics applications or embedded insights across teams


## Top Analytics Platforms at a Glance
| # | Product | Rating | Best For | What Users Say |
|---|---------|--------|----------|----------------|
| 1 | [Microsoft Power BI](https://www.g2.com/products/microsoft-microsoft-power-bi/reviews) | 4.5/5.0 (1,589 reviews) | Microsoft-connected interactive dashboards | "[Zero-Code Dashboards with Easy Data Transformations and One-Click Publishing](https://www.g2.com/survey_responses/microsoft-power-bi-review-12864007)" |
| 2 | [Tableau](https://www.g2.com/products/tableau/reviews) | 4.4/5.0 (3,630 reviews) | Flexible visual dashboard exploration | "[Tableau’s Flexible, Powerful Analytics with Deep Integrations and a Standout Community](https://www.g2.com/survey_responses/tableau-review-13060039)" |
| 3 | [Databricks](https://www.g2.com/products/databricks/reviews) | 4.6/5.0 (1,284 reviews) | Governed lakehouse analytics and ML workflows | "[Great Spark Scaling, But Slow Cluster Boot Times](https://www.g2.com/survey_responses/databricks-review-12905667)" |
| 4 | [SAS Viya](https://www.g2.com/products/sas-sas-viya/reviews) | 4.3/5.0 (758 reviews) | Cloud analytics for governed data science | "[Powerful &amp; Transforming Data into Decisions—Effortlessly and Intelligently.](https://www.g2.com/survey_responses/sas-viya-review-12682824)" |
| 5 | [Alteryx](https://www.g2.com/products/alteryx/reviews) | 4.6/5.0 (829 reviews) | No-code data preparation and automation | "[Intuitive Drag-and-Drop Analytics That Speeds Up Data Prep and Insights](https://www.g2.com/survey_responses/alteryx-review-12983224)" |
| 6 | [Looker](https://www.g2.com/products/looker/reviews) | 4.4/5.0 (1,584 reviews) | Governed shared BI metrics | "[Transforms Data, But Challenging for Beginners](https://www.g2.com/survey_responses/looker-review-12784757)" |
| 7 | [Domo](https://www.g2.com/products/domo/reviews) | 4.3/5.0 (999 reviews) | Centralized self-service business dashboards | "[Domo Makes Real-Time Dashboards Effortless with Intuitive ETL and Mobile Metrics](https://www.g2.com/survey_responses/domo-review-13032278)" |
| 8 | [Kyvos Semantic Layer](https://www.g2.com/products/kyvos-semantic-layer/reviews) | 4.8/5.0 (265 reviews) | Semantic-layer acceleration for enterprise BI | "[Kyvos Unified Our Business Logic with a Single Semantic Model](https://www.g2.com/survey_responses/kyvos-semantic-layer-review-12797024)" |
| 9 | [Hex](https://www.g2.com/products/hex-tech-hex/reviews) | 4.5/5.0 (399 reviews) | SQL and Python notebook analytics apps | "[Effortless Data Analysis with Powerful AI](https://www.g2.com/survey_responses/hex-review-12262172)" |
| 10 | [Sigma](https://www.g2.com/products/sigma-computing-sigma/reviews) | 4.4/5.0 (544 reviews) | Warehouse-native spreadsheet-style analytics | "[Easiest BI Tool: Live Snowflake Data in a Spreadsheet-Like Experience](https://www.g2.com/survey_responses/sigma-review-12573150)" |

---
## What Are the Most Common Questions About Analytics Platforms?
*AI-generated · Last updated: May 26, 2026*
### What analytics platforms with intuitive UI that non-technical users adopt without extensive training?
Based on G2 reviews, buyers looking for analytics platforms with an intuitive interface often prioritize drag-and-drop workflows, easy report creation, and minimal training overhead. According to verified users, Microsoft Power BI is frequently described as easy to use for dashboard creation, with non-technical teams able to navigate dashboards and build simple reports. Tableau reviewers also mention beginner-friendly dashboarding and drag-and-drop analysis, especially for quick visualization work. G2 reviewers mention that Looker can support self-service access once models are set up, though some users note a steeper learning curve for report creation. Across recent reviews, ease of use is strongest when teams need straightforward dashboard access, fast setup, and familiar visual exploration.


### What most trusted analytics solutions by data teams based on user reviews for teams with similar?
Based on G2 reviews, trust among data teams in this category often comes from reliability in handling large datasets, flexible workflows, and strong collaboration between technical and business users. According to verified users, Databricks is repeatedly trusted for unifying data engineering, analytics, and machine learning in one environment, which reduces tool sprawl. G2 reviewers mention Microsoft Power BI as dependable for centralizing reporting and sharing metrics across teams, especially in Microsoft-heavy environments. Tableau is also trusted for visual exploration and dashboard creation, particularly when teams need strong storytelling and flexible analysis. Recent reviews show that data teams value tools they can rely on for scaling workflows, consolidating sources, and keeping metrics accessible to stakeholders.


### Which analytics solutions integrate with data warehouses like snowflake, BigQuery, and Redshift seamlessly?
Based on G2 reviews, Databricks stands out for teams that need seamless integration with modern data warehouse and cloud data environments. According to verified users, Databricks brings data engineering, analytics, and machine learning into one platform while connecting well with tools such as Snowflake, BigQuery, and related cloud ecosystems. G2 reviewers mention native connectors, shared notebooks, workflow orchestration, and unified data handling as key reasons it simplifies work across warehouse-based stacks. Reviews also describe easier collaboration and fewer handoffs between teams because data processing and analysis stay in one environment. For buyers prioritizing warehouse-centric analytics, recent feedback most consistently points to Databricks as the strongest fit in this dataset.


### What top analytics platforms for mid-market companies building self-service dashboards across departments that scales with team?
Based on G2 reviews, mid-market teams building self-service dashboards across departments often look for tools that centralize reporting, support business users, and reduce dependence on manual spreadsheet work. G2 reviewers mention Microsoft Power BI as a strong fit for cross-functional KPI tracking, automated dashboards, and broad access across business users. According to verified users, Databricks supports scalable analytics workflows when teams need broader data engineering and analytics in one place. Tableau is also cited for interactive dashboards and accessible visual exploration, especially when organizations want polished reporting for multiple stakeholders. Across recent reviews, these platforms are described as helpful for scaling visibility across finance, operations, sales, and marketing without constantly rebuilding reports.

**Here are some of the top-rated products on G2:**

- [Microsoft Power BI](https://www.g2.com/products/microsoft-microsoft-power-bi/reviews) – used to centralize reporting and give business teams self-service dashboards across departments
- [Databricks](https://www.g2.com/products/databricks/reviews) – supports scalable data workflows that combine analytics, reporting, and shared access to large datasets
- [Tableau](https://www.g2.com/products/tableau/reviews) – helps teams build interactive dashboards and share visual insights across business functions


### Which analytics solutions provide fast query response and drill-down capability for ad-hoc exploration?
Based on G2 reviews, Microsoft Power BI is a strong choice when teams need fast query response and flexible drill-down for ad-hoc exploration. According to verified users, Power BI makes it easy to drill into numbers, filter data, and explore trends without writing repeated custom queries. G2 reviewers mention cross-filtering, interactive dashboards, and quick access to KPIs as key strengths for day-to-day analysis. Reviews also highlight its ability to centralize data from multiple sources and let business users navigate details on their own. While some reviewers mention performance slowdowns on especially large or complex datasets, recent feedback still shows Power BI as the most consistently referenced option here for accessible drill-down analysis.


### What analytics platforms supporting collaborative dashboards, annotations, and mobile access for on-the-go insights?
Based on G2 reviews, collaboration and mobile accessibility are recurring strengths for several analytics platforms. According to verified users, Domo supports sharing dashboards, discussing insights, and enabling collaboration across departments, with reviewers also highlighting its mobile experience. G2 reviewers mention Yellowfin BI for collaboration through comments, annotations, and shared reporting workflows that help teams discuss data in context. Microsoft Power BI is also noted for mobile and web access, along with easy dashboard sharing and centralized reporting. Recent reviews suggest these tools are most relevant when teams need analytics that travel beyond a desktop, allowing leaders and frontline users to access dashboards, review updates, and align on performance while moving between meetings or locations.


### Which analytics platforms prevent incorrect conclusions by enforcing data governance and preventing metric manipulation?
Based on G2 reviews, Looker is one of the strongest options for preventing incorrect conclusions through governed metrics and centralized definitions. According to verified users, its modeling approach helps define metrics once and apply them consistently across dashboards, reducing disagreements over what a number means. G2 reviewers mention that this centralized layer helps stop teams from pulling conflicting versions of the same metric and creates a more trusted reporting environment. Reviews also describe faster decision-making because teams are working from one shared definition instead of reconciling spreadsheets. For organizations focused on governance, consistency, and reducing metric drift, recent review language most directly supports Looker in this area.


### What is the best analytics platforms for business teams accessing insights without requiring SQL or data science skills?
Based on G2 reviews, Microsoft Power BI is the best-supported answer in this dataset for business teams that need insights without requiring SQL or data science skills. According to verified users, it is easy to use, supports drag-and-drop reporting, and helps non-technical users access dashboards and explore data without heavy training. G2 reviewers mention self-service dashboards, natural language features, and accessible visualizations that help staff make informed decisions without depending on technical teams for every question. Reviews also note strong integration with common business tools and data sources, which helps teams get started faster. For non-technical business users, Power BI is the most consistently referenced option in recent reviews.

**Here are some of the top-rated products on G2:**

- [Microsoft Power BI](https://www.g2.com/products/microsoft-microsoft-power-bi/reviews) – helps non-technical teams build and use dashboards with drag-and-drop reporting and familiar workflows
- [Tableau](https://www.g2.com/products/tableau/reviews) – supports quick visual exploration with an intuitive drag-and-drop interface for broad business use
- [Looker](https://www.g2.com/products/looker/reviews) – enables self-service exploration and shared dashboards once models are set up for business teams


### What highest rated analytics platform for enterprises democratizing data access across business functions?
Based on G2 reviews, enterprises democratizing data access across business functions often choose platforms that centralize metrics and make dashboards accessible to non-technical users. G2 reviewers mention Microsoft Power BI for unifying reporting across departments and helping business users explore dashboards directly. According to verified users, Looker supports centralized metric definitions and broader self-service analytics across organizations, reducing inconsistencies between teams. Tableau is also frequently cited for making complex datasets easier to communicate through interactive dashboards and visual storytelling. Across recent reviews, these platforms are associated with giving finance, operations, marketing, and leadership a common view of performance so teams can act without waiting on repeated manual reporting.

**Here are some of the top-rated products on G2:**

- [Microsoft Power BI](https://www.g2.com/products/microsoft-microsoft-power-bi/reviews) – centralizes dashboards and gives business teams direct access to live metrics across functions
- [Looker](https://www.g2.com/products/looker/reviews) – provides a centralized modeling layer that helps teams work from shared definitions across the organization
- [Tableau](https://www.g2.com/products/tableau/reviews) – makes cross-functional insights easier to share through interactive dashboards and visual exploration


### What analytics solutions with robust caching and performance optimization to maintain fast speeds at scale?
Based on G2 reviews, several analytics solutions stand out for maintaining speed at scale through performance optimization. According to verified users, Databricks is frequently praised for handling large-scale data processing efficiently and supporting complex analytics without major slowdowns when workflows are managed well. G2 reviewers mention Kyvos Semantic Layer for accelerating query response on very large datasets and improving dashboard responsiveness, especially in BI environments. Tableau and Microsoft Power BI are also noted for strong performance in many day-to-day scenarios, though reviewers sometimes mention tuning is important as complexity grows. Across recent reviews, the strongest performance-focused language centers on Databricks and Kyvos when buyers need fast access to large volumes of data.


## How Many Analytics Platforms Products Does G2 Track?
**Total Products under this Category:** 353

### Category Stats (Jul 2026)
- **Average Rating**: 4.49/5 (↑0.01 vs Jun 2026) The average rating of products in this category, based on all submitted ratings
- **Top Trending Product**: KNIME (+1.2%) - Among all products in this category, KNIME recorded the largest rating increase compared to last month
*Last updated: July 06, 2026*


## How Does G2 Rank Analytics Platforms Products?

**Why You Can Trust G2's Software Rankings:**

- 30 Analysts and Data Experts
- 28,500+ Authentic Reviews
- 353+ Products
- Unbiased Rankings

G2's software rankings are built on verified user reviews, rigorous moderation, and a consistent research methodology maintained by a team of analysts and data experts. Each product is measured using the same transparent criteria, with no paid placement or vendor influence. While reviews reflect real user experiences, which can be subjective, they offer valuable insight into how software performs in the hands of professionals. Together, these inputs power the G2 Score, a standardized way to compare tools within every category.


## Which Analytics Platforms Is Best for Your Use Case?

- **Leader:** [Microsoft Power BI](https://www.g2.com/products/microsoft-microsoft-power-bi/reviews)
- **Highest Performer:** [Kyvos Semantic Layer](https://www.g2.com/products/kyvos-semantic-layer/reviews)
- **Easiest to Use:** [Databricks](https://www.g2.com/products/databricks/reviews)
- **Top Trending:** [Hex](https://www.g2.com/products/hex-tech-hex/reviews)
- **Best Free Software:** [Tableau](https://www.g2.com/products/tableau/reviews)


---

**Sponsored**

### OtterlyAI

OtterlyAI is an award-winning AI Search Optimization platform that helps brands track and boost visibility across ChatGPT, Perplexity, Google AI Overviews, AI Mode, Gemini, Copilot, and Claude. Teams use OtterlyAI to monitor brand mentions, website citations, and AI search prompts, then improve content and discoverability in AI answers. More than +30,000 marketing professionals use OtterlyAI as of 2026. The company was named a Cool Vendor in the 2025 Gartner Cool Vendors in AI in Marketing report and won Best AI Search Software Solution at the 2026 European Search Awards. OtterlyAI is based in Austria. Learn more at https://otterly.ai. OtterlyAI offers a range of features designed to provide actionable insights into your AI search presence. Users can track their brand&#39;s visibility across multiple AI platforms, analyze performance metrics, and identify areas for improvement. The platform allows for real-time monitoring, enabling users to adapt their strategies promptly based on the latest data. Additionally, OtterlyAI&#39;s optimization tools help refine content and SEO strategies, ensuring that users can effectively engage with their target audience in an AI-driven environment. One of the key benefits of OtterlyAI is its ability to provide a comprehensive overview of how brands are represented across various AI search platforms. This feature not only highlights visibility but also offers insights into user engagement and conversion rates. By understanding how users interact with AI search results, businesses can tailor their content and marketing strategies to better meet the needs of their audience. This level of insight is essential for maximizing ROI and ensuring that marketing efforts are aligned with current trends in user behavior. Overall, OtterlyAI stands out in the realm of AI search monitoring and optimization by offering a robust suite of tools that empower users to navigate the complexities of AI-driven search landscapes. With its focus on actionable insights and real-time data, the platform equips SEO and marketing professionals with the knowledge they need to enhance their online presence and drive meaningful conversions.


[Visit website](https://www.g2.com/external_clickthroughs/record?secure%5Bad_program%5D=ppc&amp;secure%5Bad_slot%5D=category_product_list&amp;secure%5Bcategory_id%5D=620&amp;secure%5Bchosen_at%5D=2026-07-06T11%3A54%3A19Z&amp;secure%5Bdisplayable_resource_id%5D=1010585&amp;secure%5Bdisplayable_resource_type%5D=Category&amp;secure%5Bmedium%5D=sponsored&amp;secure%5Bplacement_reason%5D=retargeted_product&amp;secure%5Bplacement_resource_ids%5D%5B%5D=1443487&amp;secure%5Bprioritized%5D=false&amp;secure%5Bproduct_id%5D=1443487&amp;secure%5Bresource_id%5D=620&amp;secure%5Bresource_type%5D=Category&amp;secure%5Bsource_type%5D=category_page&amp;secure%5Bsource_url%5D=https%3A%2F%2Fwww.g2.com%2Fcategories%2Fanalytics-platforms%3Fpage%3D5%26platform%3Dhootsuite&amp;secure%5Btoken%5D=a7d47562011dbcce29081cf16b4ad29c68c94ee4e6a0e544ea13eac06e45d1fd&amp;secure%5Burl%5D=https%3A%2F%2Fotterly.ai%3Futm_source%3Dg2%26utm_medium%3Dg2%26utm_campaign%3Dppc&amp;secure%5Burl_type%5D=custom_url)

---

## What Are the Top-Rated Analytics Platforms Products in 2026?
### 1. [Precisely Data360 Analyze](https://www.g2.com/products/precisely-data360-analyze/reviews)
Agile data management and analytic software that transforms how companies tackle data challenges to achieve breakthrough business results.


**Average Rating:** 4.3/5.0
**Total Reviews:** 4
**How Do G2 Users Rate Precisely Data360 Analyze?**

- **Has the product been a good partner in doing business?:** 8.3/10 (Category avg: 9.1/10)
- **Steps to Answer:** 5.6/10 (Category avg: 8.4/10)
- **Reports Interface:** 5.6/10 (Category avg: 8.7/10)
- **Calculated Fields:** 8.9/10 (Category avg: 8.5/10)

**Who Is the Company Behind Precisely Data360 Analyze?**

- **Seller:** [Precisely](https://www.g2.com/sellers/precisely-0b25c016-ffa5-4f51-9d9e-fcbc9f54cc55)
- **HQ Location:** Burlington, Massachusetts
- **Twitter:** @PreciselyData (3,963 Twitter followers)
- **LinkedIn® Page:** https://www.linkedin.com/company/64863146/ (3,006 employees on LinkedIn®)

**Who Uses This Product?**
- **Company Size:** 50% Small-Business, 25% Enterprise


#### What Are Recent G2 Reviews of Precisely Data360 Analyze?

**"[One Stop Solution For Data Scientist](https://www.g2.com/survey_responses/precisely-data360-analyze-review-9619555)"**

**Rating:** 5.0/5.0 stars
*— Rajiv K.*

[Read full review](https://www.g2.com/survey_responses/precisely-data360-analyze-review-9619555)

---

**"[Perfect solution for Data Analysis](https://www.g2.com/survey_responses/precisely-data360-analyze-review-8918242)"**

**Rating:** 5.0/5.0 stars
*— Munavvar M.*

[Read full review](https://www.g2.com/survey_responses/precisely-data360-analyze-review-8918242)

---


#### What Are G2 Users Discussing About Precisely Data360 Analyze?

- [What is Infogix Data360 Analyze® used for?](https://www.g2.com/discussions/what-is-infogix-data360-analyze-used-for)

### 2. [ScaiPlatform](https://www.g2.com/products/scaiplatform/reviews)
ScaiPlatform is a comprehensive business intelligence and data management solution designed to empower organizations with real-time data access and analytics. It seamlessly integrates with various SQL databases and data warehouses, enabling users to explore, manipulate, and visualize data without the need for coding. With its user-friendly interface, ScaiPlatform caters to both technical and non-technical users, facilitating efficient decision-making processes. Key Features and Functionality: - Real-Time Data Access: Connect instantly to multiple SQL data sources, allowing users to navigate schemas, tables, and views with up-to-date information. - Interactive Dashboards: Create and customize dashboards featuring tables, graphs, and single metrics from diverse data sources, enhancing data visualization and reporting. - Data Manipulation Tools: Perform operations such as joining, pivoting, and aggregating data, as well as adding, editing, and deleting records through a point-and-click interface, eliminating the need for coding. - Automation Capabilities: Automate reporting and workflow processes, reducing manual workload and ensuring timely data delivery. - User Access Control: Configure data visibility and access rights at the column level for different user roles, ensuring controlled transparency and security. Primary Value and User Solutions: ScaiPlatform addresses the challenge of accessing and analyzing real-time data across multiple sources without extensive technical expertise. By providing a centralized platform for data exploration, visualization, and management, it enables organizations to make informed, data-driven decisions efficiently. The platform&#39;s automation features further streamline reporting and workflow processes, significantly reducing manual effort and enhancing productivity. With its intuitive design and robust functionality, ScaiPlatform empowers users at all levels to harness the full potential of their data assets.


**Average Rating:** 4.3/5.0
**Total Reviews:** 5
**How Do G2 Users Rate ScaiPlatform?**

- **Has the product been a good partner in doing business?:** 7.2/10 (Category avg: 9.1/10)
- **Steps to Answer:** 6.7/10 (Category avg: 8.4/10)
- **Reports Interface:** 8.3/10 (Category avg: 8.7/10)
- **Calculated Fields:** 8.3/10 (Category avg: 8.5/10)

**Who Is the Company Behind ScaiPlatform?**

- **Seller:** [ScaiData](https://www.g2.com/sellers/scaidata)
- **Year Founded:** 2017
- **HQ Location:** Foster City, US
- **LinkedIn® Page:** https://www.linkedin.com/company/scaidata/ (1 employees on LinkedIn®)

**Who Uses This Product?**
- **Company Size:** 50% Small-Business, 33% Enterprise


#### What Are ScaiPlatform's Pros and Cons?

**Pros:**

- Ease of Use (2 reviews)
- Adaptability (1 reviews)
- Automation (1 reviews)
- Deployment Ease (1 reviews)
- Detailed Analysis (1 reviews)

**Cons:**

- Complexity (1 reviews)
- Complex Usage (1 reviews)
- Confusing Pricing (1 reviews)
- Learning Curve (1 reviews)
- Learning Difficulty (1 reviews)


### What Do G2 Reviewers Say About ScaiPlatform?
*AI-generated summary from verified user reviews*

**Pros:**

- Users find ScaiPlatform to be **easy to use** , simplifying workflows and enhancing efficiency for developers and data scientists.
- Users value the **adaptability** of ScaiPlatform, which streamlines AI model development and scaling for teams.
- Users appreciate the **automation** features of ScaiPlatform, effectively streamlining workflows and saving valuable time.
- Users find ScaiPlatform offers **deployment ease** , streamlining the process of building and scaling AI models for developers.
- Users find ScaiPlatform to be a **valuable resource for detailed microbiology and agriculture research** , especially in plant diseases.

**Cons:**

- Users find the **complexity** of ScaiPlatform makes it less accessible for casual readers or beginners.
- Users find the **complex usage** of ScaiPlatform challenging, making it less accessible for casual readers and beginners.
- Users find the **trial period too short** , limiting their ability to fully evaluate ScaiPlatform&#39;s features.
- Users find the content of ScaiPlatform to be too **technical and inaccessible** for casual readers or beginners.
- The content on ScaiPlatform is **too technical** for general users, limiting accessibility for beginners and casual readers.

#### What Are Recent G2 Reviews of ScaiPlatform?

**"[Research on microbiology](https://www.g2.com/survey_responses/scaiplatform-review-10555472)"**

**Rating:** 4.0/5.0 stars
*— Venkata Lakshmi S.*

[Read full review](https://www.g2.com/survey_responses/scaiplatform-review-10555472)

---

**"[A fantastic and user-friendly platform for our needs.](https://www.g2.com/survey_responses/scaiplatform-review-11439690)"**

**Rating:** 4.5/5.0 stars
*— Yash R.*

[Read full review](https://www.g2.com/survey_responses/scaiplatform-review-11439690)

---


### 3. [Slingshot](https://www.g2.com/products/infragistics-slingshot/reviews)
Slingshot’s AI-driven platform can revolutionize how your business accesses and utilizes data. Consolidate insights from your sales, marketing, and CRM systems into one single source of truth. AI custom-trained on your business lets you ask questions, get immediate answers, and ensure every employee works from the same verified actionable information. Simplify analytics, enhance operational efficiency, go to market faster, and stay ahead of the competition.


**Average Rating:** 4.6/5.0
**Total Reviews:** 13
**How Do G2 Users Rate Slingshot?**

- **Has the product been a good partner in doing business?:** 8.3/10 (Category avg: 9.1/10)
- **Steps to Answer:** 8.9/10 (Category avg: 8.4/10)
- **Reports Interface:** 10.0/10 (Category avg: 8.7/10)
- **Calculated Fields:** 10.0/10 (Category avg: 8.5/10)

**Who Is the Company Behind Slingshot?**

- **Seller:** [Infragistics](https://www.g2.com/sellers/infragistics)
- **Year Founded:** 1989
- **HQ Location:** Cranbury, NJ
- **Twitter:** @infragistics (36,861 Twitter followers)
- **LinkedIn® Page:** https://www.linkedin.com/company/16069/ (188 employees on LinkedIn®)

**Who Uses This Product?**
- **Company Size:** 69% Small-Business, 38% Mid-Market


#### What Are Slingshot's Pros and Cons?

**Pros:**

- Ease of Use (8 reviews)
- Analytics (7 reviews)
- Efficiency (7 reviews)
- Data Management (5 reviews)
- Time-Saving (5 reviews)

**Cons:**

- Bug Issues (2 reviews)
- Bugs (2 reviews)
- Limited Visibility (2 reviews)
- Slow Performance (2 reviews)
- Access Control (1 reviews)


### What Do G2 Reviewers Say About Slingshot?
*AI-generated summary from verified user reviews*

**Pros:**

- Users appreciate the **ease of use** of Slingshot, allowing for efficient work management and seamless collaboration.
- Users appreciate the **powerful analytics** of Slingshot, enhancing work management and informed decision-making with accurate data insights.
- Users find Slingshot to be a **highly efficient tool** that streamlines work processes and enhances productivity.
- Users praise Slingshot for its **efficient data management** , enhancing productivity through easy collaboration and timely reminders.
- Users find Slingshot to be a **time-saving tool** that boosts productivity and simplifies project management efficiently.

**Cons:**

- Users experience **frequent bugs** with Slingshot, including connection issues and delays in displaying links in chats.
- Users experience **frequent bugs** in Slingshot, including connection issues and slow link visibility in chats.
- Users find **limited visibility** in Slingshot, as it lacks a unified project view and can be buggy at times.
- Users find the **slow performance** of Slingshot frustrating, making interpretation and analysis difficult during use.
- Users find the **time-consuming 2-factor authentication** process and minor bugs frustrating while using Slingshot.

#### What Are Recent G2 Reviews of Slingshot?

**"[Slingshot helps us find and use business data faster!](https://www.g2.com/survey_responses/slingshot-review-9931497)"**

**Rating:** 4.5/5.0 stars
*— Heinz V.*

[Read full review](https://www.g2.com/survey_responses/slingshot-review-9931497)

---

**"[Great work management and BI tool](https://www.g2.com/survey_responses/slingshot-review-7912213)"**

**Rating:** 5.0/5.0 stars
*— Alex A.*

[Read full review](https://www.g2.com/survey_responses/slingshot-review-7912213)

---


### 4. [SplashBI](https://www.g2.com/products/splashbi/reviews)
SplashBI helps organizations make the very best business decisions by providing instant access to data from disparate systems in the form of reports, visualizations, &amp; trends. The SplashBI solution is available in the cloud or on-premise and easily accessible via mobile devices. From HR People Analytics to Finance, Month End &amp; Year End Reporting, to Sales &amp; Marketing Trends / Dashboards, and much more, SplashBI offers insightful pre-built content, powerful ad-hoc reporting, and in-depth dashboards, for immediate ROI. Finally, SplashBI’s data models allow for fast-track-low-cost implementations. Blend, report, visualize, and analyze ALL your data in a single platform, SplashBI. Let your data help drive your business.


**Average Rating:** 4.5/5.0
**Total Reviews:** 4
**How Do G2 Users Rate SplashBI?**

- **Steps to Answer:** 9.2/10 (Category avg: 8.4/10)
- **Reports Interface:** 7.5/10 (Category avg: 8.7/10)
- **Calculated Fields:** 6.7/10 (Category avg: 8.5/10)

**Who Is the Company Behind SplashBI?**

- **Seller:** [SplashBI](https://www.g2.com/sellers/splashbi)
- **Year Founded:** 2014
- **HQ Location:** Duluth, US
- **Twitter:** @SplashBI (4,010 Twitter followers)
- **LinkedIn® Page:** https://www.linkedin.com/company/splash-bi/ (375 employees on LinkedIn®)

**Who Uses This Product?**
- **Company Size:** 50% Enterprise, 50% Small-Business


#### What Are Recent G2 Reviews of SplashBI?

**"[Honest review of SplashBI](https://www.g2.com/survey_responses/splashbi-review-9782068)"**

**Rating:** 4.5/5.0 stars
*— Lekhashree H.*

[Read full review](https://www.g2.com/survey_responses/splashbi-review-9782068)

---

**"[Best BI and data visualisation tool in market](https://www.g2.com/survey_responses/splashbi-review-7632158)"**

**Rating:** 4.5/5.0 stars
*— Gaurang S.*

[Read full review](https://www.g2.com/survey_responses/splashbi-review-7632158)

---


#### What Are G2 Users Discussing About SplashBI?

- [What is SplashBI used for?](https://www.g2.com/discussions/what-is-splashbi-used-for)

### 5. [Supersimple](https://www.g2.com/products/supersimple/reviews)
Supersimple is an AI-native business intelligence platform that answers questions using both your data and your company&#39;s knowledge: metrics, tables, and documents, all at once. It connects to your data warehouse, data and code context (dbt, GitHub) and to the tools where your knowledge lives (Slack, Notion, Google Drive, Confluence, and more). Every answer is grounded with citations and no-code steps, instead of difficult-to-read code &amp; queries. Governed semantic data models create a single source of truth, while ensuring flexible and reliable self-service.


**Average Rating:** 4.4/5.0
**Total Reviews:** 18
**How Do G2 Users Rate Supersimple?**

- **Has the product been a good partner in doing business?:** 8.3/10 (Category avg: 9.1/10)
- **Steps to Answer:** 8.5/10 (Category avg: 8.4/10)
- **Reports Interface:** 8.9/10 (Category avg: 8.7/10)
- **Calculated Fields:** 9.0/10 (Category avg: 8.5/10)

**Who Is the Company Behind Supersimple?**

- **Seller:** [Supersimple](https://www.g2.com/sellers/supersimple)
- **Year Founded:** 2021
- **HQ Location:** N/A
- **LinkedIn® Page:** https://www.linkedin.com/company/gosupersimple/ (10 employees on LinkedIn®)

**Who Uses This Product?**
- **Company Size:** 67% Small-Business, 28% Mid-Market


#### What Are Supersimple's Pros and Cons?

**Pros:**

- Ease of Use (12 reviews)
- Useful (8 reviews)
- Insights (5 reviews)
- AI Integration (4 reviews)
- Implementation Ease (3 reviews)

**Cons:**

- Expensive Pricing (4 reviews)
- Expensive (3 reviews)
- Learning Curve (2 reviews)
- Learning Difficulty (2 reviews)
- Pro Version Issues (2 reviews)


### What Do G2 Reviewers Say About Supersimple?
*AI-generated summary from verified user reviews*

**Pros:**

- Users find Supersimple&#39;s **ease of use** transformative, making data exploration accessible for all team members.
- Users find Supersimple **extremely easy to use** , transforming data exploration and empowering teams regardless of coding skills.
- Users value the **easy-to-use AI analytics** of Supersimple, enabling intuitive data exploration for all team members.
- Users love the **AI integration** in Supersimple, enabling quick, easy data queries without coding for enhanced understanding.
- Users find **implementation easy** with Supersimple, enabling quick setup and seamless integration into their workflow.

**Cons:**

- Users find the **pricing too high** , especially for startups looking to integrate Supersimple into their operations.
- Users find Supersimple&#39;s pricing to be **too expensive** , especially for startups seeking cost-effective solutions.
- Users find the initial **learning curve** for Supersimple somewhat demanding, especially lacking clarity for newcomers to data tools.
- Users find the **learning difficulty** of Supersimple to be somewhat demanding for those without prior experience in data analysis.
- Users face **pro version issues** due to unclear pricing, learning curves, and limitations without the paid service.

#### What Are Recent G2 Reviews of Supersimple?

**"[Enabling the end user with abilities to explore data in a friendly and easy manner](https://www.g2.com/survey_responses/supersimple-review-9802995)"**

**Rating:** 4.0/5.0 stars
*— KUMAR KASHISH K.*

[Read full review](https://www.g2.com/survey_responses/supersimple-review-9802995)

---

**"[Interesting product for B2B SaaS](https://www.g2.com/survey_responses/supersimple-review-9801484)"**

**Rating:** 4.0/5.0 stars
*— Maria N.*

[Read full review](https://www.g2.com/survey_responses/supersimple-review-9801484)

---


### 6. [Ada.im](https://www.g2.com/products/ada-im/reviews)
Product Overview Ada.im is the world&#39;s first AI-powered data analyst that transforms complex datasets into professional, actionable reports in minutes. Built for business analysts, data scientists, marketing teams, finance professionals, and executives, Ada eliminates tedious manual processes and makes advanced data intelligence accessible to everyone who works with data. What Ada Does Ada automates the entire data analysis workflow—from data cleaning and SQL generation to comprehensive report creation. Simply upload your data, ask questions in natural language, and receive professional insights instantly. No coding required. Key Features Automated Data Processing Intelligent data cleaning handles messy data, missing values, and inconsistencies automatically Multi-source integration analyzes data from Excel, databases, APIs, and web sources seamlessly Smart exploration tools for rapid pattern discovery Advanced AI Capabilities Natural language queries—ask questions in plain English Automated SQL generation using cutting-edge Large Language Models Professional report generation with charts, insights, and actionable recommendations Multilingual code support including Python and SQL User-Friendly Workflow One-click analysis transforms raw data into insights with minimal effort Easy export options in common formats Intuitive interface for both technical and non-technical users Fast results—complete analysis in minutes instead of hours Business Value Time Savings: Transform hours of manual data work into minutes of automated processing, freeing analysts to focus on strategic decision-making rather than repetitive tasks. Accessibility: Makes sophisticated data analysis accessible to professionals without deep technical expertise or coding knowledge. Accuracy: Reduces human error in data cleaning, query writing, and analysis through AI-powered automation. Cost Efficiency: Reduce time and resources required for routine data tasks while improving output quality. Common Use Cases Sales Analysis: Track trends, forecast revenue, and analyze performance across regions Marketing ROI: Measure campaign effectiveness and optimize budget allocation Financial Forecasting: Generate projections and budget variance analysis Operations Monitoring: Track KPIs, identify bottlenecks, and improve efficiency Customer Analytics: Understand behavior patterns, segment customers, and reduce churn Getting Started Ada is available for enterprises and individual professionals. Visit ada.im to experience the future of data analysis and transform how your organization works with data.


**Average Rating:** 4.7/5.0
**Total Reviews:** 3
**How Do G2 Users Rate Ada.im?**

- **Steps to Answer:** 9.4/10 (Category avg: 8.4/10)
- **Reports Interface:** 9.4/10 (Category avg: 8.7/10)
- **Calculated Fields:** 7.8/10 (Category avg: 8.5/10)

**Who Is the Company Behind Ada.im?**

- **Seller:** [Ada.im](https://www.g2.com/sellers/ada-im)
- **HQ Location:** SINGAPORE, SG
- **LinkedIn® Page:** https://www.linkedin.com/company/ada-im/ (7 employees on LinkedIn®)

**Who Uses This Product?**
- **Company Size:** 67% Mid-Market, 33% Small-Business


#### What Are Ada.im's Pros and Cons?

**Pros:**

- Ease of Understanding (2 reviews)
- Efficiency (2 reviews)
- Intuition (2 reviews)
- Automation (1 reviews)
- Data Analysis (1 reviews)

**Cons:**

- Performance Issues (1 reviews)
- Slow Performance (1 reviews)


### What Do G2 Reviewers Say About Ada.im?
*AI-generated summary from verified user reviews*

**Pros:**

- Users value the **clear and human-like explanations** from Ada.im, making data insights accessible for all team members.
- Users highlight the **efficiency** of Ada.im, significantly saving time with automated data analysis and reporting.
- Users find Ada.im&#39;s interface **clean and intuitive** , allowing easy navigation even for first-time users.
- Users appreciate the **time-saving automation** of Ada.im, streamlining data tasks and enhancing team productivity effectively.
- Users find Ada.im&#39;s **no-code interface and intuitive experience** transformative for efficient data analysis and insights.

**Cons:**

- Users express frustration with **performance issues** due to slow report generation, especially in deep mode.
- Users experience **slightly slower performance** when uploading very large datasets, impacting their overall efficiency.

#### What Are Recent G2 Reviews of Ada.im?

**"[Ada.im is the new data analysis paradigm.](https://www.g2.com/survey_responses/ada-im-review-11794689)"**

**Rating:** 4.5/5.0 stars
*— Li K.*

[Read full review](https://www.g2.com/survey_responses/ada-im-review-11794689)

---

**"[Ada.im Automates Data Tasks and Delivers Clear, Human-Like Insights](https://www.g2.com/survey_responses/ada-im-review-11802518)"**

**Rating:** 5.0/5.0 stars
*— MENG M.*

[Read full review](https://www.g2.com/survey_responses/ada-im-review-11802518)

---


### 7. [Aible](https://www.g2.com/products/aible/reviews)
Aible is an intuitive AutoML tool that enables your business team to create high-quality custom AI models focused on maximizing Business Impact. No training, no consulting required.


**Average Rating:** 3.8/5.0
**Total Reviews:** 3
**How Do G2 Users Rate Aible?**

- **Has the product been a good partner in doing business?:** 8.3/10 (Category avg: 9.1/10)
- **Steps to Answer:** 9.2/10 (Category avg: 8.4/10)
- **Reports Interface:** 9.2/10 (Category avg: 8.7/10)
- **Calculated Fields:** 6.7/10 (Category avg: 8.5/10)

**Who Is the Company Behind Aible?**

- **Seller:** [Aible](https://www.g2.com/sellers/aible)
- **Year Founded:** 2018
- **HQ Location:** Pleasanton, US
- **Twitter:** @iamAible (400 Twitter followers)
- **LinkedIn® Page:** https://www.linkedin.com/company/aible/ (47 employees on LinkedIn®)

**Who Uses This Product?**
- **Company Size:** 75% Enterprise, 25% Small-Business


#### What Are Recent G2 Reviews of Aible?

**"[Changes Fast and User Friendly Platform](https://www.g2.com/survey_responses/aible-review-12975179)"**

**Rating:** 4.0/5.0 stars
*— Prem M.*

[Read full review](https://www.g2.com/survey_responses/aible-review-12975179)

---

**"[Easy-to-Use Platform for Data-Driven Decision Making](https://www.g2.com/survey_responses/aible-review-12973024)"**

**Rating:** 5.0/5.0 stars
*— Swaroop W.*

[Read full review](https://www.g2.com/survey_responses/aible-review-12973024)

---


### 8. [AnswerRocket](https://www.g2.com/products/answerrocket/reviews)
AnswerRocket supports some of the largest brands in the world with augmented analytics. Users type or speak business questions and get answers instantly. Answers are provided as interactive visualizations, accompanied with AI-generated insights that can be drilled into for deeper exploration.


**Average Rating:** 4.3/5.0
**Total Reviews:** 3
**How Do G2 Users Rate AnswerRocket?**

- **Steps to Answer:** 10.0/10 (Category avg: 8.4/10)
- **Reports Interface:** 10.0/10 (Category avg: 8.7/10)
- **Calculated Fields:** 10.0/10 (Category avg: 8.5/10)

**Who Is the Company Behind AnswerRocket?**

- **Seller:** [AnswerRocket](https://www.g2.com/sellers/answerrocket)
- **Year Founded:** 2013
- **HQ Location:** Atlanta, Georgia, United States
- **Twitter:** @AnswerRocket (557 Twitter followers)
- **LinkedIn® Page:** https://www.linkedin.com/company/answerrocket/ (45 employees on LinkedIn®)

**Who Uses This Product?**
- **Company Size:** 67% Mid-Market, 33% Enterprise


#### What Are Recent G2 Reviews of AnswerRocket?

**"[Like having Google for your data](https://www.g2.com/survey_responses/answerrocket-review-744119)"**

**Rating:** 5.0/5.0 stars
*— Scott N.*

[Read full review](https://www.g2.com/survey_responses/answerrocket-review-744119)

---

**"[I have had a positive experience with AR.](https://www.g2.com/survey_responses/answerrocket-review-744094)"**

**Rating:** 5.0/5.0 stars
*— Taylor S.*

[Read full review](https://www.g2.com/survey_responses/answerrocket-review-744094)

---


#### What Are G2 Users Discussing About AnswerRocket?

- [What is AnswerRocket used for?](https://www.g2.com/discussions/what-is-answerrocket-used-for)

### 9. [BiCXO](https://www.g2.com/products/bicxo/reviews)
BiCXO is a completely automated business intelligence solution, by which you can track your finances, operational metrics, data visualization and do lots more at a click of a button.


**Average Rating:** 4.2/5.0
**Total Reviews:** 3
**How Do G2 Users Rate BiCXO?**

- **Has the product been a good partner in doing business?:** 6.7/10 (Category avg: 9.1/10)
- **Steps to Answer:** 7.5/10 (Category avg: 8.4/10)
- **Reports Interface:** 8.3/10 (Category avg: 8.7/10)
- **Calculated Fields:** 8.3/10 (Category avg: 8.5/10)

**Who Is the Company Behind BiCXO?**

- **Seller:** [Bicxo](https://www.g2.com/sellers/bicxo)
- **Year Founded:** 2017
- **HQ Location:** Thane, IN
- **LinkedIn® Page:** https://www.linkedin.com/company/bicxo-assisted-bi-solution (11 employees on LinkedIn®)

**Who Uses This Product?**
- **Company Size:** 67% Enterprise, 33% Small-Business


#### What Are Recent G2 Reviews of BiCXO?

**"[Pros and Cons](https://www.g2.com/survey_responses/bicxo-review-6525151)"**

**Rating:** 4.0/5.0 stars
*— Rupam P.*

[Read full review](https://www.g2.com/survey_responses/bicxo-review-6525151)

---

**"[BiCXO is great for my Retail Business Intelligence solutions!](https://www.g2.com/survey_responses/bicxo-review-5076940)"**

**Rating:** 4.0/5.0 stars
*— Ramkumar N.*

[Read full review](https://www.g2.com/survey_responses/bicxo-review-5076940)

---


#### What Are G2 Users Discussing About BiCXO?

- [What is BiCXO used for?](https://www.g2.com/discussions/what-is-bicxo-used-for)

### 10. [bipp Analytics](https://www.g2.com/products/bipp-analytics/reviews)
bipp is a modern, cloud business intelligence platform that lets you explore billions of records in real-time. Simply connect your datasource, and build reusable data models with our Data Modeling Layer. Or explore your data with Visual SQL Data Explorer and create charts and dashboards in minutes. Ad-hoc or self-service reporting lets users slice and dice data to source trusted insights that drive business decisions. Insights can easily be shared through scheduled reports, data-based alerts, or embedded in applications.


**Average Rating:** 5.0/5.0
**Total Reviews:** 3
**How Do G2 Users Rate bipp Analytics?**

- **Has the product been a good partner in doing business?:** 9.2/10 (Category avg: 9.1/10)
- **Steps to Answer:** 8.3/10 (Category avg: 8.4/10)
- **Reports Interface:** 10.0/10 (Category avg: 8.7/10)
- **Calculated Fields:** 10.0/10 (Category avg: 8.5/10)

**Who Is the Company Behind bipp Analytics?**

- **Seller:** [BIPP](https://www.g2.com/sellers/bipp)
- **Year Founded:** 2017
- **HQ Location:** Wilmington, US
- **Twitter:** @bippanalytics (99 Twitter followers)
- **LinkedIn® Page:** https://www.linkedin.com/company/bipp-analytics/ (9 employees on LinkedIn®)

**Who Uses This Product?**
- **Company Size:** 67% Small-Business, 33% Mid-Market


#### What Are Recent G2 Reviews of bipp Analytics?

**"[Bipp is a next gen BI Platform](https://www.g2.com/survey_responses/bipp-analytics-review-4986256)"**

**Rating:** 5.0/5.0 stars
*— Anuradha V.*

[Read full review](https://www.g2.com/survey_responses/bipp-analytics-review-4986256)

---

**"[Powerful easy to use data analytics platform for non-technical users](https://www.g2.com/survey_responses/bipp-analytics-review-4988504)"**

**Rating:** 5.0/5.0 stars
*— Verified User in Architecture &amp; Planning*

[Read full review](https://www.g2.com/survey_responses/bipp-analytics-review-4988504)

---


#### What Are G2 Users Discussing About bipp Analytics?

- [What is BIPP Business Intelligence Platform used for?](https://www.g2.com/discussions/what-is-bipp-business-intelligence-platform-used-for)

### 11. [Bright Analytics](https://www.g2.com/products/bright-analytics/reviews)
Bright Analytics is a modern, powerful business intelligence and data visualisation platform designed for customisation. We take the time to understand our customers&#39; needs and deliver tailored solutions that evolve and scale over time, whilst our implementation team provide support the way you want it, from live chat and Slack to on-site support. 50+ data connectors, new integrations added regularly, with ability to quickly integrate new data sources on client request. No limit on number of data sources that can be integrated for a client. Connects to third-party data sources as well as a client&#39;s existing data warehouse, whether in cloud or on-premise. Extensive range of visualisations available, from pies and donuts to multi-stacked bars and columns, drill-down tables, heat maps, geo-location maps, statement reports, selection of custom visualisations including path-analysis and gantt / timeline view, custom scorecards with configurable thresholds, configurable colour palettes; metric-level icon customisation. Bespoke service to assist clients in understanding their needs and developing custom visualisations, or new features as required. Bright Analytics is built on an enterprise-grade sharing and permissions layer: customers can create any number of groups; nest groups to create super-groups; intersection groups to bring together people who inhabit all child groups; assign specific feature access to users or groups; deny access to content for people in certain groups; assign content access level, such as view / edit / explore, to specific users or groups. Customer Support: - Out of Hours / Business Hours - Online Knowledge base - In Person / On site - Live Chat - Slack - Email - Telephone


**Average Rating:** 4.3/5.0
**Total Reviews:** 3
**How Do G2 Users Rate Bright Analytics?**

- **Has the product been a good partner in doing business?:** 8.3/10 (Category avg: 9.1/10)
- **Steps to Answer:** 8.3/10 (Category avg: 8.4/10)
- **Reports Interface:** 9.4/10 (Category avg: 8.7/10)
- **Calculated Fields:** 8.9/10 (Category avg: 8.5/10)

**Who Is the Company Behind Bright Analytics?**

- **Seller:** [Bright Analytics](https://www.g2.com/sellers/bright-analytics)
- **Year Founded:** 2010
- **HQ Location:** London, GB
- **Twitter:** @brightanalytics (99 Twitter followers)
- **LinkedIn® Page:** https://www.linkedin.com/company/bright-analytics/ (12 employees on LinkedIn®)

**Who Uses This Product?**
- **Company Size:** 33% Enterprise, 33% Mid-Market


#### What Are Recent G2 Reviews of Bright Analytics?

**"[Powerful Drill-Down Capabilities](https://www.g2.com/survey_responses/bright-analytics-review-6725189)"**

**Rating:** 4.0/5.0 stars
*— Ankit S.*

[Read full review](https://www.g2.com/survey_responses/bright-analytics-review-6725189)

---

**"[Combines unlimited data sources with in a single platform](https://www.g2.com/survey_responses/bright-analytics-review-6866191)"**

**Rating:** 4.5/5.0 stars
*— Verified User in Security and Investigations*

[Read full review](https://www.g2.com/survey_responses/bright-analytics-review-6866191)

---


#### What Are G2 Users Discussing About Bright Analytics?

- [What is Bright Analytics used for?](https://www.g2.com/discussions/what-is-bright-analytics-used-for)

### 12. [DataClarity](https://www.g2.com/products/dataclarity/reviews)
DataClarity Unlimited Analytics is the only free modern embeddable data and analytics platform in the world that provides a self-service, powerful, secure and seamless end-to-end experience. DataClarity Unlimited Analytics Highlights · Simplified Data Integration – Easily connect, join, curate, cache, and catalog diverse data through drag and drop experience, custom SQL builder, and AI-powered data profiling. · Interactive Storyboards – Craft compelling storyboards using 80 stunning visualizations, geospatial maps, and flexibility to bring your own charts. · Real-time Analysis – Perform advanced analysis and data exploration using drill-down, drill-through, filters, built-in statistical and predictive models, and leverage your own Python and R code. · Seamless Application Integration – Achieve smooth integration with versatile APIs, tailor-made configurations, and flexible embedding features. · Security &amp; Governance – Ensure adherence to your security guidelines, governance standards, multitenancy, row-level data protection, and Single Sign-On (SSO) capabilities. About DataClarity DataClarity is a trailblazing innovator of embedded self-service data and analytics. With an unwavering commitment to delivering groundbreaking capabilities that bring unparalleled value to ISV’s, SaaS providers, consultancies, and IT teams, DataClarity is reshaping industries through its forward-thinking solutions and pioneering business model.


**Average Rating:** 4.9/5.0
**Total Reviews:** 5
**How Do G2 Users Rate DataClarity?**

- **Has the product been a good partner in doing business?:** 10.0/10 (Category avg: 9.1/10)
- **Steps to Answer:** 9.3/10 (Category avg: 8.4/10)
- **Reports Interface:** 9.3/10 (Category avg: 8.7/10)
- **Calculated Fields:** 9.7/10 (Category avg: 8.5/10)

**Who Is the Company Behind DataClarity?**

- **Seller:** [DataClarity Corporation](https://www.g2.com/sellers/dataclarity-corporation)
- **Year Founded:** 2002
- **HQ Location:** Raleigh, US
- **Twitter:** @DataClarity (263 Twitter followers)
- **LinkedIn® Page:** https://www.linkedin.com/company/dataclarity-corporation/ (23 employees on LinkedIn®)

**Who Uses This Product?**
- **Company Size:** 60% Mid-Market, 20% Enterprise


#### What Are Recent G2 Reviews of DataClarity?

**"[Effortless Integration and Powerful Analytics!](https://www.g2.com/survey_responses/dataclarity-review-9934154)"**

**Rating:** 5.0/5.0 stars
*— Peter S.*

[Read full review](https://www.g2.com/survey_responses/dataclarity-review-9934154)

---

**"[Rich and easy to use analytics platform](https://www.g2.com/survey_responses/dataclarity-review-9224833)"**

**Rating:** 5.0/5.0 stars
*— Elvis  F.*

[Read full review](https://www.g2.com/survey_responses/dataclarity-review-9224833)

---


### 13. [DataSquirrel](https://www.g2.com/products/datasquirrel/reviews)
DataSquirrel saves you time, stress, and pain when understanding data, creating clear visuals and dashboard reports. Auto-Clean. Auto-Analyse. Auto-Visualise. Auto-Repeat. It&#39;s: Quick, Easy, Guided, AI assisted and Secure. DataSquirrel is the go-to Business Intelligence platform for individuals &amp; teams who want to make sense of any data and make decisions independently! No tech skills required to use it, or to get started. Simply upload your data and let DataSquirrel do the rest! ✓ Explore spontaneous data needs by uploading any data ✓ Auto clean for accuracy ✓ Discover patterns using AI suggested analysis ✓ No more VLookup! Combine data in one click ✓ Customise visuals as you like ✓ Download cleaned file and dashboard reports ✓ Share/Collaborate without login


**Average Rating:** 4.3/5.0
**Total Reviews:** 3
**How Do G2 Users Rate DataSquirrel?**

- **Has the product been a good partner in doing business?:** 10.0/10 (Category avg: 9.1/10)
- **Steps to Answer:** 8.9/10 (Category avg: 8.4/10)
- **Reports Interface:** 8.9/10 (Category avg: 8.7/10)
- **Calculated Fields:** 9.4/10 (Category avg: 8.5/10)

**Who Is the Company Behind DataSquirrel?**

- **Seller:** [DataSquirrel](https://www.g2.com/sellers/datasquirrel)
- **Year Founded:** 2021
- **HQ Location:** Singapore, SG
- **LinkedIn® Page:** https://www.linkedin.com/company/datasquirrel-ai (3 employees on LinkedIn®)

**Who Uses This Product?**
- **Company Size:** 67% Small-Business, 33% Mid-Market


#### What Are Recent G2 Reviews of DataSquirrel?

**"[Easy to use!](https://www.g2.com/survey_responses/datasquirrel-review-9878747)"**

**Rating:** 4.0/5.0 stars
*— dianelys H.*

[Read full review](https://www.g2.com/survey_responses/datasquirrel-review-9878747)

---

**"[Fast &amp; guided analysis and reporting. Great alternative to Data Studio.](https://www.g2.com/survey_responses/datasquirrel-review-8965846)"**

**Rating:** 5.0/5.0 stars
*— Clare P.*

[Read full review](https://www.g2.com/survey_responses/datasquirrel-review-8965846)

---


### 14. [Datazip](https://www.g2.com/products/datazip/reviews)
Discover Datazip, a comprehensive no-code data engineering solution designed for time-conscious analysts and operators. Simplify your data management process by consolidating dispersed data sources, utilizing ETL, data warehousing, and transformation capabilities. With Datazip&#39;s intuitive platform, create a dependable, scalable data infrastructure in a mere 45 minutes. Experience swift data connections, robust querying, and smooth exporting to drive insightful decision-making.


**Average Rating:** 4.7/5.0
**Total Reviews:** 13
**How Do G2 Users Rate Datazip?**

- **Has the product been a good partner in doing business?:** 9.4/10 (Category avg: 9.1/10)
- **Steps to Answer:** 9.2/10 (Category avg: 8.4/10)
- **Reports Interface:** 10.0/10 (Category avg: 8.7/10)
- **Calculated Fields:** 10.0/10 (Category avg: 8.5/10)

**Who Is the Company Behind Datazip?**

- **Seller:** [Datazip, Inc.](https://www.g2.com/sellers/datazip-inc)
- **Year Founded:** 2022
- **HQ Location:** Lewes, US
- **LinkedIn® Page:** https://www.linkedin.com/company/datazipio/ (26 employees on LinkedIn®)

**Who Uses This Product?**
- **Company Size:** 46% Small-Business, 31% Mid-Market


#### What Are Recent G2 Reviews of Datazip?

**"[Datazip platform is easy to use because it has a user-friendly interface(drag and drop option).](https://www.g2.com/survey_responses/datazip-review-7949232)"**

**Rating:** 5.0/5.0 stars
*— Sanjay  D.*

[Read full review](https://www.g2.com/survey_responses/datazip-review-7949232)

---

**"[Datazip is all about visibility!](https://www.g2.com/survey_responses/datazip-review-8191979)"**

**Rating:** 5.0/5.0 stars
*— Aakarsh Y.*

[Read full review](https://www.g2.com/survey_responses/datazip-review-8191979)

---


### 15. [Diver Platform](https://www.g2.com/products/dimensional-insight-diver-platform/reviews)
Dimensional Insight’s Diver Platform is a governed analytics and business intelligence platform that helps organizations turn complex data into trusted, actionable insights and build a reliable foundation for AI-driven decision-making. Designed for industries where accuracy, consistency, and accountability matter, Diver Platform combines data integration, business rules management, analytics, reporting, and self-service exploration in a single environment. Organizations use Diver Platform to connect disparate data sources, standardize definitions and metrics, and deliver secure, role-based access to analytics across teams. Unlike many BI tools that focus primarily on visualization, Diver Platform emphasizes data governance, validation, and explainability — helping organizations trust the numbers behind every decision. The platform supports operational, financial, and strategic analytics and integrates with modern cloud and on-premises data environments including SQL Server, Snowflake, and Databricks. Used across healthcare, manufacturing, distribution, finance, beverage alcohol, and other data-intensive industries, Dimensional Insight helps organizations reduce reporting complexity, improve decision-making, and create trusted, consistent data foundations for enterprise analytics and AI initiatives.


**Average Rating:** 4.7/5.0
**Total Reviews:** 3
**How Do G2 Users Rate Diver Platform?**

- **Reports Interface:** 10.0/10 (Category avg: 8.7/10)

**Who Is the Company Behind Diver Platform?**

- **Seller:** [Dimensional Insight](https://www.g2.com/sellers/dimensional-insight)
- **Year Founded:** 1989
- **HQ Location:** Burlington, US
- **Twitter:** @DI_tweet (3,512 Twitter followers)
- **LinkedIn® Page:** https://www.linkedin.com/company/dimensional-insight (87 employees on LinkedIn®)
- **Phone:** 781-229-9111

**Who Uses This Product?**
- **Company Size:** 67% Enterprise, 33% Mid-Market


#### What Are Recent G2 Reviews of Diver Platform?

**"[Easy-to-Use, High-Performance Platform with Fast, Accurate Support](https://www.g2.com/survey_responses/diver-platform-review-12893246)"**

**Rating:** 5.0/5.0 stars
*— Teresa W.*

[Read full review](https://www.g2.com/survey_responses/diver-platform-review-12893246)

---

**"[very good at Data Mining](https://www.g2.com/survey_responses/diver-platform-review-710527)"**

**Rating:** 4.5/5.0 stars
*— Nancy S.*

[Read full review](https://www.g2.com/survey_responses/diver-platform-review-710527)

---


#### What Are G2 Users Discussing About Diver Platform?

- [What is The Diver Platform used for?](https://www.g2.com/discussions/what-is-the-diver-platform-used-for)

### 16. [Gyana](https://www.g2.com/products/gyana/reviews)
Gyana is an easy to use, drag&#39;n&#39;drop report and dashboard builder, powered by data science tools, so that your data reporting is covered end to end. Bring in any sort of spreadsheet or connect one of your cloud tools or databases, prepare your data in clicks, create insights and share them with your clients, teams and stakeholder. Gyana is for every industry and almost any role. It makes aggregating data safely an intuitive task, and it completely erase the tedious and repetitive tasks required for regular reporting.


**Average Rating:** 4.2/5.0
**Total Reviews:** 3
**How Do G2 Users Rate Gyana?**

- **Has the product been a good partner in doing business?:** 9.2/10 (Category avg: 9.1/10)
- **Steps to Answer:** 8.3/10 (Category avg: 8.4/10)
- **Reports Interface:** 6.7/10 (Category avg: 8.7/10)
- **Calculated Fields:** 6.7/10 (Category avg: 8.5/10)

**Who Is the Company Behind Gyana?**

- **Seller:** [GYANA](https://www.g2.com/sellers/gyana)
- **Year Founded:** 2015
- **HQ Location:** London, GB
- **LinkedIn® Page:** http://www.linkedin.com/company/gyana (29 employees on LinkedIn®)

**Who Uses This Product?**
- **Company Size:** 67% Small-Business, 33% Enterprise


#### What Are Recent G2 Reviews of Gyana?

**"[Every entrepreneur who wants to know their business situation clearly needs this tool.](https://www.g2.com/survey_responses/gyana-review-5298907)"**

**Rating:** 5.0/5.0 stars
*— Tammy C.*

[Read full review](https://www.g2.com/survey_responses/gyana-review-5298907)

---

**"[You can use Gyana for data-driven decision making.](https://www.g2.com/survey_responses/gyana-review-4894532)"**

**Rating:** 4.0/5.0 stars
*— Jean Bertin C.*

[Read full review](https://www.g2.com/survey_responses/gyana-review-4894532)

---


#### What Are G2 Users Discussing About Gyana?

- [What is Gyana used for?](https://www.g2.com/discussions/what-is-gyana-used-for)

### 17. [InsightBase](https://www.g2.com/products/kernex-limited-insightbase/reviews)
InsightBaseAI is a business intelligence tool that allows you to analyze your database using natural language, and build powerful analytics dashboards. It can be used by anyone at your organization, doesn&#39;t require SQL or programming skills.


**Average Rating:** 5.0/5.0
**Total Reviews:** 3
**How Do G2 Users Rate InsightBase?**

- **Has the product been a good partner in doing business?:** 10.0/10 (Category avg: 9.1/10)
- **Steps to Answer:** 9.2/10 (Category avg: 8.4/10)
- **Reports Interface:** 9.2/10 (Category avg: 8.7/10)
- **Calculated Fields:** 8.3/10 (Category avg: 8.5/10)

**Who Is the Company Behind InsightBase?**

- **Seller:** [Kernex Limited](https://www.g2.com/sellers/kernex-limited)
- **HQ Location:** London, GB
- **LinkedIn® Page:** https://www.linkedin.com/company/kernex-io/ (2 employees on LinkedIn®)

**Who Uses This Product?**
- **Company Size:** 100% Small-Business


#### What Are InsightBase's Pros and Cons?

**Pros:**

- Ease of Use (1 reviews)
- Tracking (1 reviews)
- User Interface (1 reviews)


### What Do G2 Reviewers Say About InsightBase?
*AI-generated summary from verified user reviews*

**Pros:**

- Users find InsightBase&#39;s **ease of use** exceptional, allowing effortless monitoring of data and reports with a clean UI.
- Users appreciate the **effortless tracking** capabilities of InsightBase, allowing easy monitoring of website growth and reports.
- Users love the **clean and easy-to-use UI** of InsightBase, making data monitoring a breeze.


#### What Are Recent G2 Reviews of InsightBase?

**"[Insights by AI at it&#39;s best](https://www.g2.com/survey_responses/insightbase-review-8785006)"**

**Rating:** 5.0/5.0 stars
*— Verified User in Biotechnology*

[Read full review](https://www.g2.com/survey_responses/insightbase-review-8785006)

---

**"[My assistant when it comes to managing database](https://www.g2.com/survey_responses/insightbase-review-8765210)"**

**Rating:** 5.0/5.0 stars
*— Verified User in Marketing and Advertising*

[Read full review](https://www.g2.com/survey_responses/insightbase-review-8765210)

---


### 18. [Observable](https://www.g2.com/products/observable/reviews)
Observable is a data analysis and exploration platform that helps data analysts and their stakeholders understand their business data, build charts and other visualizations, and communicate insights. Built for teams, powered by AI, and backed by a global community of data practitioners, Observable offers a single workspace for data exploration, custom chart creation, and cross-functional data collaboration. Observable&#39;s collaborative whiteboard for data analysis, Observable Canvases, helps analysts with exploratory data analysis, advanced chart creation, and data storytelling. It makes the data analysis process more streamlined by bringing querying, chart creation, and sharing all in one platform. Users can choose between code, UI, or AI, and easily move between all three depending on the task at hand. The AI is also deeply integrated and turnkey, operating transparently on the canvas to allow users to understand, interpret, and fine-tune its results and reasoning, building trust in its recommendations. Additionally, whiteboarding features like comments, illustrations, and annotations help bring stakeholders into the data analysis process to reduce frustrating back-and-forths. Sophisticated data visualizations such as beeswarms, Sankey diagrams, choropleths, and more are available out-of-the-box to enable users to easily create and share expressive, interactive charts. Users can embed charts in internal apps, and generate polished, stakeholder-friendly dashboards in just a few clicks.


**Average Rating:** 4.4/5.0
**Total Reviews:** 4
**How Do G2 Users Rate Observable?**

- **Has the product been a good partner in doing business?:** 10.0/10 (Category avg: 9.1/10)
- **Steps to Answer:** 8.3/10 (Category avg: 8.4/10)
- **Reports Interface:** 8.3/10 (Category avg: 8.7/10)
- **Calculated Fields:** 6.7/10 (Category avg: 8.5/10)

**Who Is the Company Behind Observable?**

- **Seller:** [Observable](https://www.g2.com/sellers/observable)
- **Year Founded:** 2017
- **HQ Location:** San Francisco, US
- **Twitter:** @observablehq (25,314 Twitter followers)
- **LinkedIn® Page:** https://www.linkedin.com/company/observable/ (25 employees on LinkedIn®)

**Who Uses This Product?**
- **Company Size:** 50% Small-Business, 25% Mid-Market


#### What Are Observable's Pros and Cons?

**Pros:**

- Charting Features (1 reviews)
- Collaboration (1 reviews)
- Data Visualization (1 reviews)
- Design Aesthetics (1 reviews)
- Ease of Use (1 reviews)

**Cons:**

- Data Management Issues (1 reviews)
- Large Data Handling (1 reviews)
- Slow Performance (1 reviews)


### What Do G2 Reviewers Say About Observable?
*AI-generated summary from verified user reviews*

**Pros:**

- Users appreciate the **effortless D3.js integration** , enhancing their data visualization and exploration experience with Observable.
- Users value the **real-time collaboration** features of Observable, enhancing teamwork and simplifying data exploration.
- Users admire the **beautiful visual output** of Observable, enhancing data sharing and collaboration effortlessly.
- Users love the **beautiful visual output** of Observable, making data sharing and embedding easy and enjoyable.
- Users enjoy the **ease of use** of Observable, appreciating seamless integration and effortless coding without setup.

**Cons:**

- Users find that Observable can feel **browser-heavy with large data sets** , impacting performance and usability.
- Users find Observable can feel **browser-heavy with large data handling** , impacting performance during usage.
- Users find that Observable can feel **browser-heavy** with large data sets or complex applications, impacting performance.

#### What Are Recent G2 Reviews of Observable?

**"[A Game-Changer for Interactive Data Visualization](https://www.g2.com/survey_responses/observable-review-11720138)"**

**Rating:** 5.0/5.0 stars
*— Stephanie E.*

[Read full review](https://www.g2.com/survey_responses/observable-review-11720138)

---

**"[Best place to write interactive Data Visualization tools](https://www.g2.com/survey_responses/observable-review-8769653)"**

**Rating:** 4.5/5.0 stars
*— Anup J.*

[Read full review](https://www.g2.com/survey_responses/observable-review-8769653)

---


### 19. [1010 Data](https://www.g2.com/products/1010-data/reviews)
Its designed to deliver powerful insights on all of your data using a single, cohesive, integration-friendly system. Its scalable, democratic, flexible, and incredibly fast.


**Average Rating:** 4.3/5.0
**Total Reviews:** 2
**How Do G2 Users Rate 1010 Data?**

- **Has the product been a good partner in doing business?:** 8.3/10 (Category avg: 9.1/10)
- **Steps to Answer:** 8.3/10 (Category avg: 8.4/10)
- **Reports Interface:** 5.0/10 (Category avg: 8.7/10)
- **Calculated Fields:** 8.3/10 (Category avg: 8.5/10)

**Who Is the Company Behind 1010 Data?**

- **Seller:** [SymphonyAI](https://www.g2.com/sellers/symphonyai-cf01fc99-7338-420c-9ae6-2c2a4552d056)
- **Year Founded:** 2017
- **HQ Location:** Palo Alto, California
- **Twitter:** @SymphonySummit (470 Twitter followers)
- **LinkedIn® Page:** https://www.linkedin.com/company/symphonyai/ (2,086 employees on LinkedIn®)

**Who Uses This Product?**
- **Company Size:** 50% Mid-Market, 50% Small-Business


#### What Are Recent G2 Reviews of 1010 Data?

**"[Fantastic Program that can crunch a large amount of data](https://www.g2.com/survey_responses/1010-data-review-6861832)"**

**Rating:** 4.5/5.0 stars
*— Verified User in Food &amp; Beverages*

[Read full review](https://www.g2.com/survey_responses/1010-data-review-6861832)

---

**"[Excellent Data Management and Reporting Tool](https://www.g2.com/survey_responses/1010-data-review-6644354)"**

**Rating:** 4.0/5.0 stars
*— Verified User in Financial Services*

[Read full review](https://www.g2.com/survey_responses/1010-data-review-6644354)

---


#### What Are G2 Users Discussing About 1010 Data?

- [What is 1010 Data used for?](https://www.g2.com/discussions/what-is-1010-data-used-for)

### 20. [Altair SLC](https://www.g2.com/products/altair-slc/reviews)
Are SAS Language Programs Mission Critical for Your Business? Many organizations have developed SAS language programs over the years that are vital to their operations. IT and analytics managers are also under pressure to reduce costs and find alternatives for handling their SAS language requirements. Altair SLC (formerly WPS Analytics) runs programs written with SAS language syntax without translation and without licensing other third-party products. Altair SLC is built to handle high levels of throughput and reduces clients’ capital costs and operating expenses. Multi Language, Multi-Platform Solution Altair SLC handles programs, workflows, and models that combine the SAS language and the SQL, Python, and R languages. Its built-in SAS language compiler runs SQL and SAS language code and utilizes Python and R compilers to run Python and R code and exchange Pandas and R data frames. Working on IBM mainframes and in the cloud, as well as on servers and workstations running a host of operating systems, Altair SLC supports remote job submissions and can exchange data between mainframe, cloud, and on-premises installations. Feature-Rich SAS Language Support In addition, Altair SLC doesn’t require any third-party middleware to process applications that contain the SAS language. Altair SLC’s built-in SAS language compiler supports SAS language and macro syntax, and includes procedure support for statistics, time series analytics, operational research, machine learning, matrix manipulation, graphing, and output delivery. Additionally, users can use Altair SLC in batch or standalone mode to execute programs and models or use it with Altair Analytics WorkbenchTM, a GUI/IDE that provides both no-code (workflow) and code facilities to create, maintain, and execute programs and models and interactively explore their outputs.


**Average Rating:** 4.1/5.0
**Total Reviews:** 10
**How Do G2 Users Rate Altair SLC?**

- **Has the product been a good partner in doing business?:** 8.3/10 (Category avg: 9.1/10)

**Who Is the Company Behind Altair SLC?**

- **Seller:** [Altair](https://www.g2.com/sellers/altair-186799f5-3238-493f-b3ad-b8cac484afd7)
- **Year Founded:** 1985
- **HQ Location:** Troy, MI
- **LinkedIn® Page:** https://www.linkedin.com/company/8323/ (2,774 employees on LinkedIn®)
- **Ownership:** NASDAQ:ALTR
- **Total Revenue (USD mm):** $458

**Who Uses This Product?**
- **Company Size:** 70% Small-Business, 20% Mid-Market


#### What Are Altair SLC's Pros and Cons?

**Pros:**

- Big Data Handling (1 reviews)
- Customer Support (1 reviews)
- Data Import (1 reviews)
- Ease of Installation (1 reviews)
- Ease of Use (1 reviews)

**Cons:**

- Complexity (2 reviews)
- Limited Features (2 reviews)
- Inadequate Help Resources (1 reviews)
- Learning Curve (1 reviews)
- Not User-Friendly (1 reviews)


### What Do G2 Reviewers Say About Altair SLC?
*AI-generated summary from verified user reviews*

**Pros:**

- Users benefit from the **seamless big data handling** of Altair SLC, enabling smooth and efficient data transformation.
- Users commend the **customer support** of Altair SLC for its quick and effective responses to inquiries.
- Users love the **easy data import** of Altair SLC, transforming messy data into clean insights effortlessly.
- Users find the **installation process of Altair SLC effortless** , enabling seamless access to powerful analytics tools.
- Users find the **familiar interface** of Altair SLC intuitive and easy to navigate, enhancing their overall experience.

**Cons:**

- Users find the **complexity of searching for SLC solutions** frustrating due to overlapping software results and Python integration.
- Users note that the **limited features** of Altair SLC restrict functionality compared to SAS, impacting usability.
- Users find the **inadequate help resources** of Altair SLC unhelpful in identifying missing software functionalities.
- Users struggle with a **steep learning curve** when trying to find specific solutions for Altair SLC amidst alternatives.
- Users find Altair SLC **not user-friendly** , struggling with complex searches and overwhelming results from the software suite.

#### What Are Recent G2 Reviews of Altair SLC?

**"[A beautiful and efficient development platform](https://www.g2.com/survey_responses/altair-slc-review-9227710)"**

**Rating:** 4.0/5.0 stars
*— Verified User in Insurance*

[Read full review](https://www.g2.com/survey_responses/altair-slc-review-9227710)

---

**"[Affordable alternative for Modelling software](https://www.g2.com/survey_responses/altair-slc-review-9306349)"**

**Rating:** 4.0/5.0 stars
*— Karen M.*

[Read full review](https://www.g2.com/survey_responses/altair-slc-review-9306349)

---


### 21. [Analance Platform](https://www.g2.com/products/analance-platform/reviews)
Combining Data Science, Business Intelligence, and Data Management Capabilities in One Integrated, Self-Serve Platform. Analance is a robust, salable end-to-end platform that combines Data Science, Advanced Analytics, Business Intelligence, and Data Management into one integrated self-serve platform. It is built to deliver core analytical processing power to ensure data insights are accessible to everyone, performance remains consistent as the system grows, and business objectives are continuously met within a single platform. Analance is focused on turning quality data into accurate predictions allowing both data scientists and citizen data scientists with point and click pre-built algorithms and an environment for custom coding. THE ANALANCE PLATFORM: • Delivers an end-to-end enterprise analytics platform with a strong focus on turning quality data into accurate predictions from one integrated self-serve platform. • Provides a platform for both data scientists and citizen data scientists with point and click pre-built algorithms and an environment for custom coding. • Offers an intuitive UI with guided workflows to enable both data scientists and citizen data scientists to master the platform in minutes. • Unifies multiple tools required for data analysis into one integrated platform to deliver insights with accuracy and quality. Product Capabilities • Analance Data Management (ADM): Extract, Transform and Load (ETL) tool to clean and transform data for analysis. • Analance Advanced Analytics (AAA): Predict based on trained Machine Learning (ML) Models. • Analance Business Intelligence (ABI): Deploy trained models from AAA into ABI for visualizations. • Analance Internet of Things (AIoT): Connect to streaming sources for real-time analytics and visualization. • Analance Artificial Intelligence (AAI): Next generation inference engine for prescriptive analytics. Key Features: • Get a demo of Analance or take it for a 30-day test drive. • Seamless Data Integration • Data Cleaning and Transformation • Predictive Analytics and Trends • Real-time Analytics • Prescriptive Analytics • Text and Sentiment Analytics • Social Analytics • Business Intelligence and Reporting • Interactive Visualization • Self-Serve Capability • Sign-Sign On to Access All Platforms within Analance


**Average Rating:** 5.0/5.0
**Total Reviews:** 2
**How Do G2 Users Rate Analance Platform?**

- **Reports Interface:** 10.0/10 (Category avg: 8.7/10)

**Who Is the Company Behind Analance Platform?**

- **Seller:** [Orion Systems Integrators](https://www.g2.com/sellers/orion-systems-integrators)
- **Year Founded:** 1993
- **HQ Location:** Edison, New Jersey, United States
- **LinkedIn® Page:** https://www.linkedin.com/company/orioninnovation (4,746 employees on LinkedIn®)

**Who Uses This Product?**
- **Company Size:** 100% Mid-Market


#### What Are Recent G2 Reviews of Analance Platform?

**"[Great knowledge](https://www.g2.com/survey_responses/analance-platform-review-4675506)"**

**Rating:** 5.0/5.0 stars
*— Verified User in Health, Wellness and Fitness*

[Read full review](https://www.g2.com/survey_responses/analance-platform-review-4675506)

---

**"[Awesome data gathering and analytical tool](https://www.g2.com/survey_responses/analance-platform-review-5171647)"**

**Rating:** 5.0/5.0 stars
*— Verified User in Computer &amp; Network Security*

[Read full review](https://www.g2.com/survey_responses/analance-platform-review-5171647)

---


#### What Are G2 Users Discussing About Analance Platform?

- [What is Analance™ Advanced Analytics used for?](https://www.g2.com/discussions/what-is-analance-advanced-analytics-used-for)

### 22. [AnswerDock](https://www.g2.com/products/answerdock/reviews)
AnswerDock is an AI-driven analytics solution that uses Natural Language Processing to provide answers to business users&#39; questions, allowing them to make better and faster data-driven decisions, without the need for data analysts. You can try the product free by signing up. You will be able to upload your own data and experience most of the features of AnswerDock in the free version. Using AnswerDock, business users create their own reports and dashboards by typing their questions, just like using a web search engine. For example, users can type Top 10 Sales People by growth in number of leads this quarter. AnswerDock runs the analysis and displays the optimal visualization instantly. AnswerDock runs powerful data mining algorithms to answer questions asked in natural language, such as: • What drives my conversion rate up? • Why did Sales increase yesterday? • Whats driving shipment status to be delayed? • How does PageViews affect Revenue? AnswerDock connects to a variety of sources from excel files to relational databases (Mysql, SQL Server, … ) to 3rd-party APIs such as Google Analytics .Users can create dashboards combining multiple sources, enabling them to have an integrated view on their business. Industry professionals from any business function can use AnswerDock to easily explore their company&#39;s data, using an intuitive search-like interface with no required training. AnswerDock supports professionals in Retail and Ecommerce, Finance and Insurance, Healthcare, Transportation and Logistics, Communications and Media, Manufacturing, among other industries. AnswerDock provides a comprehensive data platform with tons of features: • Natural Language Processing • Auto Chart Selection • 30+ Interactive chart type • 50+ Customization Options • Data mining and Insights Discovery • Analysis Explanation • Custom Keywords • Automatic Data Indexing • Sharing and Collaboration • Formula-based Columns • Datasets Joins • Administration Console • Scheduled Data Loads • Export to CSV, PNG or PDF • Column, Row and Dataset Permissions • Users Management • Interactive Dashboards


**Average Rating:** 3.8/5.0
**Total Reviews:** 2

**Who Is the Company Behind AnswerDock?**

- **Seller:** [AnswerDock](https://www.g2.com/sellers/answerdock)
- **HQ Location:** United Arab Emirates
- **Twitter:** @AnswerDock (19 Twitter followers)
- **LinkedIn® Page:** https://www.linkedin.com/company/answerdock/about/ (2 employees on LinkedIn®)

**Who Uses This Product?**
- **Company Size:** 100% Small-Business


#### What Are Recent G2 Reviews of AnswerDock?

**"[Providing answers to questions of Business users](https://www.g2.com/survey_responses/answerdock-review-7413685)"**

**Rating:** 4.0/5.0 stars
*— Ravindra  D.*

[Read full review](https://www.g2.com/survey_responses/answerdock-review-7413685)

---


### 23. [Basquio](https://www.g2.com/products/basquio/reviews)
Basquio turns uploaded spreadsheet data into finished analysis decks. Upload CSV or Excel files with a short brief, and get back an editable PowerPoint with computed charts, a written narrative report, and a traceable data workbook. The analysis engine reads data with code, computes metrics like market share, growth rates, and segment performance, then generates real charts from the actual numbers. The narrative is shaped for the specified audience and objective. Output is a branded PPTX you can open and edit in PowerPoint, Google Slides, or Keynote. Three output tiers: Memo (written analysis, no slides, about 2 minutes), Deck (full branded PPTX with charts, about 15 minutes), and Deep-Dive (consulting-grade analytical depth, about 25 minutes). Built for recurring reporting workflows: category reviews, quarterly business reviews, client reporting packs, competitive analysis, and growth diagnostics. Free to start with 30 credits. No credit card required.


**Average Rating:** 5.0/5.0
**Total Reviews:** 2

**Who Is the Company Behind Basquio?**

- **Seller:** [Basquio](https://www.g2.com/sellers/basquio)
- **HQ Location:** N/A
- **LinkedIn® Page:** https://www.linkedin.com/company/basquio/ (1 employees on LinkedIn®)

**Who Uses This Product?**
- **Company Size:** 100% Mid-Market


#### What Are Recent G2 Reviews of Basquio?

**"[Basquio turns data into a ready to present deck in under 30 minutes](https://www.g2.com/survey_responses/basquio-review-12633241)"**

**Rating:** 5.0/5.0 stars
*— Marco D.*

[Read full review](https://www.g2.com/survey_responses/basquio-review-12633241)

---

**"[A productivity boost worth 19$/month](https://www.g2.com/survey_responses/basquio-review-12635392)"**

**Rating:** 5.0/5.0 stars
*— Giulia M.*

[Read full review](https://www.g2.com/survey_responses/basquio-review-12635392)

---


### 24. [Biuwer](https://www.g2.com/products/biuwer/reviews)
Biuwer is a powerful cloud-based Business Data Analytics platform that helps you to easily analyze your business data and create insightful reports and dashboards for informed decision-making. It also enables you to easily create and share powerful reports in minutes with no technical knowledge.


**Average Rating:** 4.3/5.0
**Total Reviews:** 2
**How Do G2 Users Rate Biuwer?**

- **Reports Interface:** 10.0/10 (Category avg: 8.7/10)

**Who Is the Company Behind Biuwer?**

- **Seller:** [Datuary S.L.](https://www.g2.com/sellers/datuary-s-l)
- **Year Founded:** 2022
- **HQ Location:** Murcia, ES
- **LinkedIn® Page:** https://www.linkedin.com/company/biuwer/ (9 employees on LinkedIn®)

**Who Uses This Product?**
- **Company Size:** 50% Enterprise, 50% Mid-Market


#### What Are Biuwer's Pros and Cons?

**Pros:**

- Ease of Learning (1 reviews)
- Ease of Use (1 reviews)
- Efficiency (1 reviews)
- Implementation Ease (1 reviews)
- Intuition (1 reviews)

**Cons:**

- Lack of Detail (1 reviews)
- Learning Curve (1 reviews)
- Limited Customization (1 reviews)
- Report Issues (1 reviews)


### What Do G2 Reviewers Say About Biuwer?
*AI-generated summary from verified user reviews*

**Pros:**

- Users find Biuwer&#39;s **ease of learning** advantageous, appreciating its clean interface and quick onboarding for teams.
- Users praise the **ease of use** of Biuwer, highlighting its intuitive interface and quick implementation for seamless workflow integration.
- Users value the **efficiency** of Biuwer, appreciating its quick implementation and intuitive interface for seamless operations.
- Users find the **easy implementation** of Biuwer beneficial, quickly adapting without needing extensive training or adjustments.
- Users find Biuwer&#39;s **intuitive interface** makes it easy to implement and enhances team productivity seamlessly.

**Cons:**

- Users find a **lack of detail** in documentation and features, limiting customization and insights for advanced use cases.
- Users find the **steep learning curve** of Biuwer challenging due to limited documentation and customizable features.
- Users find the **limited customization** options in Biuwer restrict their ability to tailor the product to their needs.
- Users find the **reporting issues** in Biuwer restrict customization and hinder effective data analysis and understanding.

#### What Are Recent G2 Reviews of Biuwer?

**"[User-Friendly Platform for Streamlining Operational Workflows](https://www.g2.com/survey_responses/biuwer-review-12239206)"**

**Rating:** 4.5/5.0 stars
*— Sandeep R.*

[Read full review](https://www.g2.com/survey_responses/biuwer-review-12239206)

---

**"[Cloud based data analytics](https://www.g2.com/survey_responses/biuwer-review-8557770)"**

**Rating:** 4.0/5.0 stars
*— Istikhar  A.*

[Read full review](https://www.g2.com/survey_responses/biuwer-review-8557770)

---


### 25. [C8 Cockpit](https://www.g2.com/products/c8-cockpit/reviews)
C8 Cockpit is a business intelligence software that supports daily tasks and meet a wide range of requirements.


**Average Rating:** 4.3/5.0
**Total Reviews:** 2
**How Do G2 Users Rate C8 Cockpit?**

- **Steps to Answer:** 8.3/10 (Category avg: 8.4/10)
- **Reports Interface:** 8.3/10 (Category avg: 8.7/10)
- **Calculated Fields:** 7.5/10 (Category avg: 8.5/10)

**Who Is the Company Behind C8 Cockpit?**

- **Seller:** [insightsoftware](https://www.g2.com/sellers/insightsoftware-f6b45d26-bff9-4340-b3b7-a2076e7bb544)
- **Year Founded:** 2018
- **HQ Location:** Raleigh, North Carolina
- **Twitter:** @insightsoftware (801 Twitter followers)
- **LinkedIn® Page:** https://www.linkedin.com/company/outcomes-by-insightsoftware/ (2,266 employees on LinkedIn®)

**Who Uses This Product?**
- **Company Size:** 100% Mid-Market


#### What Are C8 Cockpit's Pros and Cons?

**Pros:**

- Data Integration (1 reviews)
- Powerful BI (1 reviews)

**Cons:**

- Difficult Customization (1 reviews)
- Limited Chart Functionality (1 reviews)


### What Do G2 Reviewers Say About C8 Cockpit?
*AI-generated summary from verified user reviews*

**Pros:**

- Users appreciate the **data integration capabilities** of C8 Cockpit, providing a holistic view of business intelligence.
- Users value the **Powerful BI** of C8 Cockpit, enabling a cohesive overview of diverse business information sources.

**Cons:**

- Users find the **difficult customization** of charts in C8 Cockpit limits their data visualization options significantly.
- Users find the **limited chart functionality** restricts their ability to effectively visualize data in C8 Cockpit.

#### What Are Recent G2 Reviews of C8 Cockpit?

**"[Sales enablement platform](https://www.g2.com/survey_responses/c8-cockpit-review-9193039)"**

**Rating:** 4.0/5.0 stars
*— Verified User in E-Learning*

[Read full review](https://www.g2.com/survey_responses/c8-cockpit-review-9193039)

---

**"[Enables me to make KPIs about the firm.](https://www.g2.com/survey_responses/c8-cockpit-review-10394278)"**

**Rating:** 4.5/5.0 stars
*— Olivier P.*

[Read full review](https://www.g2.com/survey_responses/c8-cockpit-review-10394278)

---


## What Is Analytics Platforms?

[Analytics Tools &amp; Software](https://www.g2.com/categories/analytics-tools-software)

## What Software Categories Are Similar to Analytics Platforms?

- [Data Visualization Tools](https://www.g2.com/categories/data-visualization-tools)
- [Predictive Analytics Software](https://www.g2.com/categories/predictive-analytics)
- [Embedded Business Intelligence Software](https://www.g2.com/categories/embedded-business-intelligence)
- [Marketing Analytics Software](https://www.g2.com/categories/marketing-analytics)
- [Data Science and Machine Learning Platforms](https://www.g2.com/categories/data-science-and-machine-learning-platforms)
- [ETL Tools](https://www.g2.com/categories/etl-tools)
- [Data Preparation Software](https://www.g2.com/categories/data-preparation)


---

## How Do You Choose the Right Analytics Platforms?

### What You Should Know About Analytics Platforms

### What are analytics software platforms?

Analytics platforms, also known as business intelligence (BI) platforms, enable companies to gain visibility into their data through data integration, cleansing, blending, enrichment, discovery, and more. These tools are robust systems that sometimes require IT and data science skills to access and decipher company data through custom queries.&amp;nbsp;

Analytics platforms offer a comprehensive look into a company’s data by pulling from structured and unstructured data sources through detailed queries. Casual business users also benefit from analytics platforms, which offer customizable dashboards and the ability to drill into particular data points and trends.

### What types of analytics tools and platforms exist?

#### **All-in-one software**

##### **Self-service analytics platforms**

Self-service analytics platforms do not require coding knowledge, so business end users can use them for data needs. Cloud-based business analytics software often provides drag-and-drop functionality for building dashboards, prebuilt templates for querying data, and, occasionally, natural language querying for data discovery.&amp;nbsp;

##### **Embedded BI software**

Embedded BI software can integrate proprietary analytics functionality within other business applications. Businesses may choose an embedded product to promote user adoption; by placing the analytics inside regularly used software, companies enable employees to take advantage of available data. These solutions provide self-service functionality so average business end users can use data for improved decision-making.

#### **Point solutions**

##### **Root cause analysis**

Companies of all sizes produce vast amounts of data from a host of different sources. It can be difficult to keep track of the ebbs and flows of data and to spot outliers and trends across tens if not hundreds (sometimes even thousands) of data sources. Some solutions provide the user with a bird&#39; s-eye view of their data and intelligently alert them to changes in real time. Once alerted, they are able to dive in to evaluate the situation and solve it.

### What are the common features of analytics solutions?

Analytics software platforms are a great aid to any organization needing timely data visualization of high-level analytics. The following are some core features within analytics platforms that can help users make the most of them:

**Data preparation:** &amp;nbsp;Although standalone&amp;nbsp;[data preparation software](https://www.g2.com/categories/data-preparation)&amp;nbsp;exists that assists in discovering, blending, combining, cleansing, and enriching data—so large datasets can be easily integrated, consumed, and analyzed—analytics platforms must incorporate these functionalities into their core offering. In particular, analytics platforms must support data blending and modeling, allowing the end user to combine data across different databases and other data sources and to develop robust data models of this data. This is a critical step in making meaning out of the chaos by combining data from various sources.

**Data management:** Once the data is properly integrated, it must be managed. This includes restricting data access to certain users, for example. Although some companies opt for a standalone data management solution, such as a data warehouse, analytics platforms must, by definition, provide some level of data management.

**Data modeling and blending:** As mentioned, it is not efficient and often not effective to examine data when it is sprawled across many systems. As a business cloud, analytics platforms help businesses consolidate data and combine data points to understand the relationship between data and derive deep insights.

**Reports and dashboards:** Multilayered, real-time dashboards are a central feature of analytics platforms. Users can program their analytics software to display metrics of their choice and create multiple dashboards that show analytics related to specific teams or initiatives. From predictive website traffic analytics to customer conversion rates over a specified period, users can choose their preferred metrics to feature in dashboards and create as many dashboards as necessary.&amp;nbsp;

Administrators can adjust the permissions of different dashboards so they are accessible to the users in the company who need them the most. Users can share specific dashboards on office monitors or take screengrabs of dashboards to save and share as needed. Some analytics platform products may allow users to explore dashboards on their mobile devices.

[**Self service**](https://www.g2.com/categories/analytics-platforms/f/self-service) **:** Organizations use these tools to build interactive dashboards for discovering actionable insights. This enables business users like sales representatives, human resource managers, marketers, and other non-data team members to make decisions based on relevant business data.

**Advanced analytics:** Many analytics solutions are incorporating advanced features, sometimes called augmented analytics, to better understand a business’s data, even without IT support. These can include predictive analytics capabilities and data discovery, which includes intelligent suggestions for data visualization and machine learning-powered suggestions for deeper insights.

Other features include [Anomaly detection](https://www.g2.com/categories/analytics-platforms/f/anomaly-detection), [Query based](https://www.g2.com/categories/analytics-platforms/f/query-based), [Search](https://www.g2.com/categories/analytics-platforms/f/search), [Traditional](https://www.g2.com/categories/analytics-platforms/f/traditional)

### What are the benefits of using analytics platforms?

**Replace old or disparate software:** Businesses can replace outdated data storage solutions and reporting tools and migrate to an all-inclusive business cloud as an analytics platform. However, data migration is not essential for deploying an analytics solution, as businesses may not have the time or resources to do so. Therefore, it should be noted that these platforms can integrate with a whole host of solutions, such as [enterprise resource planning (ERP)](https://www.g2.com/categories/erp-systems) and [customer relationship management (CRM) software](https://www.g2.com/categories/crm).

**Improve productivity:** The days of sorting through tens, if not hundreds, of systems and needing immense support from IT have passed. With analytics platforms (especially those that are self-service and have features such as natural language search), anyone looking for data and data analysis, including average business users, can derive insights from their data.

**Save time (automation):** For most analytics platforms, users no longer need a strong background in query languages. Instead, data discovery and root cause analysis allow users to automatically receive alerts and insights into their data and get notified if the data has changed meaningfully.

**Reduce errors:** Although standalone data preparation tools may be the right solution for businesses with particularly complex data, analytics platforms allow users to clean and prepare their data through data mapping and deduplication methods.

**Consolidate data:** In this data-driven era, essentially every program and device a business has produces massive data. To understand this diverse data in the best way possible, combining it through methods such as data blending, which allows users to integrate data from multiple sources into a functioning dataset, is often necessary.

**Improve processes:** Without an analytics platform to be used across a business, processes can be slow and inefficient as interested parties seek data from disparate sources and request data from various people. Analytics platforms can help a business user quickly access data and data analysis and share it with internal and external stakeholders.

### **Who uses analytics tools?**

Analytics platforms can have both internal and external users.&amp;nbsp;

#### **Internal users**

**Data analysts and data scientists:** These employees are generally the power users of analytics tools, creating complex queries inside the platforms to gather a deeper understanding of business-critical data. These teams may also be tasked with building self-service dashboards to distribute to other teams.

**Sales teams:** Sales teams use self-service analytics tools and embedded analytics solutions to obtain insights into prospective accounts, sales performance, and pipeline forecasting, among many other use cases. Using analytics tools in a sales team can help businesses optimize their sales processes and influence revenue.

**Marketing teams:** Marketing teams often run different types of campaigns, including email marketing, digital advertising, or even traditional advertising campaigns. Analytics tools allow marketing teams to track the performance of those campaigns in one central location.

**Finance teams:** Finance teams leverage analytics software to gain insight into the factors impacting an organization&#39;s bottom line. By integrating financial data with sales, marketing, and other operations data, accounting and finance teams pull actionable insights that might not have been uncovered using traditional tools.

**Operations and supply chain teams:** Analytics solutions often utilize a company&#39;s ERP system as a data source. These applications track everything from accounting to supply chain and distribution; supply chain managers can optimize several processes to save time and resources by inputting supply chain data into an analytics platform.&amp;nbsp;

#### **External users**

**Consultants:** Businesses, especially larger ones, do not always understand the breadth and depth of their data, perhaps not even knowing where to begin. An external consultant wielding a powerful analytics platform can help businesses better understand their data and, as a result, make more informed business decisions.&amp;nbsp;

Users may consider contacting [BI consulting partners](https://www.g2.com/categories/business-intelligence-bi-consulting) to help determine the most relevant analytics and data to capture about their company’s overall success. Following a proper consultation, these agencies may offer assistance with setting up or choosing BI tools. A number of these agencies can assist businesses with the entire BI process, from complete data analysis to the shaping of processes or protocols related to data collection. A relationship with these consultants can prove highly beneficial for users who have never performed data analysis before or want to optimize their company’s reporting.

**Partners:** Partnerships between companies often involve data sharing and cross-company collaboration. As a result, a centralized repository of data, which would allow for data management, data querying, and data insights, can provide an essential tool for these businesses to succeed together, providing them with a birds-eye view of their data.

### **What are the alternatives to analytics platforms?**

Alternatives to analytics platforms can replace this type of software, either partially or completely:

[**Marketing analytics software**](https://www.g2.com/categories/marketing-analytics) **:** Businesses looking for tools geared toward marketing use cases and marketing data (e.g., related to targeting prospects) should look at marketing analytics solutions that are purpose-built for this.

[**Sales analytics software**](https://www.g2.com/categories/sales-analytics) **:** Although sales data such as revenue forecasts and closed deals can be imported and analyzed in general-purpose analytics platforms, sales analytics platforms can provide a more granular analysis of sales-related data and might have better integrations with sales tools such as CRMs.&amp;nbsp;

[**Log analysis software**](https://www.g2.com/categories/log-analysis) **:** &amp;nbsp;If a business wants to focus on analyzing its log data from applications and systems, it could benefit from log analysis software, which helps enable the documentation of application log files for records and analytics.

[**Predictive analytics software**](https://www.g2.com/categories/predictive-analytics) **:** Broad-purpose analytics platforms allow businesses to conduct various forms of analysis, such as prescriptive, descriptive, and predictive. Since analytics platforms allow for these different types of analyses, they might not provide the most robust features for any type. Therefore, businesses focused on looking at past and present data to predict future outcomes can use predictive analytics software for a more fine-tuned solution.&amp;nbsp;

[**Text analysis software**](https://www.g2.com/categories/text-analysis) **:** Analytics platforms are focused on structured or numerical data, allowing users to drill down and dig into numbers to inform business decisions. Text analysis solutions are the best bet if the user is looking to focus on unstructured or text data. These tools help users quickly understand and pull sentiment analysis, key phrases, themes, and other insights from unstructured text data.

[**Data visualization software**](https://www.g2.com/categories/data-visualization) **:** Data visualization tools can be an excellent place for businesses to start when looking to better understand their data. With capabilities including dashboards and reporting, data visualization software can often be quick and easy to set up and is frequently cheaper than more robust analytics platforms.&amp;nbsp;

However, it is essential to recognize their limitations. Data visualization solutions do what they say on the box: visualization. They do not give the user an end-to-end analytics solution from data preparation to data insights, nor do they provide significant data management capabilities.

### **Software and services related to analytics platforms**

Related solutions that can be used together with analytics platforms include:

[**Embedded business intelligence software**](https://www.g2.com/categories/embedded-business-intelligence) **:** Analytics platforms are standalone platforms that help companies analyze data. Businesses who want to build analytics capabilities into applications, whether that be for internal or external use, can use embedded BI software to accomplish this goal.

[**Database software**](https://www.g2.com/categories/database-software) **:** There are a plethora of solutions for storing, organizing, and sharing large amounts of data that can later be accessed and analyzed by analytics tools. Database software includes everything from&amp;nbsp;[big data software](https://www.g2.com/categories/big-data)&amp;nbsp;to traditional table-based&amp;nbsp;[relational databases](https://www.g2.com/categories/relational-databases). Businesses should research and implement whichever database tools make the most sense for their particular data types or analytical needs.&amp;nbsp;

When considering an analytics solution, users should investigate which databases can integrate with the tool to make the most logical product choice for their situation. Analytics products would not serve much purpose without one or more company databases to pull data from when the time comes.

### Challenges with analytics platforms

**Configuration:** Analytics solutions may have a highly technical setup process, requiring IT or developmental expertise. When trying to implement one of these platforms without an in-house data scientist or IT professional, users may struggle with getting the technology off the ground, integrating it with the appropriate solutions, and creating queries for data collection. This could mean a significant loss of resources and an inability to use the tool as intended. Users can contact BI consulting providers for assistance setting up a program or, in some cases, for handling the entirety of BI reporting.

**Overreliance:** Focusing too much on data and analytics can also be problematic. Data-driven decisions are critical to a business’s success, but data-only decisions ignore the various voices from within and without the organization. Successful companies combine rigorous analytics with anecdotal storytelling and thoughtful conversations about the business&#39;s success and components.

**Integrations:** If the analytics tool does not fully integrate with existing software, getting a complete view of a business’s operational performance becomes challenging. Similarly, if an integration experiences a communication error or other issue during a data query, it causes an incorrect or incomplete reading. Users should make a point to monitor these connections and any potential performance issues throughout their software stack to ensure that correct, complete, and up-to-date information is being processed and displayed on dashboards.

**Data security:** Companies must consider security options to ensure the right users see the correct data and guarantee strict data security. Effective analytics solutions should offer security options that enable administrators to assign verified users different levels of access to the platform based on their security clearance or level of seniority.

### How to choose the best analytics tools

#### Requirements Gathering (RFI/RFP) for Analytics Platforms

If a company is just starting and looking to purchase the first analytics platform, or maybe an organization needs to update a legacy system--wherever a business is in its buying process, g2.com can help select the best analytics platform.

The particular business pain points might be related to all the manual work that must be completed. If the company has amassed a lot of data, it needs to look for a solution that can grow with the organization. Users should think about the pain points and jot them down; these should be used to help create a checklist of criteria. Additionally, the buyer must determine the number of employees needing this software, as this drives the number of licenses they will likely buy.

Taking a holistic overview of the business and identifying pain points can help the team springboard into creating a checklist of criteria. The checklist is a detailed guide with necessary and nice-to-have features, including budget, features, number of users, integrations, security requirements, cloud or on-premises solutions, and more.

Depending on the deployment scope, producing an RFI, a one-page list with a few bullet points describing what is needed from an analytics platform might be helpful.

#### Compare Analytics Platforms Products

**Create a long list**

From meeting the business functionality needs to implementation, vendor evaluations are essential to the software buying process. For ease of comparison, after all demos are complete, it helps to prepare a consistent list of questions regarding specific needs and concerns to ask each vendor.

**Create a short list**

From the long list of vendors, it is helpful to narrow the list of vendors and come up with a shorter list of contenders, preferably no more than three to five. With this list, businesses can produce a matrix to compare the features and pricing of the various solutions.

**Conduct demos**

To ensure the comparison is thoroughgoing, the user should demo each solution on the shortlist with the same use case and datasets. This will allow the business to evaluate like for like and see how each vendor stacks up against the competition.&amp;nbsp;

#### Selection of analytics platforms

**Choose a selection team**

Before getting started, creating a winning team that will work together throughout the process, from identifying pain points to implementation, is crucial. The software selection team should consist of organization members with the right interests, skills, and time to participate in this process. A good starting point is to aim for three to five people who fill roles such as the primary decision maker, project manager, process owner, system owner, or staffing subject matter expert, as well as a technical lead, IT administrator, or security administrator. The vendor selection team may be more minor in smaller companies, with fewer participants, multitasking, and taking on more responsibilities.

**Analyze the data**

As analytics platforms are all about the data, the user must ensure that the selection process is also data-driven. The selection team should compare notes and facts and figures that they noted during the process, such as time to insight, number of visualizations, and availability of advanced analytics capabilities.

**Negotiation**

Just because something is written on a company’s pricing page does not mean it is gospel (although some companies will not budge). It is imperative to open up a conversation regarding pricing and licensing. For example, the vendor may be willing to discount multiyear contracts or recommend the product to others.

**Final decision**

After this stage, and before going all in, it is recommended to roll out a test run or pilot program to test adoption with a small sample size of users. If the tool is well used and received, the buyer can be confident that the selection was correct. If not, it might be time to return to the drawing board.

### How much do analytics software platforms cost?

As mentioned above, analytics platforms come as both on-premises and cloud solutions. Pricing between the two might differ, with the former often coming with more upfront costs for setting up the infrastructure.&amp;nbsp;

As with any software, analytics platforms are frequently available in different tiers, with the more entry-level solutions costing less than the enterprise-scale ones. The former will often not have as many features and may have caps on usage. Vendors may have tiered pricing, in which the price is tailored to the users’ company size, the number of users, or both. This pricing strategy may come with some support, which might be unlimited or capped at a certain number of hours per billing cycle.

Once set up, analytics platforms, especially those deployed in the cloud, do not often require significant maintenance costs.

As these platforms often come with many additional features, businesses looking to maximize the value of their software can contract third-party consultants to help them derive insights from their data and get the most out of the software.

#### Return on Investment (ROI)

Businesses deploy analytics platforms to derive a return on investment (ROI). As they are looking to recoup the losses they spent on the software, it is critical to understand its costs. As mentioned above, analytics platforms are typically billed per user, sometimes tiered, depending on the company size. More users will generally translate into more licenses, which means more money.

Users must consider how much is spent and compare that to what is gained in terms of efficiency and revenue. Therefore, businesses can compare processes between pre- and post-deployment software to understand better how processes have been improved and how much time has been saved. They can even produce a case study (either for internal or external purposes) to demonstrate the gains they have seen from using an analytics tool.

### Implementation of analytics software solutions

**How are analytics software Implemented?**

Implementation differs drastically depending on the complexity and scale of the data. In organizations with vast amounts of data in disparate sources (e.g., applications, databases, etc.), it is often wise to utilize an external party, whether an implementation specialist from the vendor or a third-party consultancy. With vast experience under their belts, they can help businesses understand how to connect and consolidate their data sources and use the software efficiently and effectively.

**Who is responsible for analytics platform implementation?**

Properly deploying an analytics platform may require many people or teams. This is because, as mentioned, data can cut across teams and functions. As a result, one person or even one team rarely has a complete understanding of all of a company’s data assets. With a cross-functional team, a business can begin to piece together its data and begin the analytics journey, starting with proper data preparation and management.

### Emerging trends related to analytics platforms

**Increase data accessibility**

Business data is no longer locked up in silos. With analytics platforms, more users across a business can find, access, and analyze this data. In addition, [artificial intelligence (AI) tools](https://www.g2.com/categories/artificial-intelligence) such as [natural language processing (NLP) software](https://www.g2.com/categories/natural-language-processing-nlp) help make searching through and for data more accessible and powerful, providing more accurate results.

With the amount of data accessible to businesses today, it is a near necessity that they implement some type of analytics software to understand and act on that data better. Implementing analytics software has been a significant initiative for companies undergoing digital transformation, as these tools offer deeper visibility into an organization&#39;s data. Companies adopt these solutions to make sense of large datasets collected from various sources.

**Shift from on-premises to cloud**

The move from on-premises data analytics to the cloud has been underway for several years, with more and more businesses moving their data and data insights into the cloud. This is taking place for various reasons, such as time to insight. Moving away from on-premises infrastructure has helped many companies enable data work anywhere one has access to the cloud—anywhere with internet access. However, not all data users have the luxury of working in the cloud for several reasons, including data security and issues related to latency. In industries such as health care, strict regulations such as the [Health Insurance Portability and Accountability Act (HIPAA)](https://learn.g2.com/health-insurance-portability-and-accountability-act) require data to be secure. Although it is possible to ensure this security in the cloud, it can be more complicated.

**Conversational AI**

Historically, to query data within an analytics solution, users needed to master a query language like SQL. With the rise of conversational interfaces, users uncover the data and insights they seek using intuitive language. Intuitive methods of querying data enable a larger user base to access and make sense of company data.

**Machine learning**

AI is quickly becoming a promising feature of analytics solutions throughout the data journey, from ingestion to insights. From AI-powered data preparation to smart insights, in which the platform suggests visualizations to the end user, analytics platforms are quickly becoming more powerful. Machine learning is helping end users discover hidden insights, allowing them to make sense of data and understand what they are seeing.

### Analytics Platforms FAQs

#### **Which analytics platforms have an intuitive UI that non-technical users adopt without extensive training?**

I looked for analytics platforms that make it easy to find what you need also enable easy collaboration.

- [Microsoft Power BI](https://www.g2.com/products/microsoft-microsoft-power-bi/reviews) **:** Has a drag-and-drop chart building without SQL or code that makes it user-friendly. Users can connect Excel, SharePoint, and emails without technical help.&amp;nbsp;
- [Tableau](https://www.g2.com/products/tableau/reviews) **:** Users can create dashboards with limited use and no deep technical background. Onboarding is as simple as sharing the links and giving the right access.
- [Sigma](https://www.g2.com/products/sigma-computing-sigma/reviews) **:** Spreadsheet-like UI provides the most distinctive non-technical adoption story. Users can pull in data and work with it in complicated ways that don&#39;t require coding.
- [Kyvos Semantic Layer](https://www.g2.com/products/kyvos-semantic-layer/reviews) **:** The semantic layer approach means business users interact with pre-defined, plain-language metrics rather than raw tables or SQL, which is the foundational mechanism for non-technical adoption.&amp;nbsp;

#### **What are the best analytics platforms for business teams accessing insights without SQL or data science skills?**

SQL-free access means business users can explore, filter, and create their own views without analyst dependency.&amp;nbsp;

- [Microsoft Power BI](https://www.g2.com/products/microsoft-microsoft-power-bi/reviews) **:** Non-technical users can build powerful dashboards quickly without SQL. Power BI&#39;s Power Query Editor handles data transformations through button clicks. The DAX layer exists for advanced users but is not required for standard self-service reporting.
- [Sigma](https://www.g2.com/products/sigma-computing-sigma/reviews) **:** Sigma&#39;s specific differentiator for SQL-free access is its spreadsheet-like interface on live warehouse data. For teams already on Snowflake or cloud warehouses, Sigma eliminates the SQL barrier entirely at the analysis layer.
- [Domo](https://www.g2.com/products/domo/reviews) **:** The no-code platform is easy to use for non-technical teams. Users can apply filtering and date range changes without any coding. The 1000+ connector ecosystem means data arrives automatically, so business users interact with dashboards rather than queries.&amp;nbsp;
- [Kyvos Semantic Layer](https://www.g2.com/products/kyvos-semantic-layer/reviews) **:** The semantic model defines metrics in plain language; business users query pre-built dimensions and measures without writing a single line of SQL.&amp;nbsp;

#### **Which analytics platforms support collaborative dashboards, annotations, and mobile access for on-the-go insights?**

I looked for tools with collaborative analytics, shared dashboards, in-platform discussion, annotations, and mobile-ready access.

- [Domo](https://www.g2.com/products/domo/reviews) **:** Sales teams can access data and contacts in real-time on their phones. Has platform-native discussion, report sharing, and insight annotation as part of the daily workflow.&amp;nbsp;
- [Microsoft Power BI](https://www.g2.com/products/microsoft-microsoft-power-bi/reviews) **:** Web and mobile access are daily-use features. The platform enables collaboration so everyone can see the same report at the same time, updated in real time.
- [Yellowfin BI](https://www.g2.com/products/yellowfin-bi/reviews) **:** Designed around collaborative BI with built-in story, annotation, and broadcast features for sharing insights with business audiences.&amp;nbsp;
- [Looker](https://www.g2.com/products/looker/reviews) **:** Comes with scheduled report delivery, so automated weekly numbers land in inboxes without anyone manually running anything. Email reports and metric notifications can be set up as daily workflow features.&amp;nbsp;

#### **Which analytics solutions provide fast query response and drill-down capability for ad-hoc exploration?**

Fast ad-hoc exploration means users can drill down, pivot, and filter without waiting and without writing a new query every time.

- [Tableau](https://www.g2.com/products/tableau/reviews) **:** Users can drill down on data without writing queries. Extracted datasets perform significantly better for ad-hoc work.
- [Kyvos Semantic Layer](https://www.g2.com/products/kyvos-semantic-layer/reviews) **:** The semantic layer pre-aggregates at the warehouse layer so ad-hoc queries against massive datasets return fast without full table scans.&amp;nbsp;
- [Incorta](https://www.g2.com/products/incorta/reviews) **:** Its direct data mapping approach eliminates the aggregation layer that slows most BI platforms during ad-hoc queries. For organizations where query latency on complex, multi-source datasets is the primary pain, Incorta is a good choice.
- [Microsoft Power BI](https://www.g2.com/products/microsoft-microsoft-power-bi/reviews) **:** Provides intuitive filtering across countries, teams, and time periods within existing dashboards without analyst involvement. The Direct Lake connection mode specifically reduces ad-hoc query latency.

#### **Which analytics solutions integrate with Snowflake, BigQuery, and Redshift seamlessly?**

Native, live connections to modern data warehouses — where queries run in the warehouse rather than in the BI tool are what seamless integration actually means for data teams.

- [Microsoft Power BI](https://www.g2.com/products/microsoft-microsoft-power-bi/reviews) **:** Integration with Active Directory, SharePoint, and the Microsoft Fabric ecosystem is described as genuinely seamless for organizations already in the Microsoft stack.
- [Sigma](https://www.g2.com/products/sigma-computing-sigma/reviews) **:** Built to run directly on Snowflake (and BigQuery/Redshift) without extracting data. The architecture means live warehouse queries are the default mode, not an optional feature.
- [Databricks](https://www.g2.com/products/databricks/reviews) **:** It is the warehouse-layer itself for many organizations, not a BI tool connecting to a warehouse, which means integration is inherently native. For organizations that treat Databricks as the processing layer and BI tools as the visualization layer on top, Databricks&#39; own analytics features (via SQL Warehouses and notebooks) eliminate the need for a separate integration layer.
- [Looker](https://www.g2.com/products/looker/reviews) **:** BigQuery is the most-named data warehouse in Looker&#39;s review base. LookML&#39;s push-down SQL architecture means all queries run in the warehouse (Snowflake, BigQuery, Redshift) rather than being extracted into Looker.

#### **Which analytics solutions come with robust caching and performance optimization to maintain fast speeds at scale?**

Caching and performance optimization matter when datasets are large, dashboards are complex, and business users can&#39;t wait for queries to resolve.

- [Kyvos Semantic Layer](https://www.g2.com/products/kyvos-semantic-layer/reviews) **:** The semantic layer pre-aggregates at the warehouse layer specifically to make large dataset queries fast. For organizations where query latency on multi-billion row datasets is the blocking problem, Kyvos is the most purpose-built and best-validated option in the category on these dimensions.
- [Databricks](https://www.g2.com/products/databricks/reviews) **:** Photon engine, Delta Lake caching, and auto-scaling compute architecture are the performance mechanisms at scale.&amp;nbsp;
- [Microsoft Power BI](https://www.g2.com/products/microsoft-microsoft-power-bi/reviews) **:** Row Level Security, Premium capacity, and aggregation tables are the scale optimization toolkit. Performance at scale in Power BI is achievable but requires deliberate architecture, not automatic.
- [Incorta](https://www.g2.com/products/incorta/reviews) **:** Direct data mapping eliminates the pre-aggregation step that creates scale bottlenecks in most BI tools, allowing ad-hoc queries against large transactional datasets to run without a separate aggregation cache.&amp;nbsp;

#### **Which analytics platforms prevent incorrect conclusions by enforcing data governance and preventing metric manipulation?**

I looked for analytics platforms with strong data governance features.&amp;nbsp;

- [Looker](https://www.g2.com/products/looker/reviews) **:** LookML governance, real-time data access, and seamless integration with modern data warehouses together create the governed analytics environment enterprises need to prevent metric drift across teams.
- [Microsoft Power BI](https://www.g2.com/products/microsoft-microsoft-power-bi/reviews) **:** Addresses governance through Row Level Security, workspace permissions, and certified datasets, which restrict what data individual users can see and prevent unauthorized metric redefinition.
- [Kyvos Semantic Layer](https://www.g2.com/products/kyvos-semantic-layer/reviews) **:** It defines metrics once at the semantic model level and enforces those definitions for every downstream query and dashboard.&amp;nbsp;
- [Tableau](https://www.g2.com/products/tableau/reviews) **:** Governance approach is built around Tableau Server and Tableau Cloud — where published data sources become the certified metric layer that individual report builders consume rather than create.&amp;nbsp;


