Top Free Analytics Platforms - Page 7

How Many Analytics Platforms Products Does G2 Track?

Total Products under this Category: 604

Category Stats (Sep 2026)

  • Average Rating: 4.51/5 The average rating of products in this category, based on all submitted ratings
  • Top Trending Product: Cube (+2.46%) - Among all products in this category, Cube recorded the largest rating increase compared to last month

Last updated: September 26, 2026

How Does G2 Rank Analytics Platforms Products?

Why You Can Trust G2's Software Rankings:

  • 30 Analysts and Data Experts
  • 29,600+ Authentic Reviews
  • 604+ Products
  • Unbiased Rankings

G2's software rankings are built on verified user reviews, rigorous moderation, and a consistent research methodology maintained by a team of analysts and data experts. Each product is measured using the same transparent criteria, with no paid placement or vendor influence. While reviews reflect real user experiences, which can be subjective, they offer valuable insight into how software performs in the hands of professionals. Together, these inputs power the G2 Score, a standardized way to compare tools within every category.

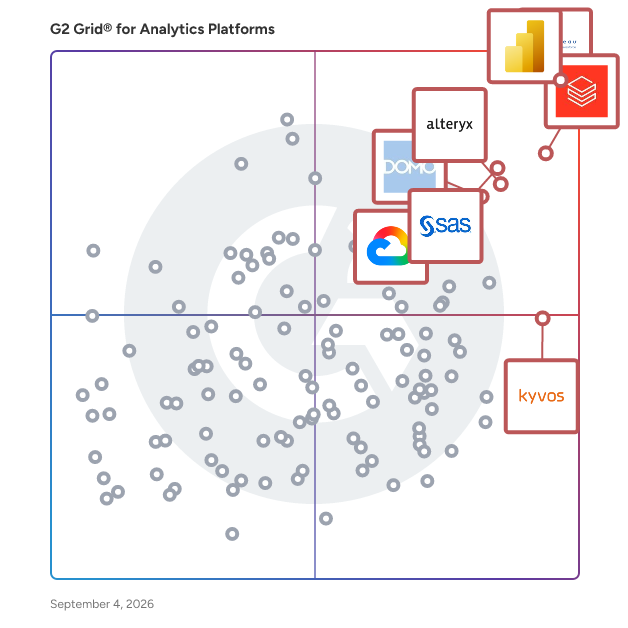
G2 Grid® for Analytics Platforms

G2 Grid® for Analytics Platforms plotting products by satisfaction and market presence

Highlighted products: Microsoft Power BI, Tableau, Databricks, SAS Viya, Alteryx, Domo, Looker, and Kyvos Semantic Layer.

Underlying data: [Grid® JSON](https://www.g2.com/categories/analytics-platforms/grids.json?focus%5B%5D=microsoft-microsoft-power-bi&focus%5B%5D=tableau&focus%5B%5D=databricks&focus%5B%5D=sas-sas-viya&focus%5B%5D=alteryx&focus%5B%5D=domo&focus%5B%5D=looker&focus%5B%5D=kyvos-semantic-layer)

Steep

Steep is a modern, metrics-first BI platform that empowers the entire organization to leverage insights for everyday decision-making. Built on a powerful semantic layer, the centralized metrics catalog powers every analysis and visualization, and ensures consistency and company-wide trust in data. The intuitive interface allows business users to easily access, explore, and analyze trusted metrics independently, while the data and analytics team maintains complete control over definitions and governance. Loved by teams across industries, Steep helps companies scale analytics and transform data engagement among business users, freeing data teams from repetitive requests.

Average Rating: 4.3/5.0

Total Reviews: 7

How Do G2 Users Rate Steep?

  • Has the product been a good partner in doing business?: 10.0/10 (Category avg: 9.2/10)
  • Steps to Answer: 8.3/10 (Category avg: 8.4/10)
  • Reports Interface: 9.2/10 (Category avg: 8.8/10)
  • Calculated Fields: 1.7/10 (Category avg: 8.5/10)

Who Is the Company Behind Steep?

Who Uses This Product?

  • Company Size: 100% Medium

What Do G2 Reviewers Say About Steep?

AI-generated summary from verified user reviews

Pros
  • Users find Steep to be extremely easy to use, appreciating its simplicity and powerful metrics-first approach.
  • Users commend the efficiency of Steep, citing its ease of use and streamlined setup for data analysis.
  • Users love the beautiful and easy-to-comprehend graphs and reports provided by Steep's data visualization tools.
  • Users value the ease of understanding with Steep, appreciating its beautiful graphs and simple usability.
  • Users appreciate the easy access on mobile platforms, enhancing usability and providing valuable metrics at their fingertips.
Cons
  • Users find the missing enterprise features of Steep limit customizability and advanced use case support significantly.
  • Users find that the lack of granular access controls hinders their experience and governance in Steep.
  • Users find filtering problems with Steep, missing crucial options like numeric filters and detailed table outputs.
  • Users feel that Steep lacks customization options, making it less suitable for advanced use cases.
  • Users desire enhanced formatting options in Steep for better filtering and table-style output capabilities.

What Are Recent G2 Reviews of Steep?

Databrain

DataBrain helps SaaS businesses make the most of their data by embedding powerful analytics right into their applications. With an intuitive platform that combines AI and flexible design, DataBrain lets companies give every end-user access to valuable insights right where they work. The platform is built to be simple, adaptable, efficient, and ready to grow with your needs. Whether you're a small startup or a large enterprise, Databrain allows your customers to explore data, create smart dashboards, and make better decisions with AI-enhanced analytics. 1. Customization: DataBrain offers extensive customization options, allowing businesses to tailor the look and feel of their analytics solution to match their brand identity. With white-labeling capabilities, organizations can create pixel-perfect dashboards that align with their Figma designs, ensuring a consistent and cohesive user experience. 2. Integration: The platform provides seamless integration with various data sources, including databases, data warehouses, APIs, and cloud-based data platforms. This enables organizations to connect and analyze data from different sources within the embedded analytics platform, providing a holistic view of their data landscape. 3. Augmented Analytics: DataBrain leverages the power of AI to deliver advanced analytics capabilities: a. AI Summary: Generates natural language summaries for individual reports and entire dashboards, providing users with quick insights and actionable recommendations6. b. Predictive Analytics: Utilizes machine learning and artificial intelligence to uncover patterns, make data-driven predictions, and gain deeper insights. c. Self-Service Analytics: Empowers end-users to perform ad-hoc analysis, create custom reports, and visualize data without relying on IT or data analysts. 4. Developer Efficiency: DataBrain accelerates the development and deployment of embedded analytics solutions: a. No-Code Tools: Offers a user-friendly interface with drag-and-drop functionality, enabling rapid dashboard creation without extensive coding expertise. b. Scalability: Designed to handle large volumes of data and growing user demands, ensuring performance as organizations scale.

Average Rating: 4.9/5.0

Total Reviews: 8

How Do G2 Users Rate Databrain?

  • Has the product been a good partner in doing business?: 10.0/10 (Category avg: 9.2/10)
  • Steps to Answer: 9.2/10 (Category avg: 8.4/10)
  • Reports Interface: 9.8/10 (Category avg: 8.8/10)
  • Calculated Fields: 9.2/10 (Category avg: 8.5/10)

Who Is the Company Behind Databrain?

Who Uses This Product?

  • Company Size: 50% Medium, 50% Small

What Do G2 Reviewers Say About Databrain?

AI-generated summary from verified user reviews

Pros
  • Users commend the excellent customer support of Databrain, enhancing their overall experience and satisfaction.
  • Users highlight the powerful dashboards and reporting capabilities of DataBrain, enhancing their analytics and reporting experiences.
  • Users find Databrain easy to use, enjoying its intuitive navigation and seamless dashboard creation features.
  • Users love the easy integration with various platforms, enhancing dashboard creation and overall experience effortlessly.
  • Users appreciate the intuitive reporting capabilities of DataBrain, which enhance productivity and user experience significantly.
Cons
  • Users find that some advanced features of Databrain involve a steep learning curve, making initial use challenging.
  • Users find the learning difficulty in configuring Databrain's features can hinder a smooth setup process.
  • Users find the learning curve for advanced features steep, wishing for more pre-built report templates to ease usage.
  • Users face a steep learning curve for advanced features, making it challenging to utilize Databrain effectively.

What Are Recent G2 Reviews of Databrain?

Fabi.ai

Fabi.ai is an all-in-one agile data analysis platform. It's designed to help data analysts, data scientists and other data practitioners uncover profit-driving insights through EDA and ad hoc analysis. It connects to all your data sources and allows you to create rich, interactive and collaborative reports directly in Fabi.ai, or push out the insights to spreadsheets, Slack and email.

Average Rating: 4.8/5.0

Total Reviews: 6

How Do G2 Users Rate Fabi.ai?

  • Has the product been a good partner in doing business?: 9.2/10 (Category avg: 9.2/10)
  • Steps to Answer: 9.3/10 (Category avg: 8.4/10)
  • Reports Interface: 10.0/10 (Category avg: 8.8/10)
  • Calculated Fields: 9.2/10 (Category avg: 8.5/10)

Who Is the Company Behind Fabi.ai?

  • Seller: Fabi.ai
  • Year Founded: 2023
  • HQ Location: San Francisco, US
  • Twitter: @hqfabi
    388 Twitter followers
  • LinkedIn® Page: www.linkedin.com
    3 employees on LinkedIn®

Who Uses This Product?

  • Company Size: 67% Small, 33% Medium

What Do G2 Reviewers Say About Fabi.ai?

AI-generated summary from verified user reviews

Pros
  • Users praise Fabi.ai for its analysis efficiency, enabling rapid reporting and streamlined workflows for small teams.
  • Users love the customization of Fabi.ai, enhancing data reporting and workflow efficiency effortlessly.
  • Users love the AI-driven dashboarding of Fabi.ai, significantly enhancing data reporting and workflow efficiency.
  • Users appreciate the ease of understanding with Fabi.ai, boosting data reporting and workflow efficiency effortlessly.
  • Users appreciate the ease of use of Fabi.ai, enabling efficient data reporting and smoother workflows effortlessly.
Cons
  • Users note the need for more granular access controls as their teams expand, affecting ease of management.

What Are Recent G2 Reviews of Fabi.ai?

Megaladata

The low code Megaladata platform empowers business users by making advanced analytics accessible. - Visual design of complex data analysis models with no involvement of the IT department and no need for programming. - Over 60 ready-to-use processing components. - Easy integration with various sources. - Fast processing of large datasets achieved through in-memory computing and parallelism. - Reusable components that facilitate accumulation of business expertise. - Advanced visualization — OLAP cubes, tables, charts, and other specialized tools. Megaladata minimizes the time between hypothesis testing and a fully functional business process.

Average Rating: 4.9/5.0

Total Reviews: 9

How Do G2 Users Rate Megaladata?

  • Has the product been a good partner in doing business?: 10.0/10 (Category avg: 9.2/10)
  • Steps to Answer: 10.0/10 (Category avg: 8.4/10)
  • Reports Interface: 10.0/10 (Category avg: 8.8/10)

Who Is the Company Behind Megaladata?

  • Seller: Megaladata
  • HQ Location: Neu-Isenburg, DE
  • Twitter: @megaladata_com
    5 Twitter followers
  • LinkedIn® Page: www.linkedin.com
    9 employees on LinkedIn®

Who Uses This Product?

  • Company Size: 89% Small, 11% Medium

What Are Recent G2 Reviews of Megaladata?

MarketingTracker

MarketingTracker is a market and brand performance analytics platform that gives commercial, marketing, and insights teams a continuous view of what is happening in their markets, how their brands are performing, and what is driving it, updated at the pace their decision-making requires. Rather than producing periodic reports that arrive after decisions have been made, MarketingTracker automates the collection, enrichment, and integration of marketing and market data, and surfaces insights through storyboards and presentations generated automatically in line with management reporting cycles. Teams spend their time on interpretation and action, not on building reports. For brands investing in upper-funnel and brand-building activity, MarketingTracker connects the dots between advertising exposure, consumer perception, brand equity, and market performance — giving marketing and finance teams the evidence they need to defend brand investment with confidence. Key capabilities: - Market and brand performance tracking across markets, segments, and competitive set - Automated data integration across marketing, consumer, and market data sources - Brand equity and advertising effectiveness measurement — awareness, consideration, preference over time - Driver analysis: not just what happened, but why - Storyboard reporting: automatically generated, presentation-ready outputs aligned to management reporting cadences - Consumer insight integration: surveys, behavioral data, and market metrics in a unified view - Decision support designed for commercial and brand teams, not data specialists Designed for marketing directors, brand managers, category leads, insights leads, and commercial teams at mid-to-large consumer brands who need a reliable, continuously updated view of market and brand performance, without building bespoke analytics infrastructure.

Average Rating: 4.7/5.0

Total Reviews: 5

How Do G2 Users Rate MarketingTracker?

  • Steps to Answer: 6.7/10 (Category avg: 8.4/10)
  • Reports Interface: 6.7/10 (Category avg: 8.8/10)
  • Calculated Fields: 6.7/10 (Category avg: 8.5/10)

Who Is the Company Behind MarketingTracker?

  • Seller: ScanmarQED
  • Year Founded: 1995
  • HQ Location: Houten, Utrecht
  • Twitter: @ScanmarQED
    37 Twitter followers
  • LinkedIn® Page: www.linkedin.com
    52 employees on LinkedIn®

Who Uses This Product?

  • Company Size: 60% Medium, 40% Small

What Are Recent G2 Reviews of MarketingTracker?

What Are G2 Users Discussing About MarketingTracker?

Publytics

Publytics is a web analytics software useful for website owners, blogs, newsrooms and blogs. It offers accurate real-time data regarding the most visited sources, content and traffic, and unsampled and fast historical daily data to perform historical comparisons. It's privacy-friendly and GDPR compliant and with an extremely intuitive UX. It enables simple and complex analyses, along with innovative features, such as the multi-site analysis feature (that allows to see multiple sites at once in all the panels) and several other features.

Average Rating: 4.8/5.0

Total Reviews: 9

How Do G2 Users Rate Publytics?

  • Has the product been a good partner in doing business?: 9.4/10 (Category avg: 9.2/10)
  • Steps to Answer: 10.0/10 (Category avg: 8.4/10)
  • Reports Interface: 10.0/10 (Category avg: 8.8/10)
  • Calculated Fields: 10.0/10 (Category avg: 8.5/10)

Who Is the Company Behind Publytics?

  • Seller: Publytics
  • HQ Location: ,
  • Twitter: @publytics_net
    4 Twitter followers
  • LinkedIn® Page: www.linkedin.com
    7 employees on LinkedIn®

Who Uses This Product?

  • Company Size: 89% Small, 11% Medium

What Do G2 Reviewers Say About Publytics?

AI-generated summary from verified user reviews

Pros
  • Users find Publytics to be intuitive and user-friendly, making analytics enjoyable and efficient for tracking website performance.
  • Users value the intuitive and powerful analytics of Publytics, making data-driven decisions enjoyable and effective.
  • Users find Publytics to be intuitive and enjoyable, making analytics easy to navigate and powerful for insights.
  • Users commend Publytics for its exceptional speed and performance, making traffic and engagement tracking intuitive and reliable.
  • Users love the intuitive and powerful analytics of Publytics, enhancing the overall experience of tracking performance.
Cons
  • Users feel Publytics has missing features for e-commerce and complex needs, limiting its overall effectiveness.
  • Users find Publytics limited for e-commerce needs, lacking advanced features for multi-step purchase funnels and deep analytics.
  • Users desire more customisation options in dashboards, though they still find Publytics fast and reliable for analytics.
  • Users find integration difficulty with Publytics, especially for e-commerce and complex SaaS functionalities.
  • Users find integration issues with Publytics, especially for e-commerce and complex SaaS needs, limiting its effectiveness.

What Are Recent G2 Reviews of Publytics?

Slingshot

Slingshot’s AI-driven platform can revolutionize how your business accesses and utilizes data. Consolidate insights from your sales, marketing, and CRM systems into one single source of truth. AI custom-trained on your business lets you ask questions, get immediate answers, and ensure every employee works from the same verified actionable information. Simplify analytics, enhance operational efficiency, go to market faster, and stay ahead of the competition.

Average Rating: 4.6/5.0

Total Reviews: 13

How Do G2 Users Rate Slingshot?

  • Has the product been a good partner in doing business?: 8.3/10 (Category avg: 9.2/10)
  • Steps to Answer: 8.9/10 (Category avg: 8.4/10)
  • Reports Interface: 10.0/10 (Category avg: 8.8/10)
  • Calculated Fields: 10.0/10 (Category avg: 8.5/10)

Who Is the Company Behind Slingshot?

  • Seller: Infragistics
  • Year Founded: 1989
  • HQ Location: Cranbury, NJ
  • Twitter: @infragistics
    36,861 Twitter followers
  • LinkedIn® Page: www.linkedin.com
    179 employees on LinkedIn®

Who Uses This Product?

  • Company Size: 69% Small, 38% Medium

What Do G2 Reviewers Say About Slingshot?

AI-generated summary from verified user reviews

Pros
  • Users appreciate the ease of use of Slingshot, facilitating efficient work management and smooth collaboration.
  • Users value the robust analytics and visualization tools in Slingshot, enhancing decision-making and work efficiency.
  • Users appreciate the efficiency of Slingshot, enhancing productivity through effective project tracking and resource management.
  • Users value the efficient data management of Slingshot, enhancing productivity and decision-making significantly.
  • Users find Slingshot to be time-saving, boosting productivity through efficient project management and collaboration features.
Cons
  • Users report frequent bugs with Slingshot, including connection issues and delays in link visibility in chats.
  • Users often face bugs and connectivity issues with Slingshot, leading to a frustrating experience at times.
  • Users find limited visibility in Slingshot, as projects must be viewed individually, reducing overall efficiency.
  • Users experience slow performance that complicates usage, making interpretation and analysis difficult.
  • Users find the time-consuming 2-factor authentication and minor bug in direct chat frustrating during their experience.

What Are Recent G2 Reviews of Slingshot?

bipp Analytics

bipp is a modern, cloud business intelligence platform that lets you explore billions of records in real-time. Simply connect your datasource, and build reusable data models with our Data Modeling Layer. Or explore your data with Visual SQL Data Explorer and create charts and dashboards in minutes. Ad-hoc or self-service reporting lets users slice and dice data to source trusted insights that drive business decisions. Insights can easily be shared through scheduled reports, data-based alerts, or embedded in applications.

Average Rating: 5.0/5.0

Total Reviews: 3

How Do G2 Users Rate bipp Analytics?

  • Has the product been a good partner in doing business?: 9.2/10 (Category avg: 9.2/10)
  • Steps to Answer: 8.3/10 (Category avg: 8.4/10)
  • Reports Interface: 10.0/10 (Category avg: 8.8/10)
  • Calculated Fields: 10.0/10 (Category avg: 8.5/10)

Who Is the Company Behind bipp Analytics?

  • Seller: BIPP
  • Year Founded: 2017
  • HQ Location: N/A
  • Twitter: @bippanalytics
    99 Twitter followers
  • LinkedIn® Page: www.linkedin.com
    1 employees on LinkedIn®

Who Uses This Product?

  • Company Size: 67% Small, 33% Medium

What Are Recent G2 Reviews of bipp Analytics?

What Are G2 Users Discussing About bipp Analytics?

DataClarity

DataClarity Unlimited Analytics is the only free modern embeddable data and analytics platform in the world that provides a self-service, powerful, secure and seamless end-to-end experience. DataClarity Unlimited Analytics Highlights · Simplified Data Integration – Easily connect, join, curate, cache, and catalog diverse data through drag and drop experience, custom SQL builder, and AI-powered data profiling. · Interactive Storyboards – Craft compelling storyboards using 80 stunning visualizations, geospatial maps, and flexibility to bring your own charts. · Real-time Analysis – Perform advanced analysis and data exploration using drill-down, drill-through, filters, built-in statistical and predictive models, and leverage your own Python and R code. · Seamless Application Integration – Achieve smooth integration with versatile APIs, tailor-made configurations, and flexible embedding features. · Security & Governance – Ensure adherence to your security guidelines, governance standards, multitenancy, row-level data protection, and Single Sign-On (SSO) capabilities. About DataClarity DataClarity is a trailblazing innovator of embedded self-service data and analytics. With an unwavering commitment to delivering groundbreaking capabilities that bring unparalleled value to ISV’s, SaaS providers, consultancies, and IT teams, DataClarity is reshaping industries through its forward-thinking solutions and pioneering business model.

Average Rating: 4.9/5.0

Total Reviews: 5

How Do G2 Users Rate DataClarity?

  • Has the product been a good partner in doing business?: 10.0/10 (Category avg: 9.2/10)
  • Steps to Answer: 9.3/10 (Category avg: 8.4/10)
  • Reports Interface: 9.3/10 (Category avg: 8.8/10)
  • Calculated Fields: 9.7/10 (Category avg: 8.5/10)

Who Is the Company Behind DataClarity?

Who Uses This Product?

  • Company Size: 60% Medium, 20% Large

What Are Recent G2 Reviews of DataClarity?

Datazip

Discover Datazip, a comprehensive no-code data engineering solution designed for time-conscious analysts and operators. Simplify your data management process by consolidating dispersed data sources, utilizing ETL, data warehousing, and transformation capabilities. With Datazip's intuitive platform, create a dependable, scalable data infrastructure in a mere 45 minutes. Experience swift data connections, robust querying, and smooth exporting to drive insightful decision-making.

Average Rating: 4.7/5.0

Total Reviews: 13

How Do G2 Users Rate Datazip?

  • Has the product been a good partner in doing business?: 9.4/10 (Category avg: 9.2/10)
  • Steps to Answer: 9.2/10 (Category avg: 8.4/10)
  • Reports Interface: 10.0/10 (Category avg: 8.8/10)
  • Calculated Fields: 10.0/10 (Category avg: 8.5/10)

Who Is the Company Behind Datazip?

Who Uses This Product?

  • Company Size: 46% Small, 31% Medium

What Are Recent G2 Reviews of Datazip?

Observable

Observable is a data analysis and exploration platform that helps data analysts and their stakeholders understand their business data, build charts and other visualizations, and communicate insights. Built for teams, powered by AI, and backed by a global community of data practitioners, Observable offers a single workspace for data exploration, custom chart creation, and cross-functional data collaboration. Observable's collaborative whiteboard for data analysis, Observable Canvases, helps analysts with exploratory data analysis, advanced chart creation, and data storytelling. It makes the data analysis process more streamlined by bringing querying, chart creation, and sharing all in one platform. Users can choose between code, UI, or AI, and easily move between all three depending on the task at hand. The AI is also deeply integrated and turnkey, operating transparently on the canvas to allow users to understand, interpret, and fine-tune its results and reasoning, building trust in its recommendations. Additionally, whiteboarding features like comments, illustrations, and annotations help bring stakeholders into the data analysis process to reduce frustrating back-and-forths. Sophisticated data visualizations such as beeswarms, Sankey diagrams, choropleths, and more are available out-of-the-box to enable users to easily create and share expressive, interactive charts. Users can embed charts in internal apps, and generate polished, stakeholder-friendly dashboards in just a few clicks.

Average Rating: 4.4/5.0

Total Reviews: 4

How Do G2 Users Rate Observable?

  • Has the product been a good partner in doing business?: 10.0/10 (Category avg: 9.2/10)
  • Steps to Answer: 8.3/10 (Category avg: 8.4/10)
  • Reports Interface: 8.3/10 (Category avg: 8.8/10)
  • Calculated Fields: 6.7/10 (Category avg: 8.5/10)

Who Is the Company Behind Observable?

  • Seller: Observable
  • Year Founded: 2017
  • HQ Location: San Francisco, US
  • Twitter: @observablehq
    25,314 Twitter followers
  • LinkedIn® Page: www.linkedin.com
    23 employees on LinkedIn®

Who Uses This Product?

  • Company Size: 50% Small, 25% Medium

What Do G2 Reviewers Say About Observable?

AI-generated summary from verified user reviews

Pros
  • Users value the seamless data exploration and beautiful visual output offered by Observable's charting features.
  • Users appreciate the real-time collaboration features of Observable, enhancing teamwork and data exploration effortlessly.
  • Users love the seamless data visualization features of Observable, enhancing their exploration and collaboration experience.
  • Users love the beautiful visual output of Observable, making data sharing and embedding effortless and appealing.
  • Users enjoy the ease of use of Observable, allowing for seamless data exploration and effortless coding.
Cons
  • Users find Observable can feel browser-heavy with large data sets, impacting performance and usability.
  • Users find the software browser-heavy with large data sets, impacting performance and usability for complex applications.
  • Users find that Observable can be slow performing with large data sets or complex applications, impacting usability.

What Are Recent G2 Reviews of Observable?

Supaboard

Supaboard delivers enterprise-grade AI data analysts purpose-built to understand the complexity of your business: your data models, metrics definitions, organizational structure, and decision-making workflows. Rather than relying on traditional BI tools that require dedicated analyst teams to operationalize, Supaboard's trainable domain-specific agents continuously monitor activity across your data estate, proactively surface material changes in performance, diagnose root causes with full analytical context, and recommend the next-best action aligned to your strategic priorities. Built to integrate with your existing data infrastructure across 600+ sources and designed for governance, security, and scale, Supaboard enables leaders across finance, operations, product, and revenue functions to move from reactive reporting to proactive, data-driven decisioning—shortening the path from question to insight to outcome.

Average Rating: 4.8/5.0

Total Reviews: 3

How Do G2 Users Rate Supaboard?

  • Steps to Answer: 5.0/10 (Category avg: 8.4/10)
  • Reports Interface: 8.3/10 (Category avg: 8.8/10)

Who Is the Company Behind Supaboard?

  • Seller: Supaboard
  • Year Founded: 2023
  • HQ Location: San Francisco, US
  • LinkedIn® Page: www.linkedin.com
    8 employees on LinkedIn®

Who Uses This Product?

  • Company Size: 100% Small

What Are Recent G2 Reviews of Supaboard?

Altair SLC

Are SAS Language Programs Mission Critical for Your Business? Many organizations have developed SAS language programs over the years that are vital to their operations. IT and analytics managers are also under pressure to reduce costs and find alternatives for handling their SAS language requirements. Altair SLC (formerly WPS Analytics) runs programs written with SAS language syntax without translation and without licensing other third-party products. Altair SLC is built to handle high levels of throughput and reduces clients’ capital costs and operating expenses. Multi Language, Multi-Platform Solution Altair SLC handles programs, workflows, and models that combine the SAS language and the SQL, Python, and R languages. Its built-in SAS language compiler runs SQL and SAS language code and utilizes Python and R compilers to run Python and R code and exchange Pandas and R data frames. Working on IBM mainframes and in the cloud, as well as on servers and workstations running a host of operating systems, Altair SLC supports remote job submissions and can exchange data between mainframe, cloud, and on-premises installations. Feature-Rich SAS Language Support In addition, Altair SLC doesn’t require any third-party middleware to process applications that contain the SAS language. Altair SLC’s built-in SAS language compiler supports SAS language and macro syntax, and includes procedure support for statistics, time series analytics, operational research, machine learning, matrix manipulation, graphing, and output delivery. Additionally, users can use Altair SLC in batch or standalone mode to execute programs and models or use it with Altair Analytics WorkbenchTM, a GUI/IDE that provides both no-code (workflow) and code facilities to create, maintain, and execute programs and models and interactively explore their outputs.

Average Rating: 4.1/5.0

Total Reviews: 10

How Do G2 Users Rate Altair SLC?

  • Has the product been a good partner in doing business?: 8.3/10 (Category avg: 9.2/10)

Who Is the Company Behind Altair SLC?

  • Seller: Altair
  • Year Founded: 1985
  • HQ Location: Troy, MI
  • LinkedIn® Page: www.linkedin.com
    2,630 employees on LinkedIn®
  • Ownership: NASDAQ:ALTR
  • Total Revenue (USD mm): $458

Who Uses This Product?

  • Company Size: 70% Small, 20% Medium

What Do G2 Reviewers Say About Altair SLC?

AI-generated summary from verified user reviews

Pros
  • Users laud the smooth big data handling of Altair SLC, transforming messy data into valuable insights effortlessly.
  • Users commend the responsive customer support of Altair SLC, offering quick resolutions to inquiries and issues.
  • Users enjoy the easy data import process of Altair SLC, transforming messy data into valuable insights effortlessly.
  • Users find the installation process for Altair SLC incredibly simple, allowing immediate access to its features.
  • Users find the familiar Eclipse SDE environment makes Altair SLC easy to use and navigate effortlessly.
Cons
  • Users struggle with the complexity of Altair SLC, finding it hard to narrow down relevant search results.
  • Users find the limited features of Altair SLC restrict functionality compared to full SAS software capabilities.
  • Users find the help resources inadequate, making it difficult to identify missing functionalities in Altair SLC.
  • Users struggle with the learning curve of Altair SLC, finding it hard to locate specific solutions online.
  • Users find the Altair SLC not user-friendly, struggling with complex search results and Python integration difficulties.

What Are Recent G2 Reviews of Altair SLC?

GoodMetrics

GoodMetrics is a better alternative to Google Analytics. We make it easy to see where your traffic comes from, what drives conversions, and which content performs best — all in a privacy-friendly way.

Average Rating: 5.0/5.0

Total Reviews: 2

How Do G2 Users Rate GoodMetrics?

  • Reports Interface: 10.0/10 (Category avg: 8.8/10)

Who Is the Company Behind GoodMetrics?

Who Uses This Product?

  • Company Size: 100% Small

What Do G2 Reviewers Say About GoodMetrics?

AI-generated summary from verified user reviews

Pros
  • Users value the responsive customer support of GoodMetrics, enhancing their experience with quick improvements and assistance.
  • Users value the customization options in GoodMetrics, enabling tailored reports for insightful business decisions.
  • Users value the real-time data insights from GoodMetrics, enhancing their decision-making for content and products.
  • Users value the simplicity and responsiveness of GoodMetrics, enhancing their analytics experience compared to Google Analytics.
  • Users appreciate the efficiency of GoodMetrics, which streamlines data analysis and enhances decision-making processes.

What Are Recent G2 Reviews of GoodMetrics?

Imply

Our real-time analytics database, built from Apache Druid, enables developers to build the next generation of analytics applications. With Imply, developers can build without constraints as our database lets them create interactive data experiences on streaming and batch data with limitless scale and at the best economics. Imply delivers the complete developer experience for Apache Druid. Founded by its original creators, Imply adds to the speed and scale of the database with committer-driven expertise, effortless operations, and cloud deployment to meet developers’ application requirements with ease. Backed by leading investors including Thoma Bravo, a16z and Bessemer Venture Partners, Imply is on a fast growth trajectory - disrupting the $100B database market - with customers including Twitter, Salesforce, Atlassian, Reddit, and Intercontinental Exchange.

Average Rating: 4.3/5.0

Total Reviews: 4

How Do G2 Users Rate Imply?

  • Has the product been a good partner in doing business?: 6.7/10 (Category avg: 9.2/10)
  • Steps to Answer: 9.2/10 (Category avg: 8.4/10)
  • Reports Interface: 8.3/10 (Category avg: 8.8/10)
  • Calculated Fields: 8.3/10 (Category avg: 8.5/10)

Who Is the Company Behind Imply?

  • Seller: Imply Data, Inc.
  • HQ Location: San Francisco, US
  • Twitter: @implydata
    2,003 Twitter followers
  • LinkedIn® Page: www.linkedin.com
    187 employees on LinkedIn®

Who Uses This Product?

  • Company Size: 50% Large, 25% Small

What Do G2 Reviewers Say About Imply?

AI-generated summary from verified user reviews

Pros
  • Users value the availability of dedicated support from solutions architects during migration and ongoing technical assistance.
  • Users value the collaboration with dedicated architects, enhancing the effective management of AWS clusters during migration.
  • Users appreciate the ease of use of Imply, benefiting from effective control and monitoring of their clusters.
  • Users appreciate the flexibility and control Imply offers, enhancing their ability to manage and monitor clusters effectively.
  • Users value the flexibility of Imply, enabling control over clusters and significant cost savings in data management.

What Are Recent G2 Reviews of Imply?

Tian Lin
TL
Researched and written by Tian Lin
Updated July 2, 2025