Shippingbo Analytics
Who Is the Company Behind Shippingbo Analytics?
- Seller: Facilecomm
- Year Founded: 2016
- HQ Location: Toulouse, FR
-
LinkedIn® Page: www.linkedin.com
104 employees on LinkedIn®
Total Products under this Category: 152
Last updated: November 01, 2026
Why You Can Trust G2's Software Rankings:
G2's software rankings are built on verified user reviews, rigorous moderation, and a consistent research methodology maintained by a team of analysts and data experts. Each product is measured using the same transparent criteria, with no paid placement or vendor influence. While reviews reflect real user experiences, which can be subjective, they offer valuable insight into how software performs in the hands of professionals. Together, these inputs power the G2 Score, a standardized way to compare tools within every category.
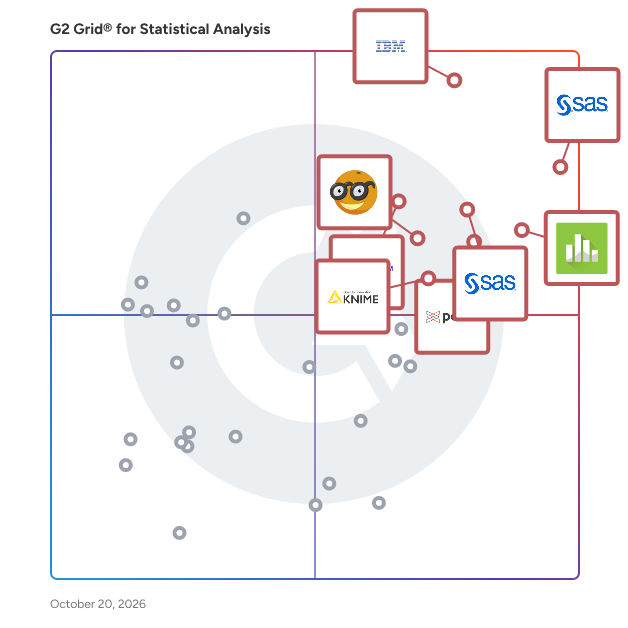
Highlighted products: SAS Viya, IBM SPSS Statistics, Minitab Statistical Software, Base SAS, Posit Team, Qualtrics Market Research, Orange, and KNIME.
Underlying data: [Grid® JSON](https://www.g2.com/categories/statistical-analysis/grids.json?focus%5B%5D=sas-sas-viya&focus%5B%5D=ibm-spss-statistics&focus%5B%5D=minitab-statistical-software&focus%5B%5D=base-sas&focus%5B%5D=posit-team&focus%5B%5D=qualtrics-market-research&focus%5B%5D=orange&focus%5B%5D=knime-analytics-platform)
SigmaXL was designed from the ground up to be a cost effective, powerful, but easy to use tool that enables users to measure, analyze, improve and control their service, transactional, and manufacturing processes.
Average Rating: 4.3/5.0
Total Reviews: 4
AI-generated summary from verified user reviews
Rating: 4.0/5.0 stars
— Santosh Y.
"Great tool for Excel and organizing Data and statistics"
Rating: 5.0/5.0 stars
— Sean H.
Slemma is a simple, yet powerful, reporting tool designed for businesses. Slemma enables users to view, analyze and share all of their data – from data warehouses, data storage providers and cloud service solutions – in one place.
Average Rating: 4.4/5.0
Total Reviews: 27
"Most underrated dashboard tool"
Rating: 5.0/5.0 stars
— Max L.
"Hidden Gem for Business Analytics & Reporting"
Rating: 5.0/5.0 stars
— Andrew H.
Connect G2 to Claude or ChatGPT for answers grounded in G2's trusted reviews, comparisons, and pricing from real user insights.
SQCpack is a robust Statistical Process Control (SPC) application that will help to analyze, understand, improve, and communicate about quality processes
Average Rating: 4.3/5.0
Total Reviews: 3
"Integrate with other data streams"
Rating: 4.5/5.0 stars
— Dimitar J.
"Easy to connect to other data sources"
Rating: 4.5/5.0 stars
— Trinh Thi P.
Statbench brings the Analysis ToolPak's statistics tools to Google Sheets™: descriptive statistics, histogram, t-tests, ANOVA, regression, correlation, covariance, moving average, sampling, and rank and percentile, with output tables laid out as in Excel. The ten core tools are free; Pro adds Goal Seek, Data Tables, Solver and APA-style write-ups.
STAT-Tag is a professional video tagging and data collection software. Create your own tags and track exactly what you want — simple or complex. Easily export the statistics and video clips that you want. Fast to set up and built to fit your workflow. STAT-Tag started with rugby but is designed to work across all sports. Collect data for any sport, your way.
STAVEX is a very user-friendly software for effortless Design of Experiments (DoE) in the INTRAnet. The software follows the logical workflow of experimentation, from problem definition to detailed result analysis and visualization over the selection of an appropriate design. The intuitive STAVEX interface guides the user through these steps, providing him with many recommendations to facilitate the use of Design of Experiments. Therefore, STAVEX can be used easily both by people with little statistical knowledge and by experts. Originally developed in the chemical-pharmaceutical industry, STAVEX allows for process factors (temperature, concentration, ...) as well as for mixture factors (mixture components for galenic or adhesive formulations, ...) which have to fulfil a summation condition typical for formulations. It also supports the calculation of the Design Space by considering several responses at once. Finally, STAVEX runs in any web browser, making DoE easily accessible and its use as easy as booking a hotel.
Stratum is a native statistics and data-visualization application for Mac and Windows, built for analysts who want serious statistical tools in a fast desktop app without notebooks, scripting, or the cloud. It imports CSV and Excel files through a guided wizard and works comfortably with datasets of up to 5 million rows. A formula engine with 100+ functions handles filtering, sorting, and reshaping, while 30+ chart types cover everything from histograms and box plots to control charts, treemaps, and contour plots. Statistical methods include descriptive statistics, correlation, regression, ANOVA and MANOVA, contingency tables, and PCA, alongside machine learning such as decision trees, random forests, boosted trees, and clustering. Every analysis exports to PDF, image, or clipboard. Stratum is available in 10 languages and is a one-time purchase with no subscription. A free trial is available.
Kingland is a cloud-ready, text analytics for enterprise data management that includes service bus, search, caching, queuing, notifications, workflow, rules, and access management services. Kingland enables organizations to jump-start enterprise data management projects, helping organizations complete complex, data-intensive projects within six to 12 months.
Trendalyze is a platform for discovering, predicting, and monitoring patterns in granular time series data collected by sensors, IoT devices, machines, transactional and event log systems. Our self-service platform empowers all information workers to discover and monitor meaningful patterns as easily as it is to search and monitor for web content on Google. It also empower business users and analysts to discover, analyze and predict patterns in IoT and other transactional data as easily as it is for them to analyze business data in Excel. Trendalyze has pioneered patent-pending Logical Neural Networks that learn from small data sets, are 100% explainable, and can be configured by business professionals.
Average Rating: 4.6/5.0
Total Reviews: 12
"Very powerful Data Analytics Tool"
Rating: 4.0/5.0 stars
— Verified User in Research
Rating: 5.0/5.0 stars
— Atanas P.
Veezoo is an Agentic Analytics platform engineered for trust and reliability, purpose-built to empower every business user — regardless of technical background — to ask questions about their data and receive accurate, governed, and auditable answers. Founded in 2016 as a spin-off from ETH Zurich, Veezoo has been building AI-native analytics long before large language models became mainstream, combining Agentic AI with a proprietary Knowledge Graph architecture. At the core of Veezoo is the Knowledge Graph: a semantic layer that captures a company's business ontology, KPI definitions, metrics, governance rules, and authorization logic. Unlike conventional AI analytics tools that allow language models to write SQL directly — leading to hallucinated metrics and inconsistent results — Veezoo's AI translates every natural language question into Veezoo Query Language (VQL), which is then compiled to SQL through a deterministic, rule-based process. This means the AI never touches raw database tables, business logic is always applied consistently, and every result is fully traceable and auditable. Business users interact with Veezoo through a conversational chat interface, asking questions in plain language and receiving instant, verified answers with charts, tables, and dashboards. Veezoo interprets the data, suggests next steps, and summarizes key insights. Monitoring agents can investigate anomalies and alert teams when something requires action. Every chart title, filter, and label is rendered directly from VQL — not generated by an AI — so users can verify exactly what the data shows and hover over any term to see its governed definition. For data teams, Veezoo provides a Knowledge Graph IDE for modeling semantic layers from scratch using AI, leveraging existing documentation. The platform supports version control, BI-as-Code workflows, development branches, and automated tests — following best practices of modern analytics engineering. The Knowledge Graph lives in Git, making it versioned, reviewable, and auditable without vendor lock-in. Veezoo integrates natively with 17+ databases and data warehouses including Snowflake, Google BigQuery, Databricks, Amazon Redshift, PostgreSQL, MySQL, Microsoft SQL Server, Oracle, SAP HANA, and more. It also integrates with dbt Cloud to import models, metrics, and documentation, and delivers scheduled results and alerts directly to Slack and Microsoft Teams. An MCP server allows other AI tools such as Claude, ChatGPT, and Gemini to query the governed Knowledge Graph, and a public REST API enables custom integrations, embedded analytics, and CI/CD automation. Veezoo supports embedded analytics, allowing organizations to integrate the conversational analytics experience directly into their own applications in multi-tenant environments. The platform also features customizable branding, collaborative dashboards, and export capabilities to PDF, PNG, JPEG, SVG, and Excel. Recognized as a 2024 Gartner Cool Vendor in AI Models and Natural Language Technologies, Veezoo is trusted by thousands of users at companies including AXA, Bayer, Baloise, Breitling, Valora, and Air Up. The platform is headquartered in Zurich, Switzerland, and serves organizations ranging from innovative startups to Fortune 500 enterprises across industries including insurance, retail, consumer goods, and financial services.
Average Rating: 5.0/5.0
Total Reviews: 1
"Simple Integration, Efficient UI, Effective AI, Effective Analysis in Veezoo"
Rating: 5.0/5.0 stars
— João Carlos D.
Input your data directly in Excel, or use one of the many import possibilites that Excel offers.
