Best Predictive Analytics Tools and Software - Page 13

How Many Predictive Analytics Software Products Does G2 Track?

Total Products under this Category: 367

Category Stats (Sep 2026)

  • Average Rating: 4.44/5 The average rating of products in this category, based on all submitted ratings
  • Top Trending Product: Palantir Foundry (+1.94%) - Among all products in this category, Palantir Foundry recorded the largest rating increase compared to last month

Last updated: September 01, 2026

How Does G2 Rank Predictive Analytics Software Products?

Why You Can Trust G2's Software Rankings:

  • 30 Analysts and Data Experts
  • 30,000+ Authentic Reviews
  • 367+ Products
  • Unbiased Rankings

G2's software rankings are built on verified user reviews, rigorous moderation, and a consistent research methodology maintained by a team of analysts and data experts. Each product is measured using the same transparent criteria, with no paid placement or vendor influence. While reviews reflect real user experiences, which can be subjective, they offer valuable insight into how software performs in the hands of professionals. Together, these inputs power the G2 Score, a standardized way to compare tools within every category.

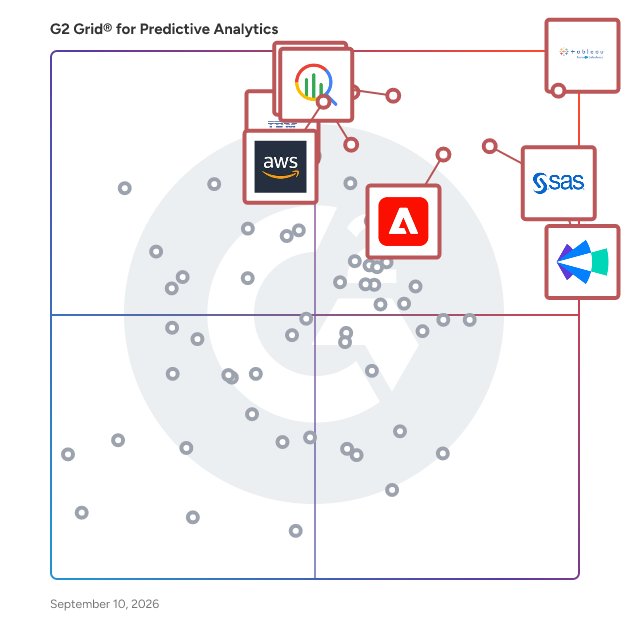
G2 Grid® for Predictive Analytics Software

G2 Grid® for Predictive Analytics Software plotting products by satisfaction and market presence

Highlighted products: Tableau, Clari, SAS Viya, Google Cloud BigQuery, Adobe Analytics, IBM Cognos Analytics, Amazon Quick, and IBM SPSS Statistics.

Underlying data: [Grid® JSON](https://www.g2.com/categories/predictive-analytics/grids.json?focus%5B%5D=tableau&focus%5B%5D=clari&focus%5B%5D=sas-sas-viya&focus%5B%5D=google-cloud-bigquery&focus%5B%5D=adobe-analytics&focus%5B%5D=ibm-cognos-analytics&focus%5B%5D=amazon-quick&focus%5B%5D=ibm-spss-statistics)

Veritas NetBackup IT Analytics

APTARE IT Analytics is the only extensible platform offering unified insights for multi-vendor backup, storage and virtual infrastructure in heterogeneous IT environments. It offers unmatched, comprehensive IT analytics, delivering actionable insights through a single-pane-of-glass across on-premises and hybrid and multi cloud environments.

Average Rating: 5.0/5.0

Total Reviews: 1

How Do G2 Users Rate Veritas NetBackup IT Analytics?

  • Algorithms: 8.3/10 (Category avg: 8.6/10)

Who Is the Company Behind Veritas NetBackup IT Analytics?

  • Seller: Cohesity
  • Year Founded: 2013
  • HQ Location: San Jose, CA
  • Twitter: @Cohesity
    29,248 Twitter followers
  • LinkedIn® Page: www.linkedin.com
    7,808 employees on LinkedIn®

Who Uses This Product?

  • Company Size: 100% Large

What Do G2 Reviewers Say About Veritas NetBackup IT Analytics?

AI-generated summary from verified user reviews

Pros
  • Users appreciate the data visualization capabilities of Veritas NetBackup IT Analytics, finding it easy to generate reports.
  • Users find Veritas NetBackup IT Analytics to be easy to use, with intuitive reporting and export options.
  • Users praise the excellent reporting templates and easy-to-use forecasting capabilities of Veritas NetBackup IT Analytics.
  • Users appreciate the easy-to-use graphs and forecasting capabilities of Veritas NetBackup IT Analytics for reporting.

What Are Recent G2 Reviews of Veritas NetBackup IT Analytics?

Visplore

Visplore is a visual analytics and industrial data analysis software solution that helps engineers perform systematic root cause analysis and time series analysis across complex process and production data. Visplore belongs to the categories of data analysis, industrial analytics, and visual analytics software. It is designed for manufacturing companies and process industries that need to investigate KPI deviations, production losses, quality issues, or energy inefficiencies. Typical users include process engineers, production managers, quality engineers, and operational excellence teams working with IT/OT data landscapes. The software supports use cases such as troubleshooting, deviation analysis, performance benchmarking, and structured visual analytics process optimization across sites and production units. Visplore is developed by an independent European software company headquartered in Vienna, Austria. Founded to bring advanced analytics closer to operational teams, the company focuses on industrial environments where transparency, on-premise deployment, and engineering usability are key requirements. The organization works closely with manufacturing customers across Europe and other industrial regions, supporting deployments in regulated and security-sensitive environments. Key features and functionality include: - Guided root cause analysis workflows for systematic investigation of KPI deviations - Interactive time series analysis across process, asset, quality, and material data - Integrated data analysis tools for multivariate exploration and hypothesis testing - Visual analytics process optimization templates that standardize investigations - On-premise deployment with seamless IT/OT connectivity Compared to other data analysis tools such as Seeq and TrendMiner, Visplore is built for on-premise deployments and for everyday engineering use, making industrial data analysis accessible, repeatable, and ready for action. The primary value of Visplore lies in closing the gap between monitoring and understanding. While dashboards show what happened, Visplore supports structured data analysis to explain why it happened. By embedding root cause analysis and time series analysis into guided, visual workflows, the software reduces reliance on manual spreadsheet work and isolated expert knowledge. Organizations use Visplore to shorten time-to-insight, standardize analytical best practices, and enable engineers to independently conduct deep investigations that support continuous improvement and sustainable visual analytics process optimization.

Average Rating: 4.4/5.0

Total Reviews: 4

Who Is the Company Behind Visplore?

  • Seller: Visplore
  • Company Website:
  • HQ Location: Vienna, AT
  • LinkedIn® Page: www.linkedin.com
    31 employees on LinkedIn®

Who Uses This Product?

  • Company Size: 50% Medium, 25% Large

What Do G2 Reviewers Say About Visplore?

AI-generated summary from verified user reviews

Pros
  • Users love the ease of use in Visplore, enabling quick analysis with minimal clicks and seamless integration.
  • Users value the efficiency of Visplore, enjoying quick setup and seamless integration for time series analysis.
  • Users praise the easy integrations of Visplore, allowing seamless database connection and efficient time series analysis.
  • Users love the easy-to-use interface of Visplore, which simplifies time series analysis with just a few clicks.

What Are Recent G2 Reviews of Visplore?

What Are G2 Users Discussing About Visplore?

Wisemelon

Average Rating: 5.0/5.0

Total Reviews: 1

How Do G2 Users Rate Wisemelon?

  • Has the product been a good partner in doing business?: 10.0/10 (Category avg: 8.9/10)

Who Is the Company Behind Wisemelon?

Who Uses This Product?

  • Company Size: 100% Small

What Are Recent G2 Reviews of Wisemelon?

180ops

180ops: Revenue Intelligence & Sales Analytics Get situational awareness or your priorities, risks and opportunities for cross-selling, LTV growth and new customer acquisition across entire market and customer interface including your full offering portfolio. Create bridge between strategic planning and operational execution. Gain full visibility into your pipeline, account health, and market opportunity--all with predictive clarity. What makes us different: 🟣 Smart Forecasting, Real and actionable Insights — Combines internal billing, pipeline and customer data with external signals to guide where to act next. 🟣 Account-Level Intelligence — Understand which accounts to focus on, where to expand penetration, and how to grow ARPA & LTV. 🟣 Market-Level Awareness — Detect trends, risks, and untapped opportunity in your total addressable market. 🟣 Sales Performance Insights — Analyze rep activity, deal velocity, churn risk, wallet size, and forecast confidence with data beyond win-loss metrics. 🟣 Ansoff Matrix portfolio analysis for today — How offerings perform in new customer acquisition, cross-selling and upsales/renewal? What is the time-to-money, avg deal size and hitrate? Learn how to open and expand customer relationship in different segments 🟣 Perfect Stack Partner as central intelligence — Works with your CRM, ERP, SalesOps tools like Clari or Gong — without replacing them. 180ops is a "flow thru technology", our goal is to deliver customer experience with: 1. right answer 2. to the right person 3. at the right time 4. in an understandable format 5. in technologies that are used for decision making Delivering the data to other systems is imperative. 180ops is Microsoft ISV operating primarily in Azure (Azure Marketplace offering), delivers the data to CRM as ready made visualizations, connects with your datalake or One Cloud and offers MCP and API for LLMs and Agentic AI use cases. 180ops acts as the central intelligence distributing situational awareness and directions to other technologies

Who Is the Company Behind 180ops?

  • Seller: 180ops
  • Year Founded: 2022
  • HQ Location: Helsinki, FI
  • LinkedIn® Page: www.linkedin.com
    9 employees on LinkedIn®

1Platform

1Platform by Polestar Analytics is a unified, low-code data intelligence ecosystem that transforms enterprise data management through its powerful orchestration engine, AI capabilities, and comprehensive analytics portal. Built with a no-code platform for data engineering, it seamlessly integrates 100+ data sources while providing automated data lake acceleration, historical data migration, and comprehensive data quality scorecards with execution logs for complete governance. What sets 1Platform apart is its ability to deliver actionable intelligence at scale through unified insights access, agentic and generative AI capabilities that go beyond data summarization to extract additional insights and advanced preloaded, scalable and customisable LLM and reasoning models reducing time and talent requirement. The platform operates through a single, intuitive interface across any cloud environment with modular, plug-and-play architecture, featuring access-based configuration for analytics, dashboard management, and a comprehensive notifications hub for tracking key activities. Backed by 350+ successful clients, 1,000+ implementations, and an exceptional 87% repeat business rate across 20+ global markets, Polestar Analytics delivers the agility, speed, and intelligence that modern enterprises demand to maintain their competitive edge.

Who Is the Company Behind 1Platform?

  • Seller: Polestar Analytics
  • Year Founded: 2012
  • HQ Location: Plano, US
  • Twitter: @PolestarLLP
    508 Twitter followers
  • LinkedIn® Page: www.linkedin.com
    634 employees on LinkedIn®

Adaapt

Adaapt is an AI-powered analytics platform designed to deliver role-based insights that empower every team to make data-driven decisions with confidence. Our mission is to make data accessible and actionable for all employees by providing tailored insights that align with their specific roles and responsibilities. Adaapt's natural language search enables users to ask data questions and get relevant, actionable answers easily—no technical expertise is required. Whether through the web or mobile, Adaapt ensures that employees at every level can make faster, smarter decisions, wherever they are. Adaapt's key differentiator is its ability to provide role-based insights, ensuring that each user receives the data most relevant to their function. With Adaapt’s low-code, developer-friendly platform, organizations can also embed AI-powered analytics into their products, creating new revenue streams and engaging users with continuous, meaningful insights.

Who Is the Company Behind Adaapt?

  • Seller: Adaapt
  • Year Founded: 2020
  • HQ Location: Bangalore - 560005, IN
  • LinkedIn® Page: www.linkedin.com
    20 employees on LinkedIn®

Advice Analytics

Advice Analytics delivers predictive analytics for 401(k) communications, compliance, and plan design.

Who Is the Company Behind Advice Analytics?

Analytical Alley

Analytical Alley is a modern, AI-driven, analytics platform that boosts your mROI and optimises your marketing mix, ensuring every euro is well spent. You'll see exactly how each marketing effort affects your business, simplifying management and making results predictable. It's intelligent marketing made simple.

Who Is the Company Behind Analytical Alley?

Andrea by AIDataPME

Andrea is a predictive AI suite built for small and mid-size e-commerce businesses (€750K–€5M revenue). Instead of dashboards that just report what already happened, Andrea runs nightly machine learning forecasts and delivers ready-to-use recommendations directly into your dashboard — no data scientist required, no BI team to maintain. Most e-commerce brands at this stage lose margin in three places at once without seeing it: stock that's either understocked or overstocked, customers who quietly churn before anyone notices, and cash flow surprises that show up too late to act on. Andrea is built specifically to catch these three leaks, as three independent modules you can combine: Andrea Stock — Daily demand forecasting per SKU, automatic product segmentation (stars / standards / dead stock via clustering), and cold-start forecasting for new products with under 45 days of sales history. Built on gradient boosting (LightGBM) and unsupervised clustering (HDBSCAN). Andrea Retention — Churn risk scoring per customer using point-in-time features (no data leakage), RFM-based customer segmentation (VIP / loyal / dormant). Optional add-on: order return probability classification, for stores where return rate is a meaningful cost driver. Andrea Treasury — 3-month cash flow forecasting (Prophet + business regressors), Media Mix Modeling for multi-channel ad spend, and executive-ready reporting. Designed to cross-reference signals from Stock and Retention when both are active, so forecasts improve as you add modules. How it works: Andrea connects to your existing stack — Shopify, Klaviyo, Google Ads — via secure API. All inference runs nightly on Google Cloud (europe-west1, GDPR-compliant, EU data residency). No raw data leaves your control; models run on your own isolated environment. Full setup takes 10 days from kickoff to first live forecasts, with no code and no infrastructure work required on your side. Bigger catalog or more complex operations? For businesses above €5M revenue, we also offer Andrea Pro — a fully custom architecture built collaboratively with your team, with dedicated infrastructure and tailored forecasting horizons. Contact us to discuss your specific requirements. Pricing: Andrea Stock from €290/month, Andrea Retention from €230/month, Andrea Treasury from €170/month. Combine two or more modules and save 15%. One-time setup from €450. No long-term commitment required — cancel anytime. Final pricing is confirmed case-by-case via a free diagnostic session, based on data complexity, catalog size, and expected ROI.

Who Is the Company Behind Andrea by AIDataPME?

Aurora LightZ

LightZ is an intuitive Excel style interface enabling users across finance, operations and sales in all businesses to exploit their data to provide smarter insights to cut costs and increase revenue.

Who Is the Company Behind Aurora LightZ?

Bijou Barry
BB
Researched and written by Bijou Barry
Updated October 29, 2024