Best Other ERP Software - Page 23

How Many Other ERP Software Products Does G2 Track?

Total Products under this Category: 426

Category Stats (Sep 2026)

  • Average Rating: 4.32/5 (↑0.01 vs Aug 2026) The average rating of products in this category, based on all submitted ratings
  • Top Trending Product: GENESIS (+3.18%) - Among all products in this category, GENESIS recorded the largest rating increase compared to last month

Last updated: September 05, 2026

How Does G2 Rank Other ERP Software Products?

Why You Can Trust G2's Software Rankings:

  • 30 Analysts and Data Experts
  • 1,800+ Authentic Reviews
  • 426+ Products
  • Unbiased Rankings

G2's software rankings are built on verified user reviews, rigorous moderation, and a consistent research methodology maintained by a team of analysts and data experts. Each product is measured using the same transparent criteria, with no paid placement or vendor influence. While reviews reflect real user experiences, which can be subjective, they offer valuable insight into how software performs in the hands of professionals. Together, these inputs power the G2 Score, a standardized way to compare tools within every category.
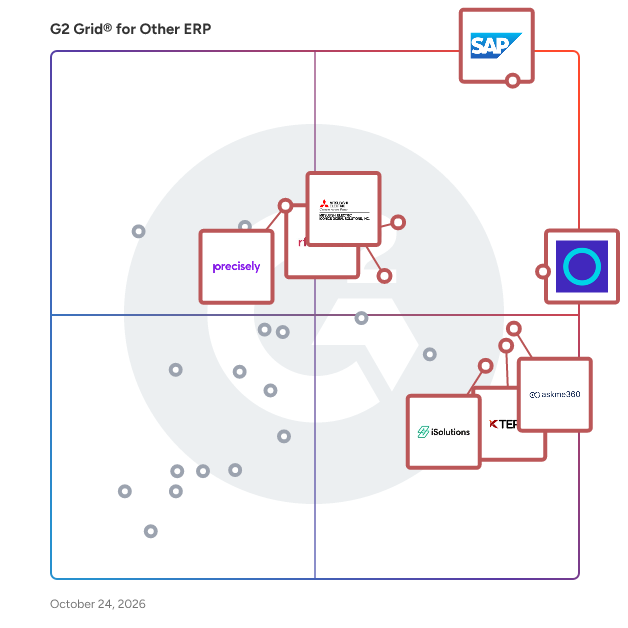
G2 Grid® for Other ERP Software

G2 Grid® for Other ERP Software plotting products by satisfaction and market presence

Highlighted products: SAP Responsible Design and Production, Panaya Smart Testing and Change Intelligence, askme360, KTern.AI, iPayments, RF- SMART WMS, Precisely Automate Studio, and Popdock.

Underlying data: [Grid® JSON](https://www.g2.com/categories/other-erp/grids.json?focus%5B%5D=sap-responsible-design-and-production&focus%5B%5D=panaya-smart-testing-and-change-intelligence&focus%5B%5D=askme360&focus%5B%5D=ktern-ai&focus%5B%5D=ipayments&focus%5B%5D=rf-smart-wms&focus%5B%5D=precisely-automate-studio&focus%5B%5D=popdock)

Production Order Analysis

The Production Order Analysis app empowers manufacturers to compare actual versus expected costs on production orders, offering a detailed view of material, labor, and subcontracting expenses. Integrated sales margin calculations provide real-time profitability insights, enabling better budget control and informed decision-making. This essential tool enhances production efficiency and financial oversight in Dynamics 365 Business Central. Part of the Enhanced Planning Pack, the Production Order Analysis app is one of several powerful tools to streamline your material resource planning (MRP) in Dynamics 365 Business Central, driving smarter, faster decisions across inventory and production. Benefits • Improved Cost Visibility: Gain a clear comparison between actual and expected production costs, allowing you to quickly identify discrepancies and adjust accordingly. • Enhanced Budget Control: Keep production costs within budget by tracking expenses at every stage, supporting better financial oversight and decision-making. • Detailed Expense Breakdown: Access a complete view of material, labor, and subcontracting costs, providing transparency into cost drivers and areas for potential savings. • Real-Time Sales Margin Insights: Automatically calculate sales margins when linked to a sales order, giving you instant profitability insights to support pricing and cost adjustments. • Streamlined Production Order Analysis: Consolidate all cost data in a single worksheet, reducing time spent on manual tracking and making it easier to manage production orders. • Increased Operational Efficiency: Make informed decisions with actionable insights into production costs, helping you optimize processes and resource allocation. • Support for Informed Pricing Decisions: With precise margin calculations, confidently set prices that align with your profitability goals and market demands. • Big-Picture Production Cost Management: Analyze and compare costs across multiple production orders, providing a broad view of manufacturing expenses to guide future projects and improve cost consistency. Features • Cost Comparison Between Actual and Expected: Provides instant visibility into actual versus planned costs, enabling you to pinpoint discrepancies and adjust budgets for accurate cost management. • Detailed Consumption and Capacity Costs: Breaks down material, labor, and subcontracting expenses, helping you understand cost drivers and identify areas for cost-saving. • Integrated Sales Margin Calculation: Calculates sales margins automatically when linked to a sales order, allowing you to assess profitability in real time and make informed pricing decisions. • Streamlined Production Order Tracking: Consolidates key cost details within a single worksheet, simplifying production order analysis and reducing time spent on manual cost tracking. • Actionable Insights for Improved Efficiency: Offers a clear view of production costs at each stage, supporting better planning, budget control, and overall production efficiency. • Optimized Budget Control for Manufacturing: Enables tighter budget oversight by aligning expected and actual costs, reducing the risk of unexpected expenses, and supporting long-term profitability. • Flexible Cost Analysis Across Production Orders: Empowers users to review and compare costs across multiple production orders, providing a big-picture view of manufacturing costs to guide future projects. Typical Users • Production Managers: Responsible for overseeing manufacturing processes, they use the app to monitor costs, ensure production stays within budget, and make adjustments to improve efficiency. • Cost Accountants: Focused on tracking production costs and profitability, cost accountants rely on the app’s detailed breakdown of material, labor, and subcontracting expenses to ensure accurate cost allocation and margin analysis. • Operations Managers: Tasked with managing daily operations, they use the app to gain insights into production costs, supporting informed decision-making around resource allocation and process optimization. • Supply Chain Managers: Interested in the overall cost impact of materials and labor, supply chain managers utilize the app to improve vendor management, control inventory costs, and plan future purchasing. • Financial Analysts: Charged with analyzing profitability, financial analysts use the app’s margin calculations to evaluate production order performance and support pricing strategies that align with financial goals. • Business Owners and Executives: Looking for a high-level view of production efficiency and profitability, executives use the app’s insights to make strategic decisions, ensure profitability, and track operational performance. • Manufacturing Consultants: Supporting companies in streamlining their production processes, consultants leverage the app to provide insights and recommend adjustments that align production costs with client profitability goals.

Who Is the Company Behind Production Order Analysis?

  • Seller: Insight Works
  • Year Founded: 2008
  • HQ Location: Edmonton, AB
  • Twitter: @DMSInsightWorks
    393 Twitter followers
  • LinkedIn® Page: www.linkedin.com
    39 employees on LinkedIn®

Proglove

Insights, analytics, device management, and scanner data from the MARK family of wearable barcode scanners in the ProGlove software platform

Who Is the Company Behind Proglove?

  • Seller: PROGLOVE
  • Year Founded: 2014
  • HQ Location: Munich, Bavaria, Germany
  • LinkedIn® Page: www.linkedin.com
    263 employees on LinkedIn®

PROMOTIC

PROMOTIC system is a software tool used for visualization and control of technological processes in a wide spectrum of industrial branches.

Who Is the Company Behind PROMOTIC?

  • Seller: Promotic
  • Year Founded: 1991
  • HQ Location: Ostrava Vítkovice, CZ
  • LinkedIn® Page: www.linkedin.com
    8 employees on LinkedIn®

Propella Software

Propella is a fully integrated business management software system designed specifically with small-to-medium enterprises in mind. We believe Propella is the ultimate tool for growing organisations or for those who are simply not getting what they want out of their current system.

Who Is the Company Behind Propella Software?

Provideam

Provideam is a comprehensive Overall Equipment Effectiveness software designed to assist manufacturing businesses in monitoring, analyzing, and optimizing their production performance. By tracking key manufacturing metrics such as availability, performance, and quality, Provideam enables organizations to maximize equipment efficiency and minimize downtime. Its intuitive dashboards offer real-time visibility into machine status, production rates, and defect rates, allowing managers to continuously monitor performance and promptly identify areas for improvement. The software integrates seamlessly with existing manufacturing systems and IoT devices, ensuring accurate and up-to-date data collection. Additionally, Provideam provides detailed reporting and analytics, offering insights into production trends, operational bottlenecks, and efficiency levels, thereby facilitating data-driven decision-making and strategic planning. With its user-friendly interface and powerful functionality, Provideam empowers manufacturers to enhance production efficiency, improve product quality, and drive continuous improvement in their operations. Key Features and Functionality: - Real-Time Monitoring: Provides live dashboards displaying machine status, production rates, and defect rates. - Advanced Data Collection: Integrates with existing manufacturing systems and IoT devices for accurate data gathering. - Detailed Reporting and Analytics: Offers insights into production trends, operational bottlenecks, and efficiency levels. - Alerts and Notifications: Ensures prompt issue resolution to maintain optimal production flow. - User-Friendly Interface: Simplifies navigation and data interpretation for users at all levels. Primary Value and Solutions Provided: Provideam addresses the critical need for manufacturing businesses to monitor and enhance their production performance. By offering real-time insights and comprehensive analytics, it enables organizations to identify inefficiencies, reduce downtime, and improve product quality. This leads to increased operational efficiency, cost savings, and a competitive edge in the market. The software's seamless integration with existing systems ensures a smooth implementation process, allowing businesses to quickly realize the benefits of enhanced production monitoring and optimization.

Who Is the Company Behind Provideam?

Prumatech e-String

Material Cataloguing, Structuring and Unique Technical Specifications Generator The application facilitates the User to manage the end to end process of Material Cataloguing from the request generation stage, internal approvals, auto description framing thru user friendly technical templates & seamless data flow to either SAP ECC or S/4HANA for transaction processing.

Who Is the Company Behind Prumatech e-String?

PST Convertor

Standalone Outlook PST converter to export PST files to MBOX, EML, MSG, PDF, HTML, and Office 365 without installing Microsoft Outlook.

Who Is the Company Behind PST Convertor?

PunchOut by Netgain

Netgain PunchOut is a fully integrated procurement automation solution designed to simplify and streamline purchase order creation, supplier catalog access, and procurement workflows directly within NetSuite. By enabling real-time PunchOut catalog integration, businesses can seamlessly connect to supplier e-commerce sites, select items, and return them to NetSuite for approval and order processing—eliminating manual data entry and reducing procurement inefficiencies. With Netgain PunchOut, organizations can enforce pre-negotiated vendor pricing, improve purchasing accuracy, and accelerate procurement cycles without switching between multiple systems. By automating the process from supplier selection to purchase order creation, PunchOut ensures compliance with procurement policies and reduces the risk of human error. The ability to instantly pull in real-time product availability, pricing, and specifications from supplier catalogs enhances visibility and financial control, allowing businesses to optimize their procurement strategies. As a native NetSuite solution, Netgain PunchOut integrates seamlessly within NetSuite’s purchasing workflows, eliminating the need for external procurement platforms. By keeping all purchasing activity within NetSuite, businesses gain better oversight, streamlined approvals, and improved cost management. This solution is ideal for industries that handle high purchase order volumes, such as biopharmaceuticals, manufacturing, healthcare, and financial services, where procurement efficiency is a critical component of operational success. Netgain PunchOut is designed to help procurement teams save time, reduce costs, and ensure purchasing compliance, all while providing a seamless shopping experience within NetSuite. With real-time connectivity to supplier catalogs, automated PO creation, and full visibility into spending, organizations can eliminate manual procurement bottlenecks and transform their purchasing process into a fast, accurate, and scalable workflow. Trusted by finance and procurement teams, Netgain PunchOut simplifies supplier management, accelerates purchasing, and enhances procurement efficiency—all while maintaining complete control over purchasing decisions.

Who Is the Company Behind PunchOut by Netgain?

  • Seller: Netgain Solutions
  • Year Founded: 2018
  • HQ Location: Englewood, Colorado, United States
  • Twitter: @netgainsolution
    24 Twitter followers
  • LinkedIn® Page: www.linkedin.com
    134 employees on LinkedIn®

QAVACH HSE System

Quantum’s Qavach is an advanced, AI-driven Health, Safety, and Environment (HSE) software designed specifically for container and cargo terminals, offering real-time safety management, automated incident response, and streamlined compliance. It is a specialised solution for the unique challenges faced by container and cargo terminals. Unlike generic HSE platforms, Qavach is tailored to the operational complexity of ports and terminals, where safety risks, environmental compliance, and workforce coordination are critical. Keeping a clear perspective on the full extent of possibilities, Qavach has been created, giving the Terminal the choice to start with the Core, select other modules as needed, and be assured of an ever-evolving, growing product that will continue to address all their safety needs. Why Quantum’s Qavach? Many traditional HSE software programs require extensive customisation to meet your specific needs. This customisation meant a hefty price tag and endless tinkering, driving up the total cost of ownership (TCO). Quantum’s HSE system, QAVACH, is different. The system is designed to be flexible, allowing businesses to adjust it to their unique workflows without the need for expensive coding. This eliminates hidden costs and streamlines implementation. QAVACH is more than just HSE software; it's an investment in your company's safety, compliance, and overall efficiency. By focusing on value over TCO, QAVACH empowers you to achieve your HSE goals without going over budget. Here's how Reduced Incident Rates: Proactive risk assessments streamlined incident reporting, and data-driven insights help you identify and mitigate hazards before they turn into costly incidents. Improved Efficiency: Automated reporting and investigation workflows save valuable time and resources. Easy-to-use training modules ensure consistent knowledge across your workforce, reducing the risk of human error. Enhanced Employee Safety: A focus on preventative measures and safety awareness fosters a culture of safety, leading to a healthier and happier workforce. When you invest in QAVACH, you're gaining a strategic partner for long-term success. Here's what sets QAVACH apart: Scalable: QAVACH adapts to your specific needs, regardless of company size or industry. Customizable: Tailor risk assessments, training modules, and reporting features to your unique operations. Data-driven insights: Gain actionable insights from safety data to continuously improve your HSE program and identify areas for further optimisation. Mobile access: Access QAVACH features anytime, anywhere, on any device.

Who Is the Company Behind QAVACH HSE System?

QC Weigh Software

QC Weigh allows you to observe plant-wide quality control data from a single PC.

Who Is the Company Behind QC Weigh Software?

  • Seller: Doran
  • Year Founded: 1976
  • HQ Location: St Charles, US
  • LinkedIn® Page: www.linkedin.com
    16 employees on LinkedIn®

Qi Screen

Qi Screen is a touchscreen-based software designed for smart factories, enabling shop floor teams to capture valuable data quickly and intuitively. Whether you're conducting quality inspections, floor audits, Gemba walks, repair validations, or tracking Six Sigma project phases, Qi Screen helps digitize and standardize your input process—driving faster results in quality improvement and continuous improvement initiatives. It's built for high-visibility, real-time use on industrial monitors, tablets, or PCs, making it a powerful tool for data-driven decision-making right from the shop floor. 🔑 Key Features ✔️ Visual Data Capture via Touchscreen or Mouse Operators can upload part images (up to 9 per screen), then tap on defects to record issues instantly. This reduces manual data entry errors and increases inspection accuracy. ✔️ Text‑to‑Speech & Voice‑to‑Text Comments Users can type or speak inspection notes. Voice input is converted to text in real time—enabling detailed, qualitative feedback that supports richer problem definitions. ✔️ Live Dashboards & Historical Data Export View live graphics showing defect trends and inspection stats. Download full history for audits, root cause analysis, or KPI tracking. ✔️ Role-Based Access & Remote Management Admins control who can access and configure screens, group related screens by department or area, and manage configurations remotely across the plant. ✔️ Stationary or Portable Deployment Install Qi Screen on touchscreen monitors or use it on tablets and PCs. Ideal for fixed inspection stations or mobile audit needs. ✔️ AI Enabled Insights (Optional Module) An AI assistant helps identify patterns in defect data—e.g., “Water leaks are your 3rd largest issue, up 15% in 3 months”—supporting faster problem-solving and predictive actions. ✔️ Surface Inspection Mode With the “Surface” version, users define inspection touchpoints on part images, configure defect types and shifts, and capture structured surface defect data efficiently. ✅ Core Benefits 👉🏻 Increase Inspection Accuracy: Touch-based inputs and voice annotations provide precise and detailed defect capture. 👉🏻 Accelerate Problem Solving: Real-time dashboards and AI insights enable faster root cause detection and trend identification. 👉🏻 Enhance Efficiency: Reduces cycle time by eliminating manual entry and consolidating audit and inspection workflows. 👉🏻 Scale Flexibly: Deploy on any screen or device; scales across shifts and inspection points with role-based admins. 👉🏻 Support Lean & CI: Enables data-driven Gemba walks, shifts comparisons, and Six Sigma DMAIC project support. 💫 Best For: Manufacturers with manual or visual inspection needs—especially in stamping, plastics, paint, BIW, or similar operations. Ideal for Quality Managers, Production Engineers, and frontline inspectors seeking to digitize inspections, reduce errors, and improve first-pass yield.

Who Is the Company Behind Qi Screen?

Qualitygram

Qualitygram is a powerful mobile & web-based problem-solving and quality management tool designed to help manufacturing teams rapidly identify, log, and resolve problems directly from the shop floor. Developed by Orca Lean, Qualitygram enables frontline personnel to capture issues—complete with photos, videos, part numbers, barcodes—in real time, and engage cross-functional teams instantly for fast resolution . Key Features & Capabilities ✅ Instant Issue Capture & Collaboration Operators can use their smartphones to raise issues on the spot—tag relevant teams, attach media, and chat within the app. This replaces emails and fragmented messages with fast, structured communication. ✅ Centralized Tracking & Live Reporting Qualitygram's web dashboard provides clear visibility into live issues, status updates, root causes, corrective actions, and resolution timelines. Ideal for effective Gemba walks and streamlined meetings. ✅ AI-Enhanced Insights (Optional Module) Tap into optional LLM and NLP-powered analysis to query data via chat, extract common causes, and build a growing knowledge library—preserving critical know-how as employees retire. ✅ Structured Problem-Solving Workflow Qualitygram supports PDCA root-cause methodologies, linking issues to metrics. Typical problem resolution takes 0–30 days for basic issues, 30–60 days for intermediate, and over 90 for complex ones. ✅ Support for Product Launches & Preventive Control Handles 3–5× more issues during new product or process introductions by engaging teams quickly and managing problems to closure. ✅ Deployment & Access Available as mobile apps (Android/iOS) and secure web access, with role-based permissions across multiple plant sites. Business & Operational Benefits 👉🏻 Reduce Time-to-Resolution - Accelerate problem-solving cycles to boost KPIs for quality, productivity, efficiency, and delivery. 👉🏻 Build Knowledge Over Time - Catalog lessons learned, CAPAs, and root causes for reuse in future launches and prevention. 👉🏻 Enhance Team Discipline & Culture - Notifications, live tracking, and accountability help establish a culture of continuous improvement. 👉🏻 Improve Meeting Productivity - Quickly navigate issues during daily reviews using the dashboard’s clear drill-down and reporting tools. 👉🏻 Preserve Tribal Knowledge - AI-assisted insights help retain expert know-how from retiring employees and new process onboarding. 💡 Ideal For Plant and quality leaders (Quality Assurance, Production, Maintenance, EHS) in automotive, aerospace, electronics, medical device, and high-mix manufacturing. Especially useful during product launches or complex operations that demand quicker root-cause resolution and tighter cross-functional coordination.

Who Is the Company Behind Qualitygram?

Quest Stat

Automate, secure and streamline the application change management process. Eliminate time-consuming, manual tasks that introduce risk into Oracle and PeopleSoft-based ERP systems. With Stat, an automated ERP change management solution, you can easily secure workflows and migrations, apply business rules, enforce role-based security, and gain approval for code changes before they move to production.

Who Is the Company Behind Quest Stat?

  • Seller: Quest Software
  • Year Founded: 1987
  • HQ Location: Austin, TX
  • Twitter: @Quest
    17,109 Twitter followers
  • LinkedIn® Page: www.linkedin.com
    3,507 employees on LinkedIn®
  • Ownership: NYSE: DGX

QuickWorks MRP

Godelm is the best Software Development Company. Our development capacity for technology is only limited by your vision. We are professional to complete the most complex projects with ease and spare no expense in ensuring your satisfaction.

Who Is the Company Behind QuickWorks MRP?

Subhransu Sahu
SS
Researched and written by Subhransu Sahu
Updated February 5, 2026