Best Location Intelligence Software - Page 23

How Many Location Intelligence Software Products Does G2 Track?

Total Products under this Category: 362

Category Stats (Nov 2026)

  • Average Rating: 4.41/5 The average rating of products in this category, based on all submitted ratings
  • Top Trending Product: Smappen (+12.18%) - Among all products in this category, Smappen recorded the largest rating increase compared to last month

Last updated: November 01, 2026

How Does G2 Rank Location Intelligence Software Products?

Why You Can Trust G2's Software Rankings:

  • 30 Analysts and Data Experts
  • 39,600+ Authentic Reviews
  • 362+ Products
  • Unbiased Rankings

G2's software rankings are built on verified user reviews, rigorous moderation, and a consistent research methodology maintained by a team of analysts and data experts. Each product is measured using the same transparent criteria, with no paid placement or vendor influence. While reviews reflect real user experiences, which can be subjective, they offer valuable insight into how software performs in the hands of professionals. Together, these inputs power the G2 Score, a standardized way to compare tools within every category.

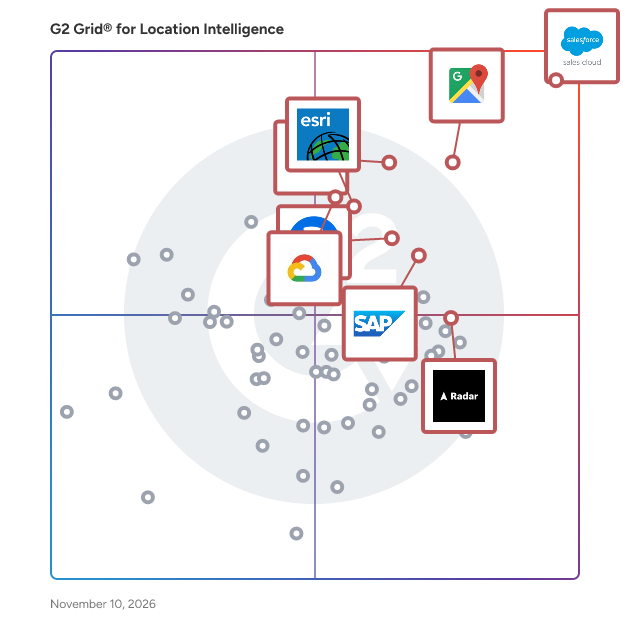
G2 Grid® for Location Intelligence Software

G2 Grid® for Location Intelligence Software plotting products by satisfaction and market presence

Highlighted products: Salesforce Sales Cloud, Google Maps Platform, Tableau, SAP HANA Cloud, Alteryx, Esri ArcGIS, Google Earth Engine, and Radar.

Underlying data: [Grid® JSON](https://www.g2.com/categories/location-intelligence/grids.json?focus%5B%5D=agentforce-sales-formerly-salesforce-sales-cloud&focus%5B%5D=google-maps-platform&focus%5B%5D=tableau&focus%5B%5D=sap-hana-cloud-2025-10-01&focus%5B%5D=alteryx&focus%5B%5D=esri-arcgis&focus%5B%5D=google-earth-engine&focus%5B%5D=radar-labs-inc-radar)

Social Explorer

Social Explorer's demographic mapping software is used by educational institutions, government agencies, non-profits, and for-profit companies in the marketing, real estate, and utilities industries to understand their communities. Build maps and reports using over 500,000 variables from built-in crime, environmental, health, and social datasets in order to profile the neighborhoods, census blocks, zip codes, counties, or states that matter most to your organization. All of this is available via Social Explorer's user-friendly interface, making it the perfect tool for users who need location intelligence but don't have extensive GIS training.

Who Is the Company Behind Social Explorer?

AI can help you find the answers. G2 helps you trust them.

Connect G2 to Claude or ChatGPT for answers grounded in G2's trusted reviews, comparisons, and pricing from real user insights.

How it works

Spexi

The First Decentralized Aerial Imagery Network—Built for Real-Time Insight Spexi is the first company in the world to create a decentralized, automated drone imagery network—delivering high-resolution aerial data faster, cleaner, and more affordably than any traditional method. Built on the open LayerDrone protocol, Spexi is changing how governments and businesses see and understand the world from above. Unlike satellites or fixed-wing aircraft, which are slow, expensive, and limited in resolution, Spexi captures imagery that’s 900× more detailed, 200× faster, and 50× more affordable—all with 97% fewer emissions. Data is captured by local, qualified drone pilots using fully automated flight plans across standardized zones called Spexigons. The result is consistent, ultra-accurate imagery delivered in hours—not weeks or months. Spexi’s decentralized model makes it the first truly scalable system for on-demand aerial data. It’s not just a better alternative—it’s a fundamentally different way of collecting Earth intelligence. From infrastructure and urban planning to disaster response, inspections, and environmental monitoring, Spexi empowers decision-makers with fresh, verified, and standardized imagery whenever it’s needed. And with flexible per-area pricing, you only pay for the coverage you require—whether it’s a single site or a full city scan. Spexi isn’t just a product—it’s a new infrastructure layer for the physical world. For the first time, real-time, high-resolution geospatial data is accessible, affordable, and built to scale.

Who Is the Company Behind Spexi?

Spotfic

Spotfic is an AI-powered location intelligence and site selection platform that tells you whether a business location will work, before you sign the lease. Enter any address and business type, and in about 60 seconds Spotfic generates a 14-section location analysis report with a clear 0–10 Go/No-Go opportunity score. Choosing the wrong location is one of the most common reasons small businesses fail, yet most founders still make this decision on gut feel, broker claims, or a single site visit. Traditional site selection consulting costs thousands of dollars and takes weeks. Enterprise location analytics platforms are priced for large chains. Spotfic makes professional-grade location analysis accessible to everyone: pay-as-you-go pricing from $9, no subscription, and credits that never expire. Every report combines live data with AI analysis. Competitor mapping is drawn in real time from Google Maps, every competing business near your address with ratings, review counts, distances, and price positioning, so you can see market saturation at a glance. Foot traffic estimation identifies nearby anchors (transit stations, malls, markets, offices) and models expected daily customer traffic with peak-hour patterns. Demographic analysis covers population, age profile, income levels, and target-audience fit; in the United States this is built on Census micro-area data. The report also includes a commercial rent benchmark for the address, a SWOT analysis, financial outlook with revenue estimates and break-even timeline, market trends, alternative business suggestions for the same location, and a 90-day launch plan. What sets Spotfic apart is honesty. The report clearly labels which insights come from hard data and which are AI-generated estimates, each with a confidence level, and it will tell you NO when a location doesn't make sense, not just sell you optimism. Reports can be exported as professional PDFs to share with partners, investors, landlords, or franchisors, and a built-in AI assistant lets you ask follow-up questions about your report. Spotfic supports 60+ business types, restaurants, cafes, gyms, salons, clinics, retail stores, franchises, cloud kitchens and more, and works across India, the United States, the United Kingdom, Canada, and Australia. It is built for first-time founders evaluating their first commercial lease, franchise owners and expansion teams comparing candidate territories, and commercial real estate advisors who want data-backed site recommendations for their clients. See a complete sample report at spotfic.com/sample-report, no signup required.

Who Is the Company Behind Spotfic?

StatPlanet

StatPlanet is an out-of-the box solution to rapidly transform a spreadsheet or database into an interactive dashboard. With its intuitive interface, even new users can instantly explore the interactive graphs and maps, and filter down to indicators and areas of interest.

Who Is the Company Behind StatPlanet?

  • Seller: StatSilk
  • Year Founded: 2009
  • HQ Location: Sydney, AU
  • LinkedIn® Page: www.linkedin.com
    2 employees on LinkedIn®

StellaSpark Nexus

StellaSpark Nexus is a real-time digital twin platform for monitoring and simulating the natural and built environment across sectors such as urban planning, public safety, construction, water management, energy, mobility, telecommunications, forestry, and environmental management. It enables governments, NGOs, utilities, contractors, engineers, and technical consultants to automate environmental compliance, identify risks and opportunities, quantify the impact of infrastructure projects or environmental change, track progress toward policy objectives and save time by seamlessly sharing data with partner organizations and public stakeholders. The platform integrates live data from virtually any source - including IoT sensors, geospatial datasets, photos, and web-scraped feeds - and transforms it into performant, interactive 2D and 3D maps and time-series charts that are always up-to-date. Users can simulate scenarios, calculate metrics or continously generate operational forecasts by deploying physics-based models, machine learning algorithms, or their own custom scripts directly within the digital twin. Secure APIs and open data portal functionality make it easy to share data and insights with partners, public stakeholders, and external tools. # Features ## Link map features with timeseries and photos Select any feature on the map to view its live sensor data, historical trends, associated properties or photos. This cuts investigation time from hours to minutes. ## Visualize in 2D or 3D Bring raster and vector data to life in 2D or 3D maps. Apply rule-based or data-driven coloring to map features to highlight locations with anomalies. Time travel to inspect historical states or modeled future scenarios. ## Explore time series with interactive charts Connect sensor measurements to spatial objects or regions and display results in interactive charts. Visualize thresholds to detect exceedances of safety, compliance, or operational limits. Chart configuration supports custom indicators, aggregation methods, and domain-specific layouts. ## Connect anything Integrate data from virtually any spatial format and protocol (KML, GML, GeoJSON, Geotiff, WMTS, WFS, HDF, NetCDF, Shapefile), photos, time series from IoT devices and sensors such as JSON, CSV, XML or semi-structured data from websites. Use one of the 200+ data sources already available in Nexus or bring your own. ## Always up-to-date Keep data at its original source and let Nexus connect to it to bring it to life. Maps and charts update continuously, ensuring the digital twin reflects the current state of assets and environments without requiring manual re-imports or refreshes. ## Operational forecasting and scenario analysis Get decision support by simulating based on live data rather than static model inputs. Deploy built-in or user-supplied calculations, such as scripts in any programming language, trained machine learning algorithms, or physics-based models. Supported use cases include: - Scenario modeling (“what-if” studies) - Policy and performance indicator generation - Compliance and safety limit evaluation - Spatial interpolation - Continous operational forecasting ## Work from anywhere on any device Access the digital twin in the field or in the office. The browser-based viewer runs on desktop, tablet, and mobile without additional software installation. ## Share data with partners and citizens Use Nexus as an open data portal, or securily connect Nexus to external applications through REST APIs or direct database connections for programmatic access. Supported ecosystem integrations include GIS platforms (ArcGIS Online, QGIS), BI and analytics tools (Tableau, Power BI), and Python workflows for custom processing and automation.

Who Is the Company Behind StellaSpark Nexus?
StreetPOP

StreetPOP (Street Proof of Performance) is built for the companies that put advertising on the street: wheat paste and poster agencies, street team and promo agencies, flyering crews and sign installers. Your installers sign in with an emailed link, no passwords, and shoot proof photos and short videos in StreetPOP. Each one is stamped with its GPS location and the time it was taken, and the full-resolution original is kept. No signal? Photos save on the phone and upload by themselves. In the office, every photo lands on a live campaign map as it uploads, so you spot gaps while the team is still out. When the campaign is done, send your client a proof page: every location on a map, photos by day, CSV export, no login. Included in every plan, with no add-ons: Google Drive and Dropbox sync, video clips, reports by team member, campaign and market, a REST API with signed webhooks, and import from SimpleCrew. Plans are a flat monthly price by team size.

Who Is the Company Behind StreetPOP?

syte

Syte is an AI-powered real estate platform that provides real-time insights into property data, construction potential, project calculations, and energy efficiency. Designed for real estate professionals, including banks, estate agents, developers, and planners, Syte aims to digitize and decarbonize the real estate industry by offering data-driven solutions that maximize property value and minimize carbon emissions.

Who Is the Company Behind syte?

  • Seller: syte
  • Year Founded: 2021
  • HQ Location: Münster, DE
  • LinkedIn® Page: www.linkedin.com
    42 employees on LinkedIn®

Tamoco

Tamoco is an proximity mobile marketing technology and analytics platform for brands, advertisers and network owners.

Average Rating: 4.8/5.0

Total Reviews: 2

How Do G2 Users Rate Tamoco?

  • Ease of Use: 10.0/10 (Category avg: 8.8/10)

Who Is the Company Behind Tamoco?

  • Seller: Tamoco
  • Year Founded: 2012
  • HQ Location: N/A
  • LinkedIn® Page: www.linkedin.com
    1 employees on LinkedIn®

Who Uses This Product?

  • Company Size: 50% Medium, 50% Small

What Are Recent G2 Reviews of Tamoco?

What Are G2 Users Discussing About Tamoco?

The Rand Platform

Make smarter decisions that enhance efficiency across you entire fleet with our integrated, all-in-one fleet management system. The Rand Platform delivers solutions to common problems that occur across fleets in multiple industries with: Fleet and vehicle tracking, Asset and equipment tracking, Vehicle data monitoring and fuel management, Custom workflows, reports and alerts, Increased safety with telematics, Compliance with industry regulations

Average Rating: 4.0/5.0

Total Reviews: 5

How Do G2 Users Rate The Rand Platform?

  • Ease of Use: 6.7/10 (Category avg: 8.8/10)

Who Is the Company Behind The Rand Platform?

Who Uses This Product?

  • Company Size: 80% Large, 20% Medium

What Do G2 Reviewers Say About The Rand Platform?

AI-generated summary from verified user reviews

Pros
  • Users value the excellent customer support of The Rand Platform, enhancing their overall experience and satisfaction.
  • Users find the ease of use of The Rand Platform highly beneficial for efficient fleet management.
  • Users value the efficiency improvement from The Rand Platform, enhancing fleet management with simple implementation and accurate information.
  • Users value the GPS accuracy of The Rand Platform, enhancing vehicle information and fleet efficiency.
  • Users appreciate the installation ease of The Rand Platform, noting its simplicity in implementation and efficiency gains.
Cons
  • Users find the data inaccuracy in The Rand Platform frustrating, experiencing issues with unreliable reports and missing information.
  • Users report data management issues with The Rand Platform, leading to incomplete reports and unreliable trip history data.
  • Users report inaccuracy in reports, highlighting issues with negative mileage and missing trip history data.
  • Users face inadequate reporting on The Rand Platform, leading to unreliable data and frustrating experiences.
  • Users find the insufficient information in the Rand Platform's reports often leads to confusion and frustration.

What Are Recent G2 Reviews of The Rand Platform?

Thready Analytics

Thready Analytics is a location analytics service with a reporting dashboard.

Who Is the Company Behind Thready Analytics?

TRACK 1101

The rugged low-power tracker with long battery life with NB-IoT connectivity and guaranteed data recovery. Optimized for combined indoor and outdoor localization of assets. The tracker comes with an onboard temperature sensor and shock detection. Compatible with multiple external condition sensors. The tracker firmware can be upgraded over the air.

Who Is the Company Behind TRACK 1101?

  • Seller: Sensolus
  • Year Founded: 2013
  • HQ Location: Ghent, Flemish Region, Belgium
  • LinkedIn® Page: www.linkedin.com
    45 employees on LinkedIn®

Track My Ride

Track My Ride is Australia's trusted leader in premium GPS vehicle tracking, proudly serving the fleet management industry for over a decade. Our robust, reliable, and proven hardware paired with powerful, intuitive software solutions are specifically designed to simplify fleet operations, reduce workload, and deliver measurable cost savings. Our Australian-owned and operated business is uniquely positioned to understand and address the distinct needs of companies managing fleets of 20 or more vehicles, prioritising efficiency, reliability, and return on investment. Our flagship tracker, the GeoBeetle, is meticulously engineered to offer real-time vehicle monitoring, precise location tracking, and powerful fleet analytics. GeoBeetle’s advanced features include customisable geofencing, automatic alerts, detailed trip reports, driver behaviour monitoring, and comprehensive vehicle diagnostics. This translates directly into optimised fleet management, improved driver accountability, increased fuel efficiency, and substantial reductions in downtime and unnecessary expenses. We recognise the challenges fleet managers face daily: time pressure, resource management, compliance, and profitability. Track My Ride provides a streamlined, integrated solution proven to alleviate these concerns. By partnering with us, businesses experience immediate operational improvements and significant long-term savings. Our expert Australian-based customer support team ensures swift integration, minimal downtime during implementation, and reliable ongoing assistance whenever needed. Investing in Track My Ride means investing in proven reliability, local expertise, and tangible results. Our longevity and proven track record in the Australian market confirm our capability to deliver consistent excellence. When you choose Track My Ride, you're choosing a dependable partner dedicated to making your fleet management easier, safer, and more profitable. Make the strategic choice today: choose Track My Ride for an Australian-made GPS solution that clearly and demonstrably enhances your fleet’s productivity, efficiency, and profitability.

Who Is the Company Behind Track My Ride?

Traffic Monitor

Traffic Monitor connects to Google Search Console and turns raw performance data into a clear daily dashboard for bloggers and content creators. It works with any GSC-connected site, including WordPress, Tistory, Ghost, and custom Vercel or Netlify builds. The free plan includes one connected blog, 30 days of traffic history, and a basic dashboard with post-level performance. Paid plans add daily Discord traffic-drop alerts, keyword research with real search volume and competition data, SERP competitor analysis, weekly keyword rank tracking, AI-powered post SEO audits, and AI Overview citation tracking to see whether content is cited in Google's AI Overviews. Setup takes under two minutes: sign in with Google, connect a Search Console property, and the dashboard is ready immediately. Pro plans include a 14-day free trial, no credit card required.

Who Is the Company Behind Traffic Monitor?

Bijou Barry
BB
Researched and written by Bijou Barry
Updated October 3, 2024