Satelite.ai
Who Is the Company Behind Satelite.ai?
- Seller: rFlex.io
- Year Founded: 2016
- HQ Location: La Reina, CL
-
LinkedIn® Page: www.linkedin.com
38 employees on LinkedIn®
Total Products under this Category: 313
Last updated: October 26, 2026
Why You Can Trust G2's Software Rankings:
G2's software rankings are built on verified user reviews, rigorous moderation, and a consistent research methodology maintained by a team of analysts and data experts. Each product is measured using the same transparent criteria, with no paid placement or vendor influence. While reviews reflect real user experiences, which can be subjective, they offer valuable insight into how software performs in the hands of professionals. Together, these inputs power the G2 Score, a standardized way to compare tools within every category.
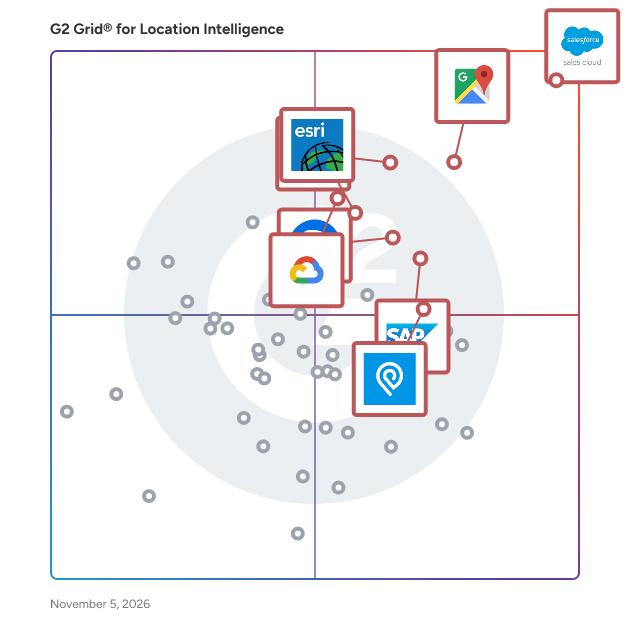
Highlighted products: Salesforce Sales Cloud, Google Maps Platform, Tableau, SAP HANA Cloud, Alteryx, Esri ArcGIS, Google Earth Engine, and IPinfo.
Underlying data: [Grid® JSON](https://www.g2.com/categories/location-intelligence/grids.json?focus%5B%5D=agentforce-sales-formerly-salesforce-sales-cloud&focus%5B%5D=google-maps-platform&focus%5B%5D=tableau&focus%5B%5D=sap-hana-cloud-2025-10-01&focus%5B%5D=alteryx&focus%5B%5D=esri-arcgis&focus%5B%5D=google-earth-engine&focus%5B%5D=ip-info-ipinfo)
SiteGaps ~ Location intelligence for site decisions SiteGaps brings demographics, demand, and competitor coverage onto a single map, and packages the lot into a clean, sharable analysis report. Built to answer one question end-to-end: where should I open next, and what does the catchment look like? Define the catchment any way you draw it Drive-time isochrones with traffic-aware profiles, radius circles, ABS SAL suburb boundaries, or hand-drawn polygons for irregular shapes. Every catchment shape feeds the same demographic and supply pipeline, so the rest of the report stays consistent regardless of how you frame the area. Granular census data analysis Population, age structure, income bands, household composition, dwelling mix, education, employment, and more — apportioned into your catchment and reconciled to the headline total. The platform delivers 20+ data tables across 6 demographic sections, with state benchmark and 2021 census comparison columns built in. Population growth projections run through 2032 so you can size catchments for the medium term, not just today. Map the competitors that matter Tenant-grouped venue lists span small, medium, and large format retail, gyms and wellness, petrol stations, food and beverage, and any custom POI categories added on request. Filter to your full supply radius or just the trade area, with counts inside primary and secondary catchments making competitive density immediate. Over 100 named tenants are tracked with canonical labels, and live competitor markers sit directly on the map. One report. Every section. Compared side-by-side. The full demographic and market analysis renders as a single read-mode report, with text or chart views available per table. Save catchment snapshots to a comparison report and stack two or more locations against each other in a side-by-side matrix view — the workflow site selection teams actually need when they're choosing between candidates. Built for site selection teams Property developers, franchisors, network planners, QSR operators, childcare providers, retail chains, fitness brands, fuel and convenience networks, and urban planners. Sign up and start evaluating sites the same day. No GIS engineer required, no procurement cycle, no implementation fee. Why teams choose SiteGaps Self-serve free trial, live in minutes Transparent pricing with monthly billing ABS census-grade data reconciled to headline totals Continuously expanding competitor coverage, new tenants added on request Comparison reports that stack catchments side-by-side
Connect G2 to Claude or ChatGPT for answers grounded in G2's trusted reviews, comparisons, and pricing from real user insights.
Skyhook is a global location network with more than 4.5 billion Wi-Fi access points and millions of venues. The massive amount of data collected powers all of our products, providing the best location for any app or device - and delivering it with unmatched context.
Social Explorer's demographic mapping software is used by educational institutions, government agencies, non-profits, and for-profit companies in the marketing, real estate, and utilities industries to understand their communities. Build maps and reports using over 500,000 variables from built-in crime, environmental, health, and social datasets in order to profile the neighborhoods, census blocks, zip codes, counties, or states that matter most to your organization. All of this is available via Social Explorer's user-friendly interface, making it the perfect tool for users who need location intelligence but don't have extensive GIS training.
The Aurora:GeoStudio® helps you gain insight into the location and behavior of things and people on a global scale.
The First Decentralized Aerial Imagery Network—Built for Real-Time Insight Spexi is the first company in the world to create a decentralized, automated drone imagery network—delivering high-resolution aerial data faster, cleaner, and more affordably than any traditional method. Built on the open LayerDrone protocol, Spexi is changing how governments and businesses see and understand the world from above. Unlike satellites or fixed-wing aircraft, which are slow, expensive, and limited in resolution, Spexi captures imagery that’s 900× more detailed, 200× faster, and 50× more affordable—all with 97% fewer emissions. Data is captured by local, qualified drone pilots using fully automated flight plans across standardized zones called Spexigons. The result is consistent, ultra-accurate imagery delivered in hours—not weeks or months. Spexi’s decentralized model makes it the first truly scalable system for on-demand aerial data. It’s not just a better alternative—it’s a fundamentally different way of collecting Earth intelligence. From infrastructure and urban planning to disaster response, inspections, and environmental monitoring, Spexi empowers decision-makers with fresh, verified, and standardized imagery whenever it’s needed. And with flexible per-area pricing, you only pay for the coverage you require—whether it’s a single site or a full city scan. Spexi isn’t just a product—it’s a new infrastructure layer for the physical world. For the first time, real-time, high-resolution geospatial data is accessible, affordable, and built to scale.
Spotfic is an AI-powered location intelligence and site selection platform that tells you whether a business location will work, before you sign the lease. Enter any address and business type, and in about 60 seconds Spotfic generates a 14-section location analysis report with a clear 0–10 Go/No-Go opportunity score. Choosing the wrong location is one of the most common reasons small businesses fail, yet most founders still make this decision on gut feel, broker claims, or a single site visit. Traditional site selection consulting costs thousands of dollars and takes weeks. Enterprise location analytics platforms are priced for large chains. Spotfic makes professional-grade location analysis accessible to everyone: pay-as-you-go pricing from $9, no subscription, and credits that never expire. Every report combines live data with AI analysis. Competitor mapping is drawn in real time from Google Maps, every competing business near your address with ratings, review counts, distances, and price positioning, so you can see market saturation at a glance. Foot traffic estimation identifies nearby anchors (transit stations, malls, markets, offices) and models expected daily customer traffic with peak-hour patterns. Demographic analysis covers population, age profile, income levels, and target-audience fit; in the United States this is built on Census micro-area data. The report also includes a commercial rent benchmark for the address, a SWOT analysis, financial outlook with revenue estimates and break-even timeline, market trends, alternative business suggestions for the same location, and a 90-day launch plan. What sets Spotfic apart is honesty. The report clearly labels which insights come from hard data and which are AI-generated estimates, each with a confidence level, and it will tell you NO when a location doesn't make sense, not just sell you optimism. Reports can be exported as professional PDFs to share with partners, investors, landlords, or franchisors, and a built-in AI assistant lets you ask follow-up questions about your report. Spotfic supports 60+ business types, restaurants, cafes, gyms, salons, clinics, retail stores, franchises, cloud kitchens and more, and works across India, the United States, the United Kingdom, Canada, and Australia. It is built for first-time founders evaluating their first commercial lease, franchise owners and expansion teams comparing candidate territories, and commercial real estate advisors who want data-backed site recommendations for their clients. See a complete sample report at spotfic.com/sample-report, no signup required.
StatPlanet is an out-of-the box solution to rapidly transform a spreadsheet or database into an interactive dashboard. With its intuitive interface, even new users can instantly explore the interactive graphs and maps, and filter down to indicators and areas of interest.
StreetPOP (Street Proof of Performance) is built for the companies that put advertising on the street: Wild Posting® and wheat-paste agencies, street team and promo agencies, flyering crews and sign installers. Your installers sign in with an emailed link, no passwords, and shoot proof photos and short videos in StreetPOP. Each one is stamped with its GPS location and the time it was taken, and the full-resolution original is kept. No signal? Photos save on the phone and upload by themselves. In the office, every photo lands on a live campaign map as it uploads, so you spot gaps while the team is still out. When the campaign is done, send your client a proof page: every location on a map, photos by day, CSV export, no login. Included in every plan, with no add-ons: Google Drive and Dropbox sync, video clips, reports by team member, campaign and market, a REST API with signed webhooks, and import from SimpleCrew. Plans are a flat monthly price by team size.
Tamoco is an proximity mobile marketing technology and analytics platform for brands, advertisers and network owners.
Average Rating: 4.8/5.0
Total Reviews: 2
Rating: 5.0/5.0 stars
— Ali Z.
Rating: 4.5/5.0 stars
— Hope H.
Thready Analytics is a location analytics service with a reporting dashboard.
Traffic Monitor connects to Google Search Console and turns raw performance data into a clear daily dashboard for bloggers and content creators. It works with any GSC-connected site, including WordPress, Tistory, Ghost, and custom Vercel or Netlify builds. The free plan includes one connected blog, 30 days of traffic history, and a basic dashboard with post-level performance. Paid plans add daily Discord traffic-drop alerts, keyword research with real search volume and competition data, SERP competitor analysis, weekly keyword rank tracking, AI-powered post SEO audits, and AI Overview citation tracking to see whether content is cited in Google's AI Overviews. Setup takes under two minutes: sign in with Google, connect a Search Console property, and the dashboard is ready immediately. Pro plans include a 14-day free trial, no credit card required.
TrafficZoom is a traffic analytics platform that provides reliable, address-specific traffic data and demographic context for location-based decisions. It solves the problem of outdated, sparse, or aggregated across multi-mile segments traffic counts. Unlike conventional sources that report traffic volumes averaged across long roadway segments, TrafficZoom delivers traffic counts and socio-economic metrics down to 15 ft so your site evaluations, impact studies, and trade-area analyses reflect what is actually happening at the location of interest. Key Capabilities: - AADT - Truck Percentage - Hourly traffic volumes - Weekly traffic distribution - Monthly traffic fluctuations - Traffic demographics - Automated site selection - algorithmic scoring and ranking of candidate sites for retail expansion based on traffic exposure and demographic fit.
