Best Data Visualization Tools - Page 40

How Many Data Visualization Tools Products Does G2 Track?

Total Products under this Category: 762

Category Stats (Nov 2026)

  • Average Rating: 4.44/5 The average rating of products in this category, based on all submitted ratings
  • Top Trending Product: Upsolve AI (+1.75%) - Among all products in this category, Upsolve AI recorded the largest rating increase compared to last month

Last updated: November 01, 2026

How Does G2 Rank Data Visualization Tools Products?

Why You Can Trust G2's Software Rankings:

  • 30 Analysts and Data Experts
  • 22,900+ Authentic Reviews
  • 762+ Products
  • Unbiased Rankings

G2's software rankings are built on verified user reviews, rigorous moderation, and a consistent research methodology maintained by a team of analysts and data experts. Each product is measured using the same transparent criteria, with no paid placement or vendor influence. While reviews reflect real user experiences, which can be subjective, they offer valuable insight into how software performs in the hands of professionals. Together, these inputs power the G2 Score, a standardized way to compare tools within every category.

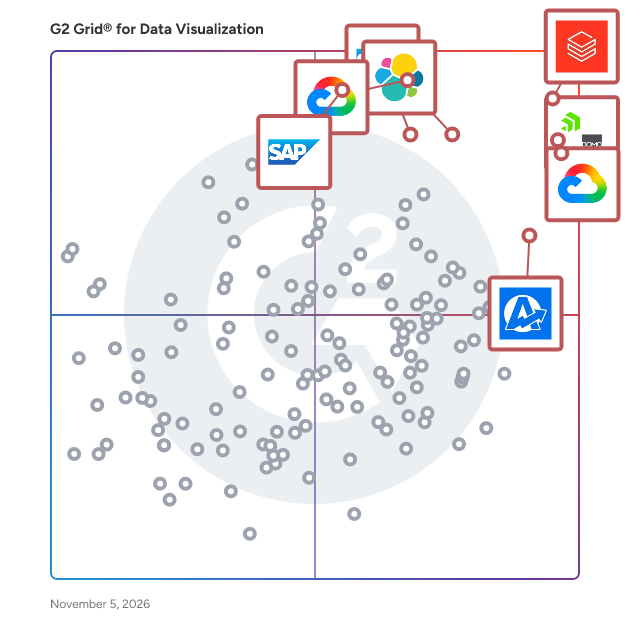
G2 Grid® for Data Visualization Tools

G2 Grid® for Data Visualization Tools plotting products by satisfaction and market presence

Highlighted products: Databricks, Domo, Looker, Data Studio, Elastic Stack, AgencyAnalytics, SAP HANA Cloud, and SAP Analytics Cloud.

Underlying data: [Grid® JSON](https://www.g2.com/categories/data-visualization-tools/grids.json?focus%5B%5D=databricks&focus%5B%5D=domo&focus%5B%5D=looker&focus%5B%5D=data-studio&focus%5B%5D=elastic-stack&focus%5B%5D=agencyanalytics&focus%5B%5D=sap-hana-cloud-2025-10-01&focus%5B%5D=sap-analytics-cloud&segment=all)

NodeXL Pro

NodeXL is a social network analysis and visualization tool that runs inside Microsoft Excel, making professional network science accessible to analysts, researchers, marketers, and journalists without writing code. Instead of learning specialized software or a programming language, users work in a familiar spreadsheet to import, analyze, and visualize the relationships between people, accounts, topics, and content. With NodeXL Pro, users import network data directly from X (Twitter), Reddit, YouTube, Wikipedia, Bluesky, Instagram, WhatsApp, and enterprise social listening platforms such as Brandwatch, Meltwater, and Talkwalker. Once data is imported, NodeXL automatically calculates the network metrics that reveal how a conversation actually works, including degree, betweenness centrality, and PageRank, and applies community detection algorithms to surface tightly connected groups. Built-in layout algorithms and customizable visualizations turn this analysis into clear, publication-ready network maps and graphs. NodeXL helps teams answer the questions that matter in social media analytics and online research: Who are the most influential voices in this conversation? Which communities are forming around a topic, brand, or event? How is information or misinformation, spreading across a network? It is widely used for social media monitoring, influencer identification, marketing and brand research, organizational network analysis, OSINT and investigative journalism, and academic study. A defining strength of NodeXL is its local-first, Excel-native architecture. Data stays on the user's machine, supporting reproducible methodology, raw data ownership, and the privacy standards required by enterprise, government, and academic users. The NodeXL ecosystem also includes NodeXL INSIGHTS, which transforms analysis into shareable, interactive dashboards for clients, executives, and collaborators, and NodeXL Academy, offering training, courses, and certification in network analysis. Originally developed in collaboration with Microsoft Research and Professor Ben Shneiderman of the University of Maryland, NodeXL has deep academic credibility. Its methodology is cited in more than 1,400 peer-reviewed publications and taught at over 400 universities worldwide. NodeXL is developed and supported by the Social Media Research Foundation, a California nonprofit dedicated to building open tools and open data for understanding social media. Available in Student, Academic/Nonprofit, and Commercial editions, as a Windows desktop license or a Cloud edition for Mac and Windows. NodeXL delivers the analytical depth of dedicated network science software with the ease of a spreadsheet, helping organizations measure, map, and understand the networks that shape their world.

Who Is the Company Behind NodeXL Pro?

NOORAI Platform

NOORAI is an AI-powered decision intelligence platform that helps organizations turn complex, fragmented data into clear, confident decisions. We unify enterprise and external data into a single environment, enabling teams to interact with their data conversationally, generate real-time insights, and move from analysis to action faster. With NOORAI, organizations can: - Integrate data across systems, APIs, files, and external sources - Interact using natural language - Generate AI-driven insights, dashboards, and reports - Forecast outcomes and run “what-if” scenarios - Assess the impact of market shifts, inflation, and macroeconomic trends on business performance - Automate analytics and decision workflows within a secure, enterprise-grade platform

Who Is the Company Behind NOORAI Platform?

  • Seller: NOORAI
  • Year Founded: 2024
  • HQ Location: Boston , US
  • LinkedIn® Page: www.linkedin.com
    11 employees on LinkedIn®

NovaceneAI Platform

The NovaceneAI® Platform is an AI-native solution designed to modernize organizational workflows by transforming unstructured data into actionable insights. It automates data analysis, streamlines decision-making processes, and accelerates time to value, enabling teams to focus on strategic initiatives rather than manual data processing. Key Features and Functionality: - Data Ingestion: Supports various data input methods, including API calls, web UI uploads, and extraction from unstructured files like MS Office documents, PDFs, and images. - Intelligent Transformation: Applies AI and machine learning algorithms for tasks such as clustering, classification, theme and keyword extraction, sentiment analysis, and more. - Custom Model Training: Allows users to train and retrain custom models without specialized knowledge, ensuring the platform evolves with organizational needs. - Visualization and Reporting: Provides built-in dashboards for real-time data visualization and generates automatic reports to facilitate immediate insight analysis. - Deployment Flexibility: Offers multiple deployment options, including single-tenant, on-premise, and offline configurations, ensuring data privacy and compliance with organizational security standards. Primary Value and Problem Solved: The NovaceneAI Platform addresses the challenge of managing and deriving insights from large volumes of unstructured data. By automating data analysis and integrating AI-driven automation, it reduces manual effort, minimizes errors, and accelerates decision-making processes. This empowers organizations to uncover patterns and trends, optimize operations, and maintain a competitive edge in their respective industries.

Average Rating: 4.2/5.0

Total Reviews: 18

How Do G2 Users Rate NovaceneAI Platform?

  • Has the product been a good partner in doing business?: 8.3/10 (Category avg: 9.0/10)

Who Is the Company Behind NovaceneAI Platform?

Who Uses This Product?

  • Company Size: 44% Small, 28% Medium

What Are Recent G2 Reviews of NovaceneAI Platform?

AI can help you find the answers. G2 helps you trust them.

Connect G2 to Claude or ChatGPT for answers grounded in G2's trusted reviews, comparisons, and pricing from real user insights.

How it works

Nucleus Analytics

Nucleus is for everyone, from the marketing intern to the executive director. With its customizable reports and deeper levels of analysis, Nucleus is equipped to answer all your data questions.

Who Is the Company Behind Nucleus Analytics?

Numerics

Who Is the Company Behind Numerics?

  • Seller: Cynapse
  • Year Founded: 2001
  • HQ Location: Toronto, CA
  • LinkedIn® Page: www.linkedin.com
    13 employees on LinkedIn®

Numetric

Numetric is a cloud-based software and data services company built for DOT engineers by DOT engineers. We are dedicated to empowering these agencies to be more efficient, data-driven, and focused in making their roadways safer. HOW we deliver differentiated value: Data Expertise: We unlock the value of DOTs' data by preparing structuring, and managing that data easier, deeper analysis. APPs just for DOTs Our product suites are built specifically to automate and accelerate transportation engineers' most time-consuming processes. Easy, Flexible Sharing Our cloud-based apps make it easy to share data--in static reports, dashboards, or powerful analytics tools--with all stakeholders.

Average Rating: 4.3/5.0

Total Reviews: 42

How Do G2 Users Rate Numetric?

  • Has the product been a good partner in doing business?: 8.5/10 (Category avg: 9.0/10)

Who Is the Company Behind Numetric?

  • Seller: Numetric
  • Year Founded: 2015
  • HQ Location: Draper, US
  • LinkedIn® Page: www.linkedin.com
    39 employees on LinkedIn®

Who Uses This Product?

  • Top Industries: Civil Engineering, Computer Software
  • Company Size: 64% Medium, 21% Small

What Are Recent G2 Reviews of Numetric?

What Are G2 Users Discussing About Numetric?

Nuvue

Nuvue is a sales enablement system for MedTech. It combines content management, presentation delivery, customer training and CRM in one platform, delivered as a managed service with an embedded creative team, for medical device and aesthetics companies with 5 to 100+ reps. The platform runs on three engines. Win is what reps carry into the room: brand-controlled playbooks and presentations organized by sales stage, findable in seconds, shared as links rather than files, and impossible to download or edit. When a clinical claim changes, it changes for every rep at once. Grow is what happens after the sale: a branded portal for every practice or hospital account, with training content, marketing assets and a direct line to support, so adoption continues long after the device is delivered. Know is what leadership can see: pipeline, deals by stage, revenue and content usage in one dashboard, filterable by team and user, so decisions run on evidence rather than assumption. A native MedTech CRM with pipeline and deal tracking is included on every plan. Most customers use Nuvue to replace Salesforce or HubSpot, Showpad or Seismic, and Dropbox with one system. Nuvue's team handles implementation, rebuilding your existing content into the platform, setting up the CRM and training reps. Most companies are live within two weeks. Pricing is published, billed monthly by team size, with no long-term contract.

Who Is the Company Behind Nuvue?

  • Seller: VueLabs
  • Year Founded: 2019
  • HQ Location: New York, US
  • LinkedIn® Page: www.linkedin.com
    5 employees on LinkedIn®

Nveil AI

Nveil AI is an explainable AI platform that transforms raw data into production-ready, interactive visualizations — without writing a single line of code. Upload a CSV, Excel, JSON, or medical imaging file, describe what you need in plain language, and Nveil generates charts, dashboards, 3D renderings, heatmaps, and more in seconds. Unlike traditional data visualization tools that require mastering Python, R, or complex BI software, Nveil removes the technical barrier entirely. Its natural language interface lets researchers, analysts, healthcare professionals, and business teams go from raw dataset to actionable insight in a single conversation. No setup, no configuration, no learning curve. What sets Nveil apart is its deterministic AI architecture. While most AI-powered analytics tools rely on probabilistic language models prone to hallucinations, Nveil's proprietary engine — Choregraph™ — orchestrates every pipeline with verifiable, reproducible mathematics. Every visualization is explainable and auditable, making it suitable for regulated industries like healthcare, finance, and scientific research. Key capabilities include no-code data visualization with drag-and-drop support for CSV, XLSX, JSON, DICOM, and MHD formats; interactive exploration with pan, hover, and parameter adjustment on charts, maps, networks, scatter plots, volumetric renderings, and surfaces; large-scale data handling for datasets of several gigabytes; export flexibility to images, PDFs, or embeddable HTML; real-time collaboration across devices; and data privacy by design — Nveil never uses your data to train its models. Nveil serves a wide range of use cases: from medical imaging reconstruction and tumor evolution simulation to fraud detection, Benford's Law analysis, and cross-sectional dataset exploration. Backed by years of research from TIMC Lab and Université Grenoble Alpes, the platform bridges the gap between academic rigor and business-ready analytics. Whether you're a data scientist looking to accelerate exploratory analysis, a researcher who needs reproducible visualizations for publication, or a business team tracking KPIs without waiting on IT — Nveil AI delivers instant, trustworthy, and beautiful data storytelling.

Who Is the Company Behind Nveil AI?

  • Seller: Nveil
  • Year Founded: 2023
  • HQ Location: Grenoble, FR
  • LinkedIn® Page: www.linkedin.com
    4 employees on LinkedIn®

Observable

Observable is a data analysis and exploration platform that helps data analysts and their stakeholders understand their business data, build charts and other visualizations, and communicate insights. Built for teams, powered by AI, and backed by a global community of data practitioners, Observable offers a single workspace for data exploration, custom chart creation, and cross-functional data collaboration. Observable's collaborative whiteboard for data analysis, Observable Canvases, helps analysts with exploratory data analysis, advanced chart creation, and data storytelling. It makes the data analysis process more streamlined by bringing querying, chart creation, and sharing all in one platform. Users can choose between code, UI, or AI, and easily move between all three depending on the task at hand. The AI is also deeply integrated and turnkey, operating transparently on the canvas to allow users to understand, interpret, and fine-tune its results and reasoning, building trust in its recommendations. Additionally, whiteboarding features like comments, illustrations, and annotations help bring stakeholders into the data analysis process to reduce frustrating back-and-forths. Sophisticated data visualizations such as beeswarms, Sankey diagrams, choropleths, and more are available out-of-the-box to enable users to easily create and share expressive, interactive charts. Users can embed charts in internal apps, and generate polished, stakeholder-friendly dashboards in just a few clicks.

Average Rating: 4.4/5.0

Total Reviews: 4

How Do G2 Users Rate Observable?

  • Has the product been a good partner in doing business?: 10.0/10 (Category avg: 9.0/10)

Who Is the Company Behind Observable?

  • Seller: Observable
  • Year Founded: 2017
  • HQ Location: San Francisco, US
  • LinkedIn® Page: www.linkedin.com
    23 employees on LinkedIn®

Who Uses This Product?

  • Company Size: 50% Small, 25% Medium

What Do G2 Reviewers Say About Observable?

AI-generated summary from verified user reviews

Pros
  • Users love the seamless data exploration with Observable's reactive programming and effortless D3.js integration.
  • Users value the real-time collaboration of Observable, making teamwork more effective and enjoyable.
  • Users love the seamless data exploration offered by Observable, enhancing collaboration and visual output effortlessly.
  • Users admire the beautiful visual output of Observable, enhancing their data exploration and presentation experience.
  • Users highlight the effortless ease of use with Observable, enabling seamless data exploration and collaboration.
Cons
  • Users often find Observable browser-heavy with large data sets, impacting performance and usability in complex applications.
  • Users find Observable to be browser-heavy when handling large data sets or complex applications, affecting performance.
  • Users find Observable to have slow performance, particularly with large data sets or complex applications.

What Are Recent G2 Reviews of Observable?

Odoo Dashboards

Build stunning dashboards directly inside your Odoo workspace - no coding, no exports, no external tools. Just pick your data, drag your charts, and share insights with your team in minutes.

Who Is the Company Behind Odoo Dashboards?

Ollagraph

Landing page introducing Ollagraph and its web data APIs for AI applications and automation.

Who Is the Company Behind Ollagraph?

Omics Playground

Omics Playground is a cloud-based self-service analytics platform for the analysis and visualization of transcriptomics and proteomics data. The platform offers features such as expression and enrichment analysis, drug enrichment analysis, advanced batch effects analysis and many more.

Average Rating: 5.0/5.0

Total Reviews: 1

Who Is the Company Behind Omics Playground?

Who Uses This Product?

  • Company Size: 100% Medium

What Are Recent G2 Reviews of Omics Playground?

Open Architects Analytics Platform

Open Architects is the integrated decision-making platform built specifically for K-12 school districts. We unify your student, HR, and finance data into a single source of truth, giving superintendents, business officials, HR directors, principals and educators the clarity they need to lead with confidence. Unlike point solutions that silo student outcomes from the operational decisions that drive them, Open Architects connects the dots across your entire district. Want to know whether your highest-need schools are also your most experienced-teacher schools? Whether your special education staffing aligns with enrollment trends? Whether your budget projections hold up against your five-year staffing plan? Open Architects answers these questions in minutes, not months. What's included: - Pre-built dashboards for student achievement, attendance, enrollment, staffing, finance, HR, and operations — designed by former district leaders who know what questions actually matter. Customizations are available. - MTSS intervention tools that unify academic, attendance, and behavior data to help teams identify at-risk students, plan interventions, and monitor progress across tiers - Archie, our K-12 AI assistant, who answers natural-language questions about your district's data and surfaces insights you didn't know to ask for - The Family Report, a school-to-home communication tool that gives parents transparent, actionable views of their child's progress - True data integration across your SIS, ERP, HRIS, assessment platforms, and state reporting systems Why districts choose Open Architects: Founded in 2017, we're family-owned and investor-free. Our founders are former district practitioners, and we serve 200+ districts across 12 states, growing primarily through word of mouth from superintendents who trust us. Our three uniques: 1. True Partner: we work alongside your team, not just sell you a license 2. All Your Data in One Place: student, HR, and finance, finally connected 3. Focus on Action: dashboards and insights designed to drive decisions, not just display data Who we serve: K-12 public school districts, charter schools, and regional/collaborative organizations ranging from small rural districts to large urban systems. We support districts in 12 states — including MA, CT, NJ, NY, CA, TX, IL, and WA — with new districts joining every quarter. If you're tired of stitching together spreadsheets, waiting weeks for a report, or making decisions on stale data — let's talk. Open Architects helps district leaders move from reactive reporting to proactive, integrated decision-making. Data to lead with clarity.

Who Is the Company Behind Open Architects Analytics Platform?

OpenLab CDS

Who Is the Company Behind OpenLab CDS?

  • Seller: Agilent Technologies
  • Year Founded: 1999
  • HQ Location: Santa Clara, CA
  • LinkedIn® Page: www.linkedin.com
    18,233 employees on LinkedIn®
  • Ownership: NYSE:A
  • Total Revenue (USD mm): $5,339

OpenText Intelligence

OpenText™ Magellan™ BI & Reporting embeds compelling reports and dashboards into enterprise applications to increase their value and improve decision-making. With Magellan BI & Reporting, IT teams can leverage capabilities, such as embeddability, security and scalability to address virtually any reporting and dashboarding requirement.

Who Is the Company Behind OpenText Intelligence?

  • Seller: OpenText
  • Year Founded: 1991
  • HQ Location: Waterloo, ON
  • LinkedIn® Page: www.linkedin.com
    22,835 employees on LinkedIn®
  • Ownership: NASDAQ:OTEX
  • Phone: +1-519-888-7111
Bijou Barry
BB
Researched and written by Bijou Barry
Updated June 24, 2026