Best Data Visualization Tools - Page 39

How Many Data Visualization Tools Products Does G2 Track?

Total Products under this Category: 762

Category Stats (Nov 2026)

  • Average Rating: 4.44/5 The average rating of products in this category, based on all submitted ratings
  • Top Trending Product: Upsolve AI (+1.75%) - Among all products in this category, Upsolve AI recorded the largest rating increase compared to last month

Last updated: November 01, 2026

How Does G2 Rank Data Visualization Tools Products?

Why You Can Trust G2's Software Rankings:

  • 30 Analysts and Data Experts
  • 22,900+ Authentic Reviews
  • 762+ Products
  • Unbiased Rankings

G2's software rankings are built on verified user reviews, rigorous moderation, and a consistent research methodology maintained by a team of analysts and data experts. Each product is measured using the same transparent criteria, with no paid placement or vendor influence. While reviews reflect real user experiences, which can be subjective, they offer valuable insight into how software performs in the hands of professionals. Together, these inputs power the G2 Score, a standardized way to compare tools within every category.

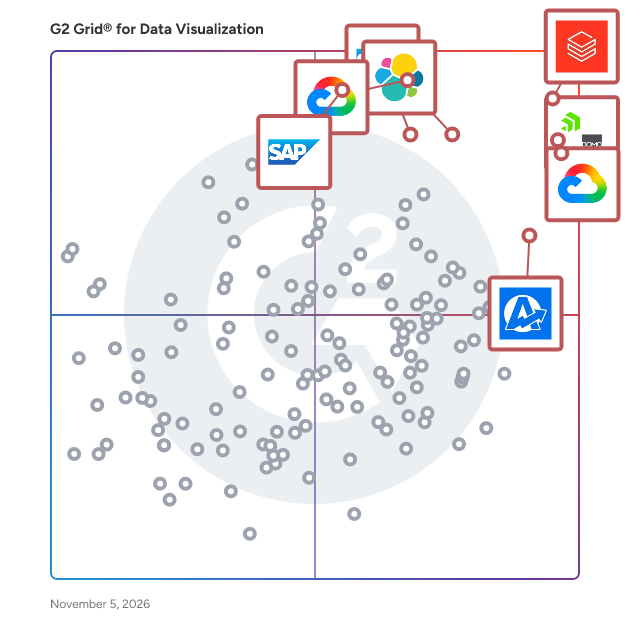
G2 Grid® for Data Visualization Tools

G2 Grid® for Data Visualization Tools plotting products by satisfaction and market presence

Highlighted products: Databricks, Domo, Looker, Data Studio, Elastic Stack, AgencyAnalytics, SAP HANA Cloud, and SAP Analytics Cloud.

Underlying data: [Grid® JSON](https://www.g2.com/categories/data-visualization-tools/grids.json?focus%5B%5D=databricks&focus%5B%5D=domo&focus%5B%5D=looker&focus%5B%5D=data-studio&focus%5B%5D=elastic-stack&focus%5B%5D=agencyanalytics&focus%5B%5D=sap-hana-cloud-2025-10-01&focus%5B%5D=sap-analytics-cloud&segment=all)

MINEO

MINEO is the platform to explore your data, build and deploy Python supercharged notebooks. It also monitors the quality of your data using machine learning A better Python Notebook --------------------------------- Mineo takes Python notebooks to the next level by adding production-grade features such as: * Switchable layout modes: Notebook, Dashboard and Mobile. * No code Widgets (SQL Query, Graphics, Tables, KPIs, Title, Images, and Forms) to explore and interact with your content without programming. * Integrated SQL Data sources to access databases directly. * Compatible with Jupyter notebooks. Import your existing notebooks from .ipynb or export from mineo to other apps. * Built-in version control system * Ability to share and work collaboratively. * Integrated filesystem to store your data up to 10TB. * Ability to export your notebook to PDF * Support for project wide variables * Support for Python blocks, Markdown, LaTeX and Widgets. * Detailed logs and permissions (view, view code, execute) at user/group level. * Automatic code generation powered by OpenAI.

Average Rating: 4.8/5.0

Total Reviews: 11

Who Is the Company Behind MINEO?

Who Uses This Product?

  • Company Size: 73% Small, 27% Medium

What Are Recent G2 Reviews of MINEO?

Mitra

Mitra é uma plataforma unificada de Desenvolvimento Visual que abrange banco de dados, interface e lógica. Com uma interface intuitiva e suporte a SQL, o Mitra integra front-end, back-end e banco de dados, acelerando o desenvolvimento de aplicações em até 10x. A plataforma oferece um construtor de banco de dados completo, permitindo que os usuários criem e gerenciem tabelas, atributos e conexões de forma simplificada. Além disso, o Mitra possibilita a criação de interfaces responsivas para web e dispositivos móveis usando o PageBuilder, que utiliza supercomponentes personalizáveis e otimizados. A camada de lógica é gerenciada por meio de ações visuais e integrações com serviços externos via IPaaS, proporcionando flexibilidade na automação de processos. Por fim, o Mitra simplifica o lançamento de produtos, seja para plataformas B2B, B2C, web ou mobile, com opções white-label e domínios personalizados. Ideal para projetos personalizados, startups ou aplicações corporativas, o Mitra representa uma nova abordagem no desenvolvimento de software baseada em Desenvolvimento Visual.

Who Is the Company Behind Mitra?

  • Seller: Mitra
  • Year Founded: 2018
  • HQ Location: Uberlândia, BR
  • LinkedIn® Page: www.linkedin.com
    269 employees on LinkedIn®

AI can help you find the answers. G2 helps you trust them.

Connect G2 to Claude or ChatGPT for answers grounded in G2's trusted reviews, comparisons, and pricing from real user insights.

How it works

MLC Chart Makers

Free online chart makers for creating editable PowerPoint and Excel Gantt, waterfall, org, funnel, timeline and other charts.

Who Is the Company Behind MLC Chart Makers?

Mojix ytem™

Mojix is a leader in real-time, item-level visibility solutions that provide end-to-end business intelligence for supply chains around the globe. Mojix harmonizes data to provide traceability, product authentication and automated inventory management solutions that are built on a high security, scalable SaaS platform. Mojix captures event-triggered actions and vital characteristics by tracking billions of unique identities, to follow item lifecycles from source to shelf. Companies can leverage the integrated data to increase their sales and operational efficiency, reduce risk, and enhance their customer experience. Learn more at www.mojix.com.

Who Is the Company Behind Mojix ytem™?

  • Seller: Mojix
  • Year Founded: 2004
  • HQ Location: Boca Raton, US
  • LinkedIn® Page: www.linkedin.com
    120 employees on LinkedIn®

MonChart

MonChart is a no-code dashboard builder that connects data sources into live, shareable charts. The platform integrates with over 15 data connectors. The platform combines charts from multiple sources on a single board that updates automatically. A I-generated summaries provide plain-language insights into metrics and trends. Boards can be shared via direct links, embedded with iframe code, or kept private. MonChart uses encrypted storage and read-only access for connected data sources. OAuth authentication is available for supported integrations. Charts refresh on schedules or on demand, depending on the data source. The platform displays metrics in time ranges from seven days to twelve months, depending on the connector.

Who Is the Company Behind MonChart?

  • Seller: MonChart
  • Year Founded: 2025
  • HQ Location: Galway, IE
  • LinkedIn® Page: www.linkedin.com
    2 employees on LinkedIn®

MPP BI

A robust Business Intelligence platform that empowers decision-makers through analytics, visualization, and monitoring of big data. By leveraging massively parallel databases, it enables effective tracking of business processes and key performance indicators (KPIs) for informed decision-making.

Who Is the Company Behind MPP BI?

Who Uses This Product?

  • Company Size: 100% Small

What Are Recent G2 Reviews of MPP BI?

What Are G2 Users Discussing About MPP BI?

MUI X Charts

A fast and extendable library of react chart components for data visualization. MUI X is a collection of advanced React UI components for complex use cases. Use the native integration with Material UI or extend your design system. They feature state-of-the-art functionality and complex UX workflows for data-rich applications and support a wide range of use cases.

Who Is the Company Behind MUI X Charts?

  • Seller: MUI
  • Year Founded: 2019
  • HQ Location: Paris, TF
  • LinkedIn® Page: www.linkedin.com
    92 employees on LinkedIn®

MUI X Data Grid

A fast and extensible React data table and React data grid, with filtering, sorting, aggregation, and more. The MUI X Data Grid is a TypeScript-based React component that presents information in a structured format of rows and columns. It provides developers with an intuitive API for implementing complex use cases; and end users with a smooth experience for manipulating an unlimited set of data.

Average Rating: 4.3/5.0

Total Reviews: 3

Who Is the Company Behind MUI X Data Grid?

  • Seller: MUI
  • Year Founded: 2019
  • HQ Location: Paris, TF
  • LinkedIn® Page: www.linkedin.com
    92 employees on LinkedIn®

Who Uses This Product?

  • Company Size: 100% Medium

What Are Recent G2 Reviews of MUI X Data Grid?

MyLedgnd

Who Is the Company Behind MyLedgnd?

  • Seller: Ledgnd
  • Year Founded: 2019
  • HQ Location: Vlaardingen, NL
  • LinkedIn® Page: www.linkedin.com
    18 employees on LinkedIn®

NaraOps

NaraOps turns operational CSV and Excel data into management intelligence for business owners, managers and teams. It profiles data, supports reviewed field mappings and relationships, and produces interactive evidence of performance, drivers, trends, risks and opportunities across current-state data, dated snapshots, event histories and related tables. Users can create executive, operations, team, one-to-one and client briefs, with PDF and CSV exports. NaraOps is currently in public/review beta. CSV and Excel row analysis runs locally in the browser. Optional document extraction sends only selected files to OpenAI when explicitly requested, and extracted values require human review and approval before analysis. Ask NaraOps uses compact verified analytical context rather than raw workbook rows. Individual pricing is £14.99 per month or £149 per year, with a 14-day trial and no credit card required. Website: https://naraops.com App: https://app.naraops.com Demo and illustrative synthetic examples: https://naraops.com/demo Trust Centre: https://naraops.com/trust Security: https://naraops.com/security Security Pack: https://naraops.com/security-pack Support: support@naraops.com, Monday–Friday, 09:00–17:00 UK time. Founded in 2026, United Kingdom.

Who Is the Company Behind NaraOps?

NationGraph

Public sector sales intelligence that surfaces buying signals before the RFP drops. NationGraph is built for companies selling to state and local government, K–12, and higher education. Most vendors find out about an opportunity once it's already public, when the requirements are set and an incumbent is favored. NationGraph reads millions of board minutes, budgets, grants, and contracts across 110,000 agencies to flag which buyers are moving toward a purchase 6 to 18 months before the RFP drops. Every account comes with the signals behind it and verified decision-maker contacts, giving your whole team walk-the-halls awareness of their territory: expiring contracts, new funding, and pain points raised in council and board meetings. Prioritize the right accounts, reach the right people, and show up as the expert in the room before your competitors know the deal exists.

Who Is the Company Behind NationGraph?

NetMiner

NetMiner 5 is an advanced analytics platform developed by CYRAM Inc. that combines graph theory, machine learning, and AI to analyze, visualize, and interpret network and text data. Designed for researchers, analysts, and decision-makers across academia, government, and industry, NetMiner helps users uncover complex relational and textual patterns without requiring any programming expertise. At its core, NetMiner is built around social network analysis (SNA), enabling the structural exploration of relationships between people, organizations, documents, and concepts. It supports one-mode, two-mode, and multiplex networks, and provides a wide range of SNA metrics from basic to advanced to assess individual centrality, group dynamics, and whole-network structure. NetMiner goes beyond traditional SNA by integrating machine learning (ML) and graph neural networks (GNNs). Users can easily apply supervised and unsupervised learning techniques such as classification, regression, and clustering, as well as GNN models like GCN, GraphSAGE, and GAT, for predictive modeling. In terms of text analysis, NetMiner offers powerful capabilities to extract keywords, build co-occurrence networks, generate word clouds, and perform topic modeling using LDA. This allows users to move beyond frequency-based analysis and explore the latent meaning structure in large text corpora. NetMiner includes a powerful interactive 2D visualization engine that makes network structure exploration intuitive. Nodes and links can be styled by centrality, frequency, or categories, and users can zoom, filter, and drag to explore key actors and patterns. These visualizations are directly linked to the data for accurate interpretation. Even with large datasets, dynamic visual analysis is possible without writing code. The built-in AI Assistant, powered by LLMs like GPT and Gemini, helps interpret results and suggests next steps—making it accessible even to users who are new to network or text analysis. NetMiner is widely used across fields including: - Academic research: sociology, communication, political science, digital humanities, education - Policy analysis and public sector planning: stakeholder mapping, policy network evaluation, community structure detection - Enterprise analysis: internal communication auditing, compliance monitoring, customer segmentation, influencer analysis - Media and social media analysis: opinion leader detection, information diffusion, discourse analysis - Cybersecurity and anomaly detection: email network analysis, abnormal behavior pattern identification NetMiner supports importing and exporting various file formats (CSV, Excel) and integrates with external tools via APIs and scripting. Licenses are available for students, educational institutions (schools), and organizations/corporations. More than just a network visualization tool, NetMiner is a complete analysis environment built on the foundation of network thinking. It helps users move from data to insight to action—faster, smarter, and with greater clarity. To learn more or request a demo, visit www.netminer.com

Average Rating: 4.5/5.0

Total Reviews: 1

Who Is the Company Behind NetMiner?

  • Seller: NetMiner
  • Year Founded: 2000
  • HQ Location: Gyeonggi-do, South Korea
  • LinkedIn® Page: www.linkedin.com
    1 employees on LinkedIn®

Who Uses This Product?

  • Company Size: 100% Small

What Are Recent G2 Reviews of NetMiner?

NetSpot Pro

NetSpot is a wi-fi survey software that run a survey by walking, marking position on the map, collects data samples, watching Wi-Fi networks being detected and visualized. 15+ heatmap coverage graphs are available with customizable reports.

Average Rating: 3.0/5.0

Total Reviews: 3

Who Is the Company Behind NetSpot Pro?

Who Uses This Product?

  • Company Size: 67% Small, 33% Medium

What Do G2 Reviewers Say About NetSpot Pro?

AI-generated summary from verified user reviews

Pros
  • Users find NetSpot Pro's ease of use invaluable for analyzing network metrics and optimizing Wi-Fi coverage effortlessly.
  • Users highlight the easy management of NetSpot Pro, enhancing their ability to optimize and analyze network performance seamlessly.
  • Users find NetSpot Pro easy to use yet powerful, making network metric analysis and troubleshooting straightforward and efficient.
  • Users find NetSpot Pro's versatility invaluable for optimizing network coverage and analyzing interference effortlessly.

What Are Recent G2 Reviews of NetSpot Pro?

What Are G2 Users Discussing About NetSpot Pro?

NetvirE

NetvirE is an advanced, low-code Industrial IoT (IIoT) platform designed to help enterprises monitor, manage, and optimize industrial operations through real-time intelligence and connected asset visibility. Built for Industry 4.0 and Industry 5.0 environments, NetvirE enables organizations to create digital twins of assets, unify distributed operations, and gain actionable insights through AI-driven analytics and predictive maintenance capabilities. With its hardware-agnostic and multi-protocol architecture, NetvirE seamlessly integrates with both legacy and modern industrial systems, enabling faster deployment of customized IIoT solutions without operational complexity. The platform combines edge, cloud, and enterprise intelligence to support remote asset monitoring, operational analytics, sustainability reporting, and centralized decision-making across industrial environments. NetvirE’s configurable low-code framework allows enterprises to tailor dashboards, workflows, and integrations to their unique operational requirements. Unlike rigid off-the-shelf solutions, NetvirE delivers a scalable and adaptable IIoT ecosystem that supports operational efficiency, reduced downtime, sustainability initiatives, and smarter industrial transformation.

Who Is the Company Behind NetvirE?

Bijou Barry
BB
Researched and written by Bijou Barry
Updated June 24, 2026