Best Data Visualization Tools - Page 34

How Many Data Visualization Tools Products Does G2 Track?

Total Products under this Category: 762

Category Stats (Nov 2026)

  • Average Rating: 4.44/5 The average rating of products in this category, based on all submitted ratings
  • Top Trending Product: Upsolve AI (+1.75%) - Among all products in this category, Upsolve AI recorded the largest rating increase compared to last month

Last updated: November 01, 2026

How Does G2 Rank Data Visualization Tools Products?

Why You Can Trust G2's Software Rankings:

  • 30 Analysts and Data Experts
  • 22,900+ Authentic Reviews
  • 762+ Products
  • Unbiased Rankings

G2's software rankings are built on verified user reviews, rigorous moderation, and a consistent research methodology maintained by a team of analysts and data experts. Each product is measured using the same transparent criteria, with no paid placement or vendor influence. While reviews reflect real user experiences, which can be subjective, they offer valuable insight into how software performs in the hands of professionals. Together, these inputs power the G2 Score, a standardized way to compare tools within every category.

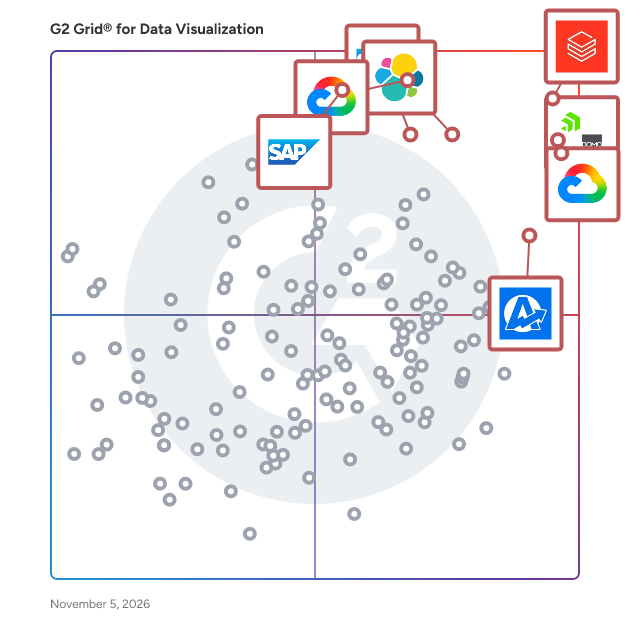
G2 Grid® for Data Visualization Tools

G2 Grid® for Data Visualization Tools plotting products by satisfaction and market presence

Highlighted products: Databricks, Domo, Looker, Data Studio, Elastic Stack, AgencyAnalytics, SAP HANA Cloud, and SAP Analytics Cloud.

Underlying data: [Grid® JSON](https://www.g2.com/categories/data-visualization-tools/grids.json?focus%5B%5D=databricks&focus%5B%5D=domo&focus%5B%5D=looker&focus%5B%5D=data-studio&focus%5B%5D=elastic-stack&focus%5B%5D=agencyanalytics&focus%5B%5D=sap-hana-cloud-2025-10-01&focus%5B%5D=sap-analytics-cloud)

Flitch

Flitch is a business intelligence platform and app builder, free to start. Connect your data, define your metrics and build dashboards, apps, reports and workflows on your definitions with AI. You define. Your data: databases, warehouses, SaaS tools, files and APIs. Your context: anything the AI should know before it builds. Your calculations: how each metric is calculated and how your data sources connect. Your look: a brand kit with your logo, fonts and colors. Your controls: access, permissions and audit. You build, on request. Dashboards: interactive charts and tables on live data. Apps: interactive web apps that read and save data. Reports: written documents with charts, built from your data. Workflows: triggered steps that read, transform, save or send data. Chat: an AI assistant for your data.

Who Is the Company Behind Flitch?

Foresite

Foresite is an enterprise BI and analytics platform with AI insights, interactive dashboards, KPI monitoring, and governed reporting.

Who Is the Company Behind Foresite?

  • Seller: SDLC corp
  • Year Founded: 2015
  • HQ Location: 44 Montgomery St, US
  • LinkedIn® Page: www.linkedin.com
    514 employees on LinkedIn®
  • Ownership: Privately Held
  • Phone: +14155940097

AI can help you find the answers. G2 helps you trust them.

Connect G2 to Claude or ChatGPT for answers grounded in G2's trusted reviews, comparisons, and pricing from real user insights.

How it works

Foursquare Spatial Studio

Foursquare Spatial Studio is a comprehensive geospatial tool that lets you conduct powerful geospatial data analysis from your browser. With Studio, you can: - Visualize large amounts of location data in your browser. - Perform geospatial analytics by grouping and joining your data. - Gain insights by filtering and correlating your location data. - Quickly publish and share your results.

Average Rating: 4.9/5.0

Total Reviews: 4

How Do G2 Users Rate Foursquare Spatial Studio?

  • Has the product been a good partner in doing business?: 10.0/10 (Category avg: 9.0/10)

Who Is the Company Behind Foursquare Spatial Studio?

Who Uses This Product?

  • Company Size: 75% Small, 25% Large

What Are Recent G2 Reviews of Foursquare Spatial Studio?

Foxglove

Foxglove is the leading observability platform to accelerate development and operations for robotics developers. Experience the world as your robot does with instant insights into your robots' behavior. Stream and visualize data with a single click, upload recordings to your private data lake for easy storage, searching, and analysis, visualize images and point clouds, overlay bounding boxes, add classification labels and planned movements, and drill down into your data with plots or raw message views. - Visualize, annotate, and collaborate on robotics data - Use rich interactive visualizations to analyze live or pre-recorded data - Organize and annotate data for efficient search and richer analysis

Average Rating: 4.5/5.0

Total Reviews: 2

How Do G2 Users Rate Foxglove?

  • Has the product been a good partner in doing business?: 8.3/10 (Category avg: 9.0/10)

Who Is the Company Behind Foxglove?

  • Seller: Foxglove
  • Year Founded: 2021
  • HQ Location: San Francisco, US
  • LinkedIn® Page: www.linkedin.com
    94 employees on LinkedIn®

Who Uses This Product?

  • Company Size: 50% Large, 50% Medium

What Do G2 Reviewers Say About Foxglove?

AI-generated summary from verified user reviews

Pros
  • Users value the multiple dashboards of Foxglove for effectively visualizing data from sensors and actuators.
  • Users value the multiple dashboards of Foxglove, enabling seamless data visualization from sensors and actuators.
  • Users value the multiple dashboards of Foxglove, enabling effective visualization of data from various sensors and actuators.
  • Users love the multiple dashboards of Foxglove that effectively visualize data from sensors and actuators.
Cons
  • Users find the complexity of the ROS tree in Foxglove to be confusing and challenging to navigate.

What Are Recent G2 Reviews of Foxglove?

FS.Net

A robust reporting and analytics software suite that displays custom reports of your factory’s SPC quality and OEE/production data to get “the big picture” of your enterprise at any time, from anywhere. FS.Net can consume data from many different sources across a plant or plants to create portal for quality and production data across an entire organization.

Average Rating: 2.5/5.0

Total Reviews: 1

Who Is the Company Behind FS.Net?

Who Uses This Product?

  • Company Size: 100% Large

What Do G2 Reviewers Say About FS.Net?

AI-generated summary from verified user reviews

Pros
  • Users appreciate the centralized data accessibility of FS.Net, enabling efficient tracking of OEE and quality metrics.
  • Users value the process improvement capabilities of FS.Net, enabling efficient real-time tracking of production data and metrics.
  • Users value the real-time monitoring of FS.Net, enabling centralized access to critical production data and metrics.
Cons
  • Users find the complex usability of FS.Net's reporting options to be a significant hindrance in their experience.
  • Users find the difficult learning curve for reporting options cumbersome, hindering their ability to create ad hoc reports effectively.

Fusedash - AI Data Visualization Platform for Dashboards

Fusedash is an AI data visualization platform for building interactive dashboards, charts, maps, and storytelling reports in one workspace. Connect CSVs and APIs, monitor real-time KPIs, and share consistent views with your team or stakeholders. Use AI Chat to ask questions in plain language and get answers backed by your data, including charts, tables, breakdowns, and summaries.

Who Is the Company Behind Fusedash - AI Data Visualization Platform for Dashboards?

FutureAnalytica

FutureAnalytica offers a no-code AI platform for managing end-to-end data science for businesses. Data administration, processing, ETL, visualization, constructing AI models, deployment, designing end-user apps, and monitoring are all supported by the FutureAnalytica AI platform. Organizations may now integrate advanced analytics and AI solutions into their operations in a matter of weeks. The aggregated platform has numerous modules or small platforms, each of which can be hosted on-premises or in the cloud.

Average Rating: 4.5/5.0

Total Reviews: 4

How Do G2 Users Rate FutureAnalytica?

  • Has the product been a good partner in doing business?: 6.7/10 (Category avg: 9.0/10)

Who Is the Company Behind FutureAnalytica?

Who Uses This Product?

  • Company Size: 75% Small, 25% Large

What Are Recent G2 Reviews of FutureAnalytica?

Gitential

Gitential provides proprietary software development analytics through git repository evolution analysis in order to maximize development efficiency. It helps CTOs and engineering managers work by providing objective metrics about contributions of teams and individual developers.

Average Rating: 4.5/5.0

Total Reviews: 1

How Do G2 Users Rate Gitential?

  • Has the product been a good partner in doing business?: 10.0/10 (Category avg: 9.0/10)

Who Is the Company Behind Gitential?

Who Uses This Product?

  • Company Size: 100% Medium

What Are Recent G2 Reviews of Gitential?

What Are G2 Users Discussing About Gitential?

Go Fig

Who Is the Company Behind Go Fig?

  • Seller: Go Fig
  • Year Founded: 2023
  • HQ Location: Greenville, US
  • LinkedIn® Page: www.linkedin.com
    3 employees on LinkedIn®

Google Data Studio

Who Is the Company Behind Google Data Studio?

  • Seller: Google
  • Year Founded: 1998
  • HQ Location: Mountain View, CA
  • LinkedIn® Page: www.linkedin.com
    301,144 employees on LinkedIn®
  • Ownership: NASDAQ:GOOG
  • Phone: +1 (650) 253-0000

GraphAsk - Chat with your Data using AI

GraphAsk is an AI-powered tool that transforms your data into interactive dashboards and visual insights with just a few simple queries. Whether your data comes from Excel, CSV, or databases, GraphAsk makes it easy to understand and visualize complex information without needing technical skills. Just upload your data or connect to your database, ask your questions in plain language, and receive instant, actionable results. GraphAsk suggests the best charts and graphs based on your data — whether it's trends over time, comparisons across regions, or other patterns — and helps you make smarter, data-driven decisions faster.

Who Is the Company Behind GraphAsk - Chat with your Data using AI?

Graph Commons

Graph Commons AI turns a prompt, pasted notes, a list, or a spreadsheet into a live network map — of an ecosystem, the stakeholders around a project, a market — and reads the structure back as insights. Every node and edge stays yours to inspect, correct, expand, and share.

Who Is the Company Behind Graph Commons?

Bijou Barry
BB
Researched and written by Bijou Barry
Updated June 24, 2026