Best Data Visualization Tools - Page 25

How Many Data Visualization Tools Products Does G2 Track?

Total Products under this Category: 478

Category Stats (Aug 2026)

  • Average Rating: 4.43/5 The average rating of products in this category, based on all submitted ratings
  • Top Trending Product: Supersimple (+0.89%) - Among all products in this category, Supersimple recorded the largest rating increase compared to last month

Last updated: August 04, 2026

How Does G2 Rank Data Visualization Tools Products?

Why You Can Trust G2's Software Rankings:

  • 30 Analysts and Data Experts
  • 26,100+ Authentic Reviews
  • 478+ Products
  • Unbiased Rankings

G2's software rankings are built on verified user reviews, rigorous moderation, and a consistent research methodology maintained by a team of analysts and data experts. Each product is measured using the same transparent criteria, with no paid placement or vendor influence. While reviews reflect real user experiences, which can be subjective, they offer valuable insight into how software performs in the hands of professionals. Together, these inputs power the G2 Score, a standardized way to compare tools within every category.

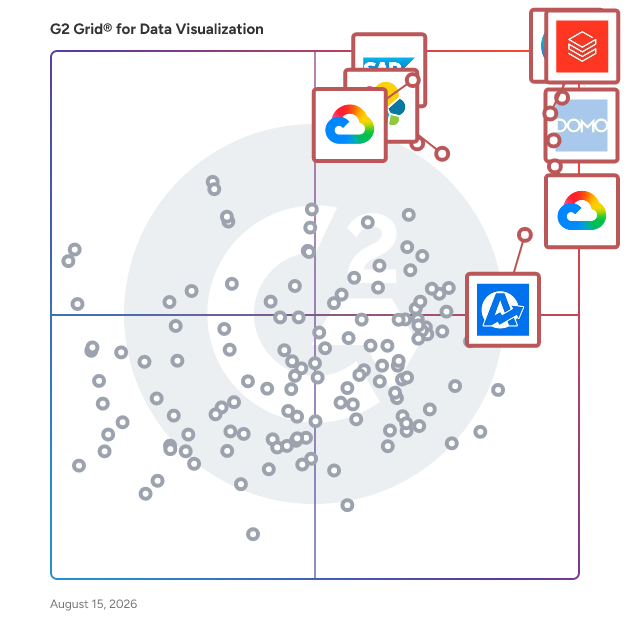
G2 Grid® for Data Visualization Tools

G2 Grid® for Data Visualization Tools plotting products by satisfaction and market presence

Highlighted products: Canva, Databricks, Domo, Looker, Data Studio, Elastic Stack, SAP HANA Cloud, and AgencyAnalytics.

Underlying data: [Grid® JSON](https://www.g2.com/categories/data-visualization-tools/grids.json?focus%5B%5D=canva&focus%5B%5D=databricks&focus%5B%5D=domo&focus%5B%5D=looker&focus%5B%5D=data-studio&focus%5B%5D=elastic-stack&focus%5B%5D=sap-hana-cloud-2025-10-01&focus%5B%5D=agencyanalytics)

Sponsored

ZapDigits

ZapDigits is a modern marketing dashboard and client reporting platform built for agencies, freelancers, and marketing teams that want clear insights without complexity. As a powerful alternative to AgencyAnalytics, ZapDigits helps you centralize your marketing data and streamline reporting across all your campaigns. With ZapDigits, you can connect multiple data sources, track key performance metrics, and create clean, professional client reports in minutes. Instead of switching between tools or managing spreadsheets, everything lives in one intuitive dashboard designed for speed and simplicity. ZapDigits is built to make marketing reporting easier, faster, and more actionable. Whether you’re managing multiple clients, running campaigns, or delivering performance reports, it gives you real-time visibility into what’s working and where to optimize. If you're looking for an AgencyAnalytics alternative that is lightweight, flexible, and easy to use, ZapDigits is designed to help you save time and deliver better results for your clients.

Visit website

2dview

2dview is a cloud-based productivity tool that helps creative studios customize workflows, manage resources, track progress, and more. It provides tools to track and manage production across teams via show management, Gantt chart, pipeline tracking, and timesheets. The software aims to increase productivity by facilitating centralized communication, enabling data-driven decisions, ensuring security, and providing customization. Key features include task tracking, automated reporting, notifications, attendance tracking, and leave approvals.

Who Is the Company Behind 2dview?

  • Seller: 2dview
  • Year Founded: 2020
  • HQ Location: Chennai, IN
  • LinkedIn® Page: www.linkedin.com
    2 employees on LinkedIn®

4Front

Drowning in data, but don't see the true story? A dashboard with a difference: our scientists give you an accurate view of your data and the real story behind the numbers. 4Front is a subscription service that provides an independent view of your performance.

Who Is the Company Behind 4Front?

Accely Insights AI

Transform Data into Strategy with Eerly Insights AI from Accely. Leverage your data’s potential and power by utilizing scalable solutions, repeatable processes, and years of expertise. Insights AI converts your data into valuable insights by integrating effortlessly with your current databases delivering unparalleled insights.

Who Is the Company Behind Accely Insights AI?

  • Seller: Accely Group
  • Year Founded: 2001
  • HQ Location: Plano, Texas, United States
  • LinkedIn® Page: www.linkedin.com
    186 employees on LinkedIn®

AECharts

AECharts is a business charting platform that helps professionals create consulting-quality charts and diagrams for presentations, reports, and executive communication. Whether you're building a board deck, preparing an investor presentation, analyzing business performance, or delivering a client presentation, AECharts makes it easy to turn data into polished visuals without spending hours formatting them manually. Designed for consultants, analysts, finance teams, product managers, marketers, researchers, and business leaders, AECharts goes beyond the standard charts found in spreadsheet and presentation software. Choose from a growing library of advanced business visualizations—including waterfall charts, Marimekko charts, Sankey diagrams, Pareto charts, funnel charts, treemaps, radar charts, dumbbell charts, timelines, process diagrams, and more—all optimized for professional presentations. Simply paste data from Excel, Google Sheets, or CSV files, customize the styling to match your brand, and export presentation-ready visuals. Every chart is fully customizable, giving you control over colors, typography, labels, axes, spacing, annotations, and layouts so your work looks consistent across every report and presentation. Need to maintain a consistent visual identity across your organization? Shared Brand Kits ensure charts follow your company's colors, fonts, and design guidelines, making it easy for teams to produce polished, on-brand presentations without repetitive formatting. Whether you're replacing hours of manual PowerPoint editing or looking for a modern alternative to traditional business charting tools, AECharts helps you create executive-ready visuals faster, so you can spend less time formatting and more time communicating insights.

Who Is the Company Behind AECharts?

Agile Velocity Chart Gadget

Agile Velocity Chart by Broken Build allows you to: ✅ Closely monitor the progress of individuals, teams, and cross-teams ✅ Compare performance of multiple teams using benchmarking tools ✅ Analyze enriched velocity data with 10+ advanced sprint metrics ✅ Break down velocity charts into the necessary level of detail ✅ Add more clarity with target lines and moving average ✅ Analyze the entire sprint history through detailed, one-click sprint reports 30-day free trial Free forever for teams with <10 ppl Check out our Atlassian Marketplace page: https://marketplace.atlassian.com/apps/1215768

Who Is the Company Behind Agile Velocity Chart Gadget?

  • Seller: Broken Build
  • Year Founded: 2021
  • HQ Location: Kyiv, UA
  • Twitter: @brokenbuildapps
    6 Twitter followers
  • LinkedIn® Page: www.linkedin.com
    10 employees on LinkedIn®

Aiven for Grafana

Get Grafana as a fully managed service to observe your metrics data and alert on events. Snap ready-made dashboards into your monitoring workflows and get the big picture on your systems.

Who Is the Company Behind Aiven for Grafana?

  • Seller: Aiven
  • Year Founded: 2016
  • HQ Location: Helsinki, Southern Finland
  • Twitter: @aiven_io
    4,104 Twitter followers
  • LinkedIn® Page: www.linkedin.com
    464 employees on LinkedIn®

AnytimeBI

At e2b teknologies, we provide a powerful cloud-based business intelligence platform designed to simplify data integration, reporting, and analysis for businesses of all sizes. Built on Microsoft Power BI technology, our solution requires no additional Power BI licenses, making it accessible and cost-effective for organizations seeking real-time insights and enhanced decision-making capabilities.

Who Is the Company Behind AnytimeBI?

  • Seller: e2b teknologies
  • Year Founded: 2001
  • HQ Location: Mentor, US
  • Twitter: @e2bteknologies
    954 Twitter followers
  • LinkedIn® Page: www.linkedin.com
    21 employees on LinkedIn®

Athena

At Athena, we put data to work for everyone, empowering businesses to unlock their full potential. Our AI-powered business intelligence platform integrates data, people, and systems into a unified environment. With the advanced use of AI, Athena is designed to help organizations understand and visualize their data like never before. We bring real-time analytics and interactive dashboards to the forefront, making data visible and actionable. Athena's advanced analytics capabilities enable companies to anticipate future trends and challenges, while automation tools generate actionable intelligence without manual intervention. By providing a comprehensive view of your business data, we help you optimize critical business processes at scale and in record time. Discover how AI-driven business intelligence platform transforms data into actionable insights, driving exponential business results by revolutionizing how you interact with data.

Who Is the Company Behind Athena?

AVA Data Visualization

AVA makes it fast and easy for anyone to create impactful data visualizations using dynamic charts templates, and graphs. In just three simple steps, AVA's all-in-one platform can transform static data into fully customizable data visualizations. All in a fraction of the time it would have taken a videographer to do previously. AVA's growing selection of fully customizable templates allows users the ability to tell meaningful stories with their data while maintaining consistency with existing brand guidelines. Work individually, or collaborate as part of a team to craft stunning one of a kind data visualizations to improve presentations or share with audiences on social media.

Who Is the Company Behind AVA Data Visualization?

  • Seller: HomeTree Digital
  • Year Founded: 2018
  • HQ Location: New York, US
  • Twitter: @hometreedigital
    60 Twitter followers
  • LinkedIn® Page: www.linkedin.com
    11 employees on LinkedIn®

B3

B3 Systems is an AI-native industrial intelligence platform that helps manufacturers reduce downtime, improve asset performance, and make faster, data-driven decisions. The B3 platform connects machines, systems, and operational data to deliver real-time visibility, predictive insights, and AI-driven recommendations. By combining advanced analytics with agentic AI, B3 enables teams to move from reactive operations to proactive and increasingly autonomous workflows. Designed for complex, asset-intensive environments, the platform integrates seamlessly with existing OT and IT systems and scales across multi-site operations, eliminating data silos and creating a unified source of truth. B3’s AI agents continuously monitor performance, detect anomalies, and surface actionable insights, helping teams act faster, prevent issues, and optimize operations around the clock. Trusted by manufacturers across industries including forestry, mining, steel, automotive, and pulp & paper, B3 helps organizations unlock the full value of their data and drive measurable operational improvements.

Who Is the Company Behind B3?

BAPLIE Viewer Online

BAPLIE Viewer Online is a cloud-based visualization and analytics tool which makes viewing and editing EDI files easy. BAPLIE Viewer Online operates on any web-enabled device, making it the most compatible BAPLIE software on the market, and removes the need for Java, Flash, or installs of any kind. With BAPLIE Viewer Online, there is no limit to the number of EDI files you can upload and view. When you upload a BAPLIE, our tool validates the file and lets you know if there are any incorrect or missing segments that prevent the file from being read. Additional Features: • Team Collaboration: manage multiple users for your facility with individual accounts with permissions to functions. Invite guest accounts to view and download BAPLIE data in real time as updates take place. • View BAPLIE file contents: filter views, build advanced queries, find specific containers • Anomalies: identify possible floating containers, multiple containers in a slot, and missing or invalid data • 2D bay view & 3D vessel view • Merging BAPLIE files • Conversion for different versions of BAPLIE files • Downloadable PDFs of full bay plan • Header detail viewer & editor: identify and explain any errors • Summaries for bays, entire cargo, port, or route • Download edited BAPLIE data • Pivot summaries: create tailored pivot table reports and save for future use • Create BAPLIE files from an Excel spreadsheet • Convert BAPLIE files to Movins files • Merge or Compare two BAPLIE files • Upload Movins files • Create custom TEU calculations • Create custom ISO/UNLOC code conversions

Who Is the Company Behind BAPLIE Viewer Online?

  • Seller: Tedivo
  • Year Founded: 2014
  • HQ Location: Long Beach, US
  • LinkedIn® Page: www.linkedin.com
    2 employees on LinkedIn®

Baselight

Baselight is the antidote to AI hallucinations: a unified data layer that serves as the structured backbone for intelligent systems, connecting both humans and LLMs to verifiable, auditable facts. It provides a suite of tools—including an AI for explainable intelligence, an extensive catalog of dependable structured data, and a studio for transparent analysis—to ensure that every query is answered with truth, not guesswork, powering smarter, more reliable insights for everyone.

Who Is the Company Behind Baselight?

  • Seller: Finisterra Labs
  • Year Founded: 2024
  • HQ Location: Decentralised, US
  • Twitter: @FinisterraLabs
    386 Twitter followers
  • LinkedIn® Page: www.linkedin.com
    7 employees on LinkedIn®

BI4Dynamics

BI4Dynamics is an enterprise-grade data warehouse automation solution designed specifically for Microsoft Dynamics. Our robust and comprehensive business intelligence tool offers no-code customizations, making modelling faster than any other tool in the market. It can scale to cover a wide spectrum of customers in any industry, regardless of size or complexity. BI4Dynamics delivers 150+ out-of-the-box Power BI reports, enabling businesses to easily gain valuable insights and make data-driven decisions. Whether you're using Dynamics D365 FO (AX) or D365 Business Central (NAV), BI4Dynamics can deliver a complete BI solution in a matter of days. It allows for seamless integration with any Microsoft Dynamics data sources: D365, On-premise, or any additional external sources (Power BI Datamart / Power Query). BI4Dynamics uses a metadata-based wizard, making development simple, accurate, and lightning-fast. It automatically generates million+ rows of SQL code, building a corporate data warehouse, cubes, and project documentation with a click of a mouse. It is open for manual customizations, and users do not need technical programming skills or custom code. Experience the power of cutting-edge dashboards, visual analytics, and a corporate single point of truth for your entire organization. It's not just a project, it's a solution that's ready to give you meaningful insights in a matter of days. Live demo: https://www.bi4dynamics.com/live-demo/ Start your 30-day free trial!

Who Is the Company Behind BI4Dynamics?

BI4Web

BI4Web is a business intelligence tool that enables companies to make data-driven decisions. Its main features include the analysis of hierarchical structures, multidimensional analysis, reporting, and the most extensive catalog of native representations. Additionally, BI4Web offers a seamless experience across desktops, mobile devices, and tablets. BI4Web is aimed at companies seeking to extract value from their data. It is the perfect tool to drive digital transformation due to its simple configuration yet powerful results.

Who Is the Company Behind BI4Web?

Bitergia Dashboards

Bitergia is an open source solution offering tools to create and share analytics dashboards.

Who Is the Company Behind Bitergia Dashboards?

  • Seller: Bitergia
  • Year Founded: 2012
  • HQ Location: Leganes, ES
  • Twitter: @Bitergia
    1,726 Twitter followers
  • LinkedIn® Page: www.linkedin.com
    22 employees on LinkedIn®
Bijou Barry
BB
Researched and written by Bijou Barry
Updated June 24, 2026