Best Data Visualization Tools - Page 18

How Many Data Visualization Tools Products Does G2 Track?

Total Products under this Category: 762

Category Stats (Nov 2026)

  • Average Rating: 4.44/5 The average rating of products in this category, based on all submitted ratings
  • Top Trending Product: Upsolve AI (+1.75%) - Among all products in this category, Upsolve AI recorded the largest rating increase compared to last month

Last updated: November 01, 2026

How Does G2 Rank Data Visualization Tools Products?

Why You Can Trust G2's Software Rankings:

  • 30 Analysts and Data Experts
  • 22,900+ Authentic Reviews
  • 762+ Products
  • Unbiased Rankings

G2's software rankings are built on verified user reviews, rigorous moderation, and a consistent research methodology maintained by a team of analysts and data experts. Each product is measured using the same transparent criteria, with no paid placement or vendor influence. While reviews reflect real user experiences, which can be subjective, they offer valuable insight into how software performs in the hands of professionals. Together, these inputs power the G2 Score, a standardized way to compare tools within every category.

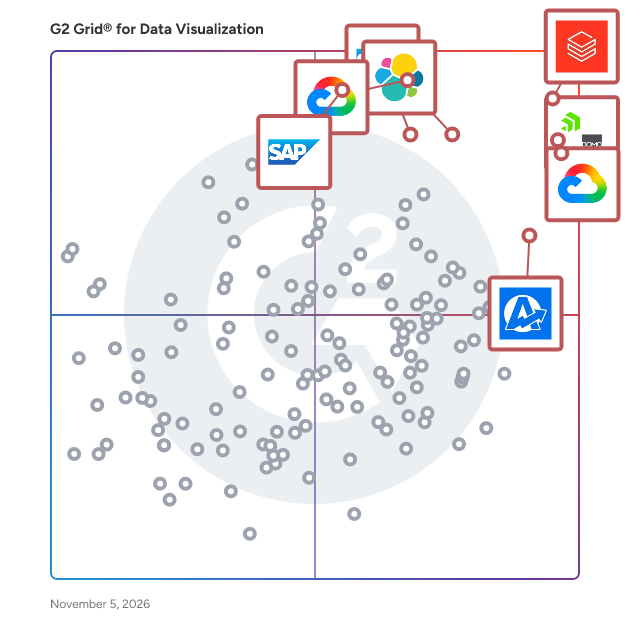
G2 Grid® for Data Visualization Tools

G2 Grid® for Data Visualization Tools plotting products by satisfaction and market presence

Highlighted products: Databricks, Domo, Looker, Data Studio, Elastic Stack, AgencyAnalytics, SAP HANA Cloud, and SAP Analytics Cloud.

Underlying data: [Grid® JSON](https://www.g2.com/categories/data-visualization-tools/grids.json?focus%5B%5D=databricks&focus%5B%5D=domo&focus%5B%5D=looker&focus%5B%5D=data-studio&focus%5B%5D=elastic-stack&focus%5B%5D=agencyanalytics&focus%5B%5D=sap-hana-cloud-2025-10-01&focus%5B%5D=sap-analytics-cloud&segment=all)

Industrytics

Make better business decisions, automate your data process and optimise your business with Decision Intelligence. With industrytics, you can connect, analyse and visualise all the metrics and data about your business and the feedback from your stakeholders in an intelligent 360° business dashboard and get data-driven and AI-powered improvement suggestions for your SME business. Always up to date. Find the right data in one place and unlock unrecognised potential with intelligent analysis.

Average Rating: 5.0/5.0

Total Reviews: 2

How Do G2 Users Rate Industrytics?

  • Dashboards: 10.0/10 (Category avg: 9.0/10)
  • Steps to Answer: 10.0/10 (Category avg: 8.6/10)
  • Formats: 10.0/10 (Category avg: 8.6/10)

Who Is the Company Behind Industrytics?

Who Uses This Product?

  • Company Size: 50% Medium, 50% Small

What Are Recent G2 Reviews of Industrytics?

InetSoft Style Scope

InetSoft Style Scope is a cloudbased server application ideal for production, interactive, and webbased reporting. Quickly generate and deliver reports and even automate your reporting. Included flexible data mashup engine, free evaluation assistance, with options for adding interactive dashboarding and visual analysis. Suitable for 5 and more than 5 no. of users.

Average Rating: 3.3/5.0

Total Reviews: 2

Who Is the Company Behind InetSoft Style Scope?

Who Uses This Product?

  • Company Size: 50% Large, 50% Small

What Are Recent G2 Reviews of InetSoft Style Scope?

What Are G2 Users Discussing About InetSoft Style Scope?

INSIA

Insia.ai is a leading provider of AI-powered procurement solutions, designed to help businesses streamline their procurement processes through data-driven insights, advanced analytics, and automation. Our solutions focus on enhancing efficiency, reducing costs, and driving smarter decision-making across procurement and supply chain management. Insia.ai stands out with its seamless integration capabilities, ensuring compatibility with existing systems for effortless adoption and enhanced operational continuity. By leveraging innovative technologies like machine learning and big data, we empower organizations to optimize their processes and achieve measurable, sustainable results.

Average Rating: 5.0/5.0

Total Reviews: 2

How Do G2 Users Rate INSIA?

  • Has the product been a good partner in doing business?: 10.0/10 (Category avg: 9.0/10)
  • Dashboards: 10.0/10 (Category avg: 9.0/10)
  • Steps to Answer: 10.0/10 (Category avg: 8.6/10)
  • Formats: 10.0/10 (Category avg: 8.6/10)

Who Is the Company Behind INSIA?

  • Seller: INSIA
  • Year Founded: 2019
  • HQ Location: Bengaluru, IN
  • LinkedIn® Page: www.linkedin.com
    20 employees on LinkedIn®

Who Uses This Product?

  • Company Size: 100% Small

What Are Recent G2 Reviews of INSIA?

AI can help you find the answers. G2 helps you trust them.

Connect G2 to Claude or ChatGPT for answers grounded in G2's trusted reviews, comparisons, and pricing from real user insights.

How it works

Insite Analytics

A Key Part of Fortra (the new face of HelpSystems) Insite Analytics is proud to be part of Fortra’s comprehensive cybersecurity portfolio. Fortra simplifies today’s complex cybersecurity landscape by bringing complementary products together to solve problems in innovative ways. These integrated, scalable solutions address the fast-changing challenges you face in safeguarding your organization. With the help of the powerful protection from Insite Analytics and others, Fortra is your relentless ally, here for you every step of the way throughout your cybersecurity journey.

Average Rating: 4.3/5.0

Total Reviews: 2

Who Is the Company Behind Insite Analytics?

  • Seller: Fortra
  • Year Founded: 1982
  • HQ Location: Eden Prairie, Minnesota
  • LinkedIn® Page: www.linkedin.com
    1,784 employees on LinkedIn®

Who Uses This Product?

  • Company Size: 100% Medium

What Are Recent G2 Reviews of Insite Analytics?

IntelliBoard

IntelliBoard is an EdTech company providing K12, HigherEd, Corporate and Government institutions with ability to view learning data coming from different sources with point and click ease. IntelliBoard brings data from Learning Management Systems, Student Information Systems, Collaboration Tools, Assessment Tools, HR and Talent Management Systems. IntelliBoard allows to enter and analyze critical engagement data of each institution using online learning and provides access to student data points and platform to organize communication for everyone involved in student success.

Average Rating: 4.5/5.0

Total Reviews: 2

How Do G2 Users Rate IntelliBoard?

  • Has the product been a good partner in doing business?: 10.0/10 (Category avg: 9.0/10)
  • Dashboards: 10.0/10 (Category avg: 9.0/10)
  • Steps to Answer: 10.0/10 (Category avg: 8.6/10)
  • Formats: 10.0/10 (Category avg: 8.6/10)

Who Is the Company Behind IntelliBoard?

Who Uses This Product?

  • Company Size: 50% Medium, 50% Small

What Are Recent G2 Reviews of IntelliBoard?

What Are G2 Users Discussing About IntelliBoard?

intellsys AdGPT

Intellsys AdGPT is an AI-driven prescriptive advertising intelligence platform that helps businesses optimize their performance marketing decisions. The platform connects with over 200 ad data sources, including Google Ads, Meta, Amazon, Shopify, CRM, and analytics tools, delivering a unified, real-time view of campaign to conversion metrics. Through a conversational AI interface, marketers ask questions and receive precise metrics plus prioritized next moves tied to CAC, ROAS, and LTV. What is the Role of Intellsys AdGPT? Intellsys AdGPT acts as your on-demand strategic advisor, intelligently diagnosing performance issues like budget leaks or creative fatigue and prescribing ranked, actionable steps with clear reasons and projected outcomes. It replaces dashboard drift and guesswork with confident, data-driven decisions and compounding results, accelerating marketing velocity without demanding complex setups or siloed analysis. Why Intellsys AdGPT? Marketing complexity is rising with multi-channel spend, privacy shifts, and fragmented analytics. Intellsys AdGPT solves this by unifying all marketing data into one authoritative source updated hourly, providing clarity and alignment across teams. It empowers marketers to make faster, smarter decisions with transparent, secure AI-driven recommendations, helping teams move beyond traditional reporting and scale growth effectively. Intellsys AdGPT Growth Marketing Tool Key Features: 1. Unified Data Integration Connects 200+ advertising, social media, CRM, and analytics platforms for seamless, consistent real-time reporting. 2. Conversational Ask-and-Act Interface Plain-English questions get you instant metrics plus prioritized next moves—in one conversation, one truth. 3. Prescriptive Playbooks Every insight ends with a step-by-step, outcome-ranked plan showing what to do now and why it matters. 4. Leak Opportunity Radar Automatically surfaces campaign and creative fatigue zones or performance leaks before they impact ROI. 5. Enterprise-Grade Security & Governance Role-based access, audit trails, GDPR-compliance, and certifications ensure secure and trustworthy use. Key Benefits of Using Intellsys AdGPT: 1. Accelerate decision cycles from days to minutes, boosting experiment velocity and agility 2. Gain clear, trusted insights to optimize budget allocation and reduce wasted spend 3. Achieve alignment across marketing, growth, and finance teams with one version of truth 4. Reduce manual data wrangling with automated diagnostics and prescriptive next steps 5. Drive measurable growth with projected impact tied to all recommendations

Average Rating: 4.5/5.0

Total Reviews: 2

Who Is the Company Behind intellsys AdGPT?

Who Uses This Product?

  • Company Size: 100% Medium

What Do G2 Reviewers Say About intellsys AdGPT?

AI-generated summary from verified user reviews

Pros
  • Users find the dashboard efficiency of intellsys AdGPT invaluable for effective data analysis.
  • Users find the useful dashboards created by intellsys invaluable for efficient data analysis and assessment.
  • Users find the analytics dashboard by intellsys AdGPT incredibly useful for comprehensive data analysis.
  • Users find that intellsys AdGPT significantly improves data assessment efficiency, enhancing their overall evaluation processes.
  • Users value the time-saving efficiency of intellsys AdGPT, streamlining their data assessment process significantly.
Cons
  • Users feel that slow loading times hinder the dashboard experience and suggest improvements for better responsiveness.
  • Users feel that slow performance during dashboard creation hinders their productivity and overall experience with AdGPT.
  • Users find the slow update process frustrating, suggesting that real-time updates would greatly enhance usability.

What Are Recent G2 Reviews of intellsys AdGPT?

List & Label

List & Label is a reporting tool for software developers to integrate reporting functions in their web, cloud and desktop applications. Made for development environments such as .NET, C#, Delphi, C++, ASP.NET, ASP.NET MVC, .NET Core etc. And of course, the component supports a variety of data sources. The List & Label report generator extends applications with extensive and convenient print, export and preview functions. Developers retain control over data transfer and create the interface. With the WYSIWYG Report Designer, developers or end users create or edit different print templates for printing information that originates either from a database or another data source. In the Designer, you then have all the data at your disposal and can prepare it for printing in different ways. The additionally included and entirely browser-based Web Report Designer for ASP.NET MVC offers more flexibility in development and is independent from printer drivers. Reports for web applications can be designed anywhere at any time in the browser of your choice. Compared to other reporting and data visualization tools, List & Label is not a suite of different development products. It’s standalone and you don’t have to invest in other components you might not need for your project.

Average Rating: 4.8/5.0

Total Reviews: 2

How Do G2 Users Rate List & Label?

  • Has the product been a good partner in doing business?: 10.0/10 (Category avg: 9.0/10)
  • Dashboards: 10.0/10 (Category avg: 9.0/10)
  • Steps to Answer: 10.0/10 (Category avg: 8.6/10)
  • Formats: 10.0/10 (Category avg: 8.6/10)

Who Is the Company Behind List & Label?

  • Seller: Combit
  • Year Founded: 1989
  • HQ Location: Konstanz, DE
  • LinkedIn® Page: www.linkedin.com
    60 employees on LinkedIn®

Who Uses This Product?

  • Company Size: 50% Medium

What Are Recent G2 Reviews of List & Label?

What Are G2 Users Discussing About List & Label?

Lumalytics

Lumalytics is a SAAS tool that create dashboards with charts, data tables and filters that display real-time data from various data sources.

Average Rating: 4.5/5.0

Total Reviews: 2

How Do G2 Users Rate Lumalytics?

  • Dashboards: 8.3/10 (Category avg: 9.0/10)
  • Steps to Answer: 8.3/10 (Category avg: 8.6/10)
  • Formats: 8.3/10 (Category avg: 8.6/10)

Who Is the Company Behind Lumalytics?

Who Uses This Product?

  • Company Size: 50% Medium, 50% Small

What Are Recent G2 Reviews of Lumalytics?

What Are G2 Users Discussing About Lumalytics?

Megaladata

The low code Megaladata platform empowers business users by making advanced analytics accessible. - Visual design of complex data analysis models with no involvement of the IT department and no need for programming. - Over 60 ready-to-use processing components. - Easy integration with various sources. - Fast processing of large datasets achieved through in-memory computing and parallelism. - Reusable components that facilitate accumulation of business expertise. - Advanced visualization — OLAP cubes, tables, charts, and other specialized tools. Megaladata minimizes the time between hypothesis testing and a fully functional business process.

Average Rating: 4.9/5.0

Total Reviews: 9

How Do G2 Users Rate Megaladata?

  • Has the product been a good partner in doing business?: 10.0/10 (Category avg: 9.0/10)

Who Is the Company Behind Megaladata?

Who Uses This Product?

  • Company Size: 89% Small, 11% Medium

What Are Recent G2 Reviews of Megaladata?

Mimer Metrics

Easy reporting for busy marketers. AdWords, Facebook & Analytics dashboards and reporting.

Average Rating: 4.5/5.0

Total Reviews: 2

How Do G2 Users Rate Mimer Metrics?

  • Dashboards: 8.3/10 (Category avg: 9.0/10)
  • Steps to Answer: 9.2/10 (Category avg: 8.6/10)
  • Formats: 8.3/10 (Category avg: 8.6/10)

Who Is the Company Behind Mimer Metrics?

Who Uses This Product?

  • Company Size: 50% Medium, 50% Small

What Do G2 Reviewers Say About Mimer Metrics?

AI-generated summary from verified user reviews

Pros
  • Users value the customizability of Mimer Metrics, empowering them to create tailored dashboards and insightful reports.
  • Users value the data visualization capabilities of Mimer Metrics, enabling custom dashboards and insightful trend analysis.
  • Users find that Mimer Metrics offers powerful visualization tools for creating custom dashboards and analyzing data trends.
Cons
  • Users find the learning curve steep, necessitating proper training for efficient use of Mimer Metrics.
  • Users find learning difficulty with Mimer Metrics, emphasizing the need for proper training to use it effectively.

What Are Recent G2 Reviews of Mimer Metrics?

Nevron Vision for SharePoint

Nevron Vision for SharePoint delivers the web parts needed to author advanced reports and dashboards inside any SharePoint page – and what is best – you do not need to be a developer to do that. Leveraging years of experience, Nevron Vision for SharePoint delivers leading data visualization and unique know-how, which is simultaneously entirely visually configured through an exhaustive web-based interface. This makes it possible for developers and non-developers alike to take advantage of the flexibility and feature richness these web parts offer – directly inside the browser. The web parts included in this suite can extract data from a diverse range of data sources, including various databases, SP Lists, SP Site Queries, Excel Services, and BDC. They are also equipped with a fast, reliable, and flexible data aggregation engine, which allows the authoring of complex dashboards and reports that perform sophisticated data analysis. Nevron Vision for SharePoint is unique in the breadth of its offering – from simple charts and KPIs to sophisticated drill-down reports and dashboards – this suite of web parts delivers it all to you – the regular SharePoint user.

Average Rating: 4.8/5.0

Total Reviews: 2

How Do G2 Users Rate Nevron Vision for SharePoint?

  • Has the product been a good partner in doing business?: 6.7/10 (Category avg: 9.0/10)
  • Dashboards: 10.0/10 (Category avg: 9.0/10)
  • Steps to Answer: 8.3/10 (Category avg: 8.6/10)
  • Formats: 10.0/10 (Category avg: 8.6/10)

Who Is the Company Behind Nevron Vision for SharePoint?

Who Uses This Product?

  • Company Size: 50% Small, 50% Medium

What Are Recent G2 Reviews of Nevron Vision for SharePoint?

Octoboard for Business

Focus teams, monitor trends, and make smart decisions.

Average Rating: 3.0/5.0

Total Reviews: 2

How Do G2 Users Rate Octoboard for Business?

  • Has the product been a good partner in doing business?: 10.0/10 (Category avg: 9.0/10)

Who Is the Company Behind Octoboard for Business?

Who Uses This Product?

  • Company Size: 100% Small

What Are Recent G2 Reviews of Octoboard for Business?

What Are G2 Users Discussing About Octoboard for Business?

PowerMetrics

PowerMetrics is a self-serve metrics platform designed to help businesses centralize and manage their key metrics in one place. By providing a catalog of curated, trusted metrics, it ensures consistency, accuracy, and alignment for reporting and analytics. PowerMetrics simplifies the process of delivering reliable, metric-centric insights to business users without heavy reliance on data teams. Product Category: PowerMetrics sits at the intersection of metrics management and self-serve analytics. It is built for businesses that operate with a modern data stack and need a streamlined way to make metrics accessible, consistent, and actionable across the organization. PowerMetrics is ideal for: - Data Teams who want to build a reliable source of truth for business metrics while minimizing ad-hoc requests for reporting. - Business Users who need clear, consistent metrics and straightforward analytics to make decisions without technical barriers. - Organizations with Modern Data Stacks that rely on data warehouses, semantic layers, and multiple service APIs for data integration. Key Features: PowerMetrics helps teams align their metrics and analytics with the following capabilities: - Centralized Metric Catalog: Build a unified library of business metrics that are trusted, version-controlled, and reusable across dashboards and reports. - Modern Integrations: Seamlessly connect to data warehouses, semantic layers, and hundreds of APIs, ensuring your metrics pull from accurate and up-to-date sources. - Metric-Centric Analytics: Explore, visualize, and analyze metrics with straightforward tools that don’t require deep technical expertise. - Consistency Across Reports: Ensure every dashboard and report aligns to the same definitions and calculations for metrics, reducing confusion and discrepancies. - Self-Serve Access: Empower business users to view and explore metrics independently without overwhelming data teams. How PowerMetrics Helps: PowerMetrics creates a single source of truth for business metrics, ensuring teams across the organization work with the same defined metrics. Whether you’re analyzing performance in dashboards, running reports, or sharing insights, PowerMetrics guarantees alignment and accuracy wherever metrics are used.

Average Rating: 4.0/5.0

Total Reviews: 2

How Do G2 Users Rate PowerMetrics?

  • Has the product been a good partner in doing business?: 8.3/10 (Category avg: 9.0/10)

Who Is the Company Behind PowerMetrics?

Who Uses This Product?

  • Company Size: 50% Medium, 50% Small

What Are Recent G2 Reviews of PowerMetrics?

What Are G2 Users Discussing About PowerMetrics?

PureInsights Configurable Real Time Dashboard for Genesys Cloud

The PureInsights Configurable Dashboard and Call Detail Extractor for Genesys Cloud Features are bundled together in a single subscription. The Configurable Dashboard features continuous updates in REAL TIME, alerts are color coded to quickly assess. The Dashboard is browser-based so it's accessible from anywhere, including moble. The Call Detail Extractor features a view of results in the web browser and also a clean CSV format for download to load into Excel easily or another BI tool. Data includes ANI and DNIS columns and Grand Total across all selected Queues. Both are cloud-based offerings so there's no software to install!

Average Rating: 4.3/5.0

Total Reviews: 2

How Do G2 Users Rate PureInsights Configurable Real Time Dashboard for Genesys Cloud?

  • Dashboards: 9.2/10 (Category avg: 9.0/10)
  • Steps to Answer: 7.5/10 (Category avg: 8.6/10)
  • Formats: 10.0/10 (Category avg: 8.6/10)

Who Is the Company Behind PureInsights Configurable Real Time Dashboard for Genesys Cloud?

Who Uses This Product?

  • Company Size: 100% Medium

What Are Recent G2 Reviews of PureInsights Configurable Real Time Dashboard for Genesys Cloud?

Queryinside

Queryinside is a modern, user-friendly platform designed for log monitoring, log analysis, and real-time alerting. Built for developers, product teams, and growing startups, queryinside helps you quickly detect issues, understand system behavior, and take action—all without drowning in noisy dashboards or scattered log files. In simple terms: Queryinside is like your observability teammate. It centralizes your logs, gives you meaningful alerts, and shows you what’s really happening in your system—so you can fix problems faster and stay focused on building. Core benefits: Centralized Log Management – Stop chasing logs across multiple tools and servers. Smart Alerts – Get notified only when it really matters. Real-Time Monitoring – See live traffic, user actions, and system events. Easy Setup – Designed to get you running in minutes, not hours. Cloud Integrations – Works with your existing infrastructure.

Average Rating: 5.0/5.0

Total Reviews: 2

How Do G2 Users Rate Queryinside?

  • Dashboards: 10.0/10 (Category avg: 9.0/10)
  • Steps to Answer: 9.2/10 (Category avg: 8.6/10)
  • Formats: 9.2/10 (Category avg: 8.6/10)

Who Is the Company Behind Queryinside?

Who Uses This Product?

  • Company Size: 50% Small, 50% Medium

What Do G2 Reviewers Say About Queryinside?

AI-generated summary from verified user reviews

Pros
  • Users appreciate the smart, AI-powered search of Queryinside, making data discovery quick and easy.
  • Users praise the smart AI-powered search of Queryinside, making data retrieval quick and easy.
Cons
  • Users feel that a more guided onboarding experience would significantly ease the learning curve of Queryinside.

What Are Recent G2 Reviews of Queryinside?

Bijou Barry
BB
Researched and written by Bijou Barry
Updated June 24, 2026