Top Free Data Visualization Tools - Page 13

How Many Data Visualization Tools Products Does G2 Track?

Total Products under this Category: 697

Category Stats (Nov 2026)

  • Average Rating: 4.44/5 The average rating of products in this category, based on all submitted ratings
  • Top Trending Product: Upsolve AI (+1.75%) - Among all products in this category, Upsolve AI recorded the largest rating increase compared to last month

Last updated: November 01, 2026

How Does G2 Rank Data Visualization Tools Products?

Why You Can Trust G2's Software Rankings:

  • 30 Analysts and Data Experts
  • 20,400+ Authentic Reviews
  • 697+ Products
  • Unbiased Rankings

G2's software rankings are built on verified user reviews, rigorous moderation, and a consistent research methodology maintained by a team of analysts and data experts. Each product is measured using the same transparent criteria, with no paid placement or vendor influence. While reviews reflect real user experiences, which can be subjective, they offer valuable insight into how software performs in the hands of professionals. Together, these inputs power the G2 Score, a standardized way to compare tools within every category.

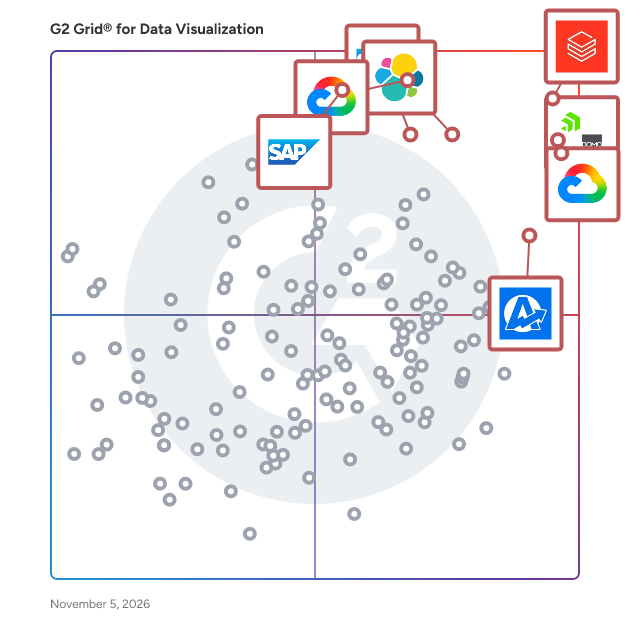
G2 Grid® for Data Visualization Tools

G2 Grid® for Data Visualization Tools plotting products by satisfaction and market presence

Highlighted products: Databricks, Domo, Looker, Data Studio, Elastic Stack, AgencyAnalytics, SAP HANA Cloud, and SAP Analytics Cloud.

Underlying data: [Grid® JSON](https://www.g2.com/categories/data-visualization-tools/grids.json?focus%5B%5D=databricks&focus%5B%5D=domo&focus%5B%5D=looker&focus%5B%5D=data-studio&focus%5B%5D=elastic-stack&focus%5B%5D=agencyanalytics&focus%5B%5D=sap-hana-cloud-2025-10-01&focus%5B%5D=sap-analytics-cloud)

Reportabl.io

Reportabl is a Cloud based data platform and reporting solution for Small to Medium sized organisation. We specialise in data and reporting for Health, Accounting and Sports Organisations.

Who Is the Company Behind Reportabl.io?

Restaurant & Online Store Data Visualizations

Flumen Data Analytics builds interactive data visualizations customized for small business owners including a free tier and premium service at just $29, a fraction of the competitor's prices. This connects directly to your Square, Toast, Clover, Shopify, or WooCommerce account, meaning no software install or setup necessary, and you will instantly receive your personalized dashboard. Flumen operates as a monthly subscription service with a free tier available and no contract requirement. Available now: https://flumendataanalytics.com/ Flumen is intentionally structured to give you the peace of mind that your sensitive data is never at risk - there is NEVER access to any personally identifying or confidential information at any time, and your connecting system will confirm this on a permissions page upon signup. In addition, you can view or revoke transactional data access permissions at ANY time in your point of sale service's dashboard. Full details are laid out at: https://flumendataanalytics.com/privacy

Who Is the Company Behind Restaurant & Online Store Data Visualizations?

AI can help you find the answers. G2 helps you trust them.

Connect G2 to Claude or ChatGPT for answers grounded in G2's trusted reviews, comparisons, and pricing from real user insights.

How it works

RowShare

RowShare is a secure collaborative table that lets you gather data from multiple users in a simple while very secure way. It comes with table templates to centralize and simplify manual processes. More productive and organized than paper documents, emails, or Excel files scattered among different collaborators. Simpler, faster, and much easier to use than specialized software.

Who Is the Company Behind RowShare?

  • Seller: Rowshare
  • Year Founded: 2014
  • HQ Location: Antony, FR
  • LinkedIn® Page: www.linkedin.com
    7 employees on LinkedIn®

ShaleProfile

ShaleProfile is an oil & gas analytics solution designed for a complete understanding of US Shale. Access to our interactive dashboards or comprehensive database allows you to easily analyze production and completion trends on over 140 thousand horizontal wells across 13 states.

Who Is the Company Behind ShaleProfile?

SKOOR

SKOOR GmbH offers a scalable, customizable KPI dashboard solution tailored for businesses seeking flexible performance management. Designed to integrate seamlessly with diverse data sources and existing systems, SKOOR eliminates the need for workflow adjustments while delivering real-time analytics, AI-driven insights, and predictive forecasting. Its user-friendly platform features highly customizable dashboards, real-time monitoring, and automated alerts, supporting informed decision-making and efficient business processes. Ideal for complex reporting, including ESG and cash management, SKOOR adapts effortlessly to any size organization, enhancing data-driven strategies for growth and sustainability.

Who Is the Company Behind SKOOR?

  • Seller: Skoor
  • Year Founded: 2001
  • HQ Location: Wallisellen, CH
  • LinkedIn® Page: www.linkedin.com
    13 employees on LinkedIn®

Spotfire Enterprise

Spotfire® is a visual data science platform designed to help organizations address complex, industry-specific challenges by effectively utilizing data. This solution offers a range of flexible packaging options tailored to meet the diverse needs of teams at various stages of their visual data science journey. Spotfire® Enterprise is designed to scale visual data science securely and efficiently across the entire organization. It delivers the governance, performance, and flexibility needed to make analytics mission-ready, ensuring teams can collaborate on insights while maintaining the highest levels of security and compliance. With centralized administration, role-based access, and full-stack integration, Spotfire Enterprise enables organizations to roll out analytics at scale without compromising on governance or control. Built for large deployments, Spotfire Enterprise combines collaboration with enterprise-grade safeguards. Users can publish and share analyses seamlessly across departments. At the same time, IT teams benefit from robust security features, including identity and access management integration, role-based permissions, audit logs, and data lineage support. This ensures compliance with both internal policies and external regulations, while providing stakeholders with confidence in the reliability of their data-driven decisions. The platform’s scalability supports thousands of users, backed by centralized license and user management that simplifies administration across complex environments. Flexible integration with third-party systems and APIs extends its capabilities, enabling organizations to customize workflows and embed Spotfire into existing ecosystems. Automation features, including scheduled and event-triggered report distribution, ensure decision-makers always have access to the latest insights without manual intervention. By uniting powerful analytics with enterprise-grade infrastructure, Spotfire Enterprise empowers organizations to foster collaboration, extend insights across teams, and operationalize analytics at scale, all while ensuring governance, security, and efficiency remain uncompromised. Collaborate securely, govern confidently, and scale analytics across your organization. Spotfire Enterprise provides the trusted foundation for delivering analytics at scale, combining centralized administration, security, and automation with the flexibility of the Spotfire platform. Deploy on-premises or in the cloud, manage users and permissions easily, and ensure compliance through audit logs, lineage, and identity integration. Enable every team to access consistent, up-to-date insights with scheduled updates, automation services, and Python/R services. IT teams maintain full control; business users enjoy fast, governed access to trusted analytics. Best for: Organizations rolling out Spotfire enterprise-wide with strict security, compliance, and performance requirements.

Who Is the Company Behind Spotfire Enterprise?

Stratifyd

Stratifyd is the only next-gen experience analytics platform powered by Smart AI™ that empowers people of all skill levels to move beyond traditional customer experience analytics. By surfacing insights that existing approaches may miss, Stratifyd Smart AI™ takes the burden of manual analytics off teams, proactively surfacing hidden signals and themes 24/7 to ensure you never miss another insight. Today, many organizations have tons of data but lack the ability, time, resources, or budget to truly expose the insights that matter most to them. This is where Stratifyd stands out. With these challenges in mind, we have purpose-built the Stratifyd platform that will unify data from all your different sources and, through Smart AI™, automatically uncover the actionable insights you didn't know you were missing to: - Hit mission critical KPIs - Grow revenue - Drive loyalty - Reduce costs - Improve efficiency

Average Rating: 4.3/5.0

Total Reviews: 18

How Do G2 Users Rate Stratifyd?

  • Has the product been a good partner in doing business?: 10.0/10 (Category avg: 9.0/10)

Who Is the Company Behind Stratifyd?

  • Seller: Stratifyd
  • Year Founded: 2015
  • HQ Location: Charlotte, US
  • LinkedIn® Page: www.linkedin.com
    14 employees on LinkedIn®

Who Uses This Product?

  • Company Size: 70% Large, 20% Medium

What Are Recent G2 Reviews of Stratifyd?

What Are G2 Users Discussing About Stratifyd?

SymmetricDS

SymmetricDS is the most advanced data replication and synchronization software solution for databases and filesystems. Easily integrate data using continuous change data capture in near real-time so you can focus on your application. SymmetricDS is proven in use cases that require fast and reliable database replication across local and wide area networks. Our data capture solution excels in the cloud and conditions where network bandwidth is limited or connectivity is intermittent. Core features include: ✓ Cross-platform data capture solution ✓ Sync any database to any database ✓ Distribute, filter, and transform ✓ Replicate from on-premise to cloud ✓ Scale to thousands of databases ✓ Automatic recovery ✓ Easy setup and configuration ✓ Powerful extension API

Average Rating: 5.0/5.0

Total Reviews: 1

How Do G2 Users Rate SymmetricDS?

  • Has the product been a good partner in doing business?: 10.0/10 (Category avg: 9.0/10)

Who Is the Company Behind SymmetricDS?

  • Seller: Jumpmind
  • Year Founded: 2008
  • HQ Location: Columbus, US
  • LinkedIn® Page: www.linkedin.com
    58 employees on LinkedIn®

Who Uses This Product?

  • Company Size: 100% Large

What Are Recent G2 Reviews of SymmetricDS?

TolaData

TolaData is a monitoring and evaluation (M&E) software for NGOs and Social Enterprises. Built by a team of experienced NGO professionals, data scientists and tech innovators, TolaData harnesses the latest in technology to make M&E simpler, effective and accessible for all. Our versatile tools enable organisations to manage the complete indicator workflow in one platform - from data collection, management and analysis to designing a results framework and indicator plan to reporting progress in real time. Organisations are thus empowered to measure project performance, demonstrate results on the ground and create positive impact.

Who Is the Company Behind TolaData?

Tugger

Tugger is the AI-powered data platform that connects your business systems to the analytics and AI tools you want to use. Most businesses are sitting on a goldmine of data locked inside the platforms they use every day - job management systems, accounting software, CRM tools, and more. Getting that data out, combining it, and turning it into real answers has traditionally meant expensive developers, complex API work, and months of setup. Tugger changes that. How it works Tugger connects to your business platforms - Simpro, Xero, HubSpot, QuickBooks, and more - and automatically pulls your data into a secure, managed cloud data warehouse. No coding. No API configuration. No data warehouse setup required. We handle all of that so you don't have to. Once your data is in the warehouse, you've got two powerful ways to get answers. Ask your data anything Connect your Tugger warehouse to Claude, ChatGPT, or Gemini via our built-in MCP server and ask questions in plain English. No SQL. No formulas. No waiting for someone to build a report. Just type a question and get a real, data-backed answer in seconds. Ask things like "which jobs made money last month?" or "what's my quote conversion rate by salesperson?" - instantly, across all your connected systems at once. Power BI and Tableau dashboards For teams that want visual dashboards, Tugger connects directly to Power BI and Tableau. Pre-built report templates for the most popular connectors mean you can hit the ground running without building everything from scratch. Who uses Tugger Field service businesses use Tugger to track job profitability, technician utilisation, and quote conversion. Finance teams use it to get instant answers from Xero and QuickBooks without manual exports. Sales teams connect HubSpot for pipeline visibility and performance reporting. Accountancy practices use it to give clients self-serve access to their own data across multiple entities. Why customers choose Tugger Simple to set up - most customers are up and running in minutes, not months. Secure by design - ISO 27001 aligned, built on Microsoft Azure, with enterprise-grade data storage included in every plan. No contracts, transparent pricing, and a support team customers consistently describe as outstanding.

Average Rating: 4.8/5.0

Total Reviews: 5

How Do G2 Users Rate Tugger?

  • Has the product been a good partner in doing business?: 10.0/10 (Category avg: 9.0/10)

Who Is the Company Behind Tugger?

  • Seller: Tugger
  • Year Founded: 2021
  • HQ Location: Bollington, GB
  • LinkedIn® Page: www.linkedin.com
    16 employees on LinkedIn®

Who Uses This Product?

  • Company Size: 60% Small, 40% Medium

What Do G2 Reviewers Say About Tugger?

AI-generated summary from verified user reviews

Pros
  • Users commend Tugger's exceptional customer support, highlighting their dedication and expertise in resolving issues efficiently.
  • Users value Tugger's easy accessibility to insightful reports, enhancing their data experience effortlessly across platforms.
  • Users value the expertise in data extraction and BI reporting from Tugger, enhancing report accessibility and reliability.
  • Users praise Tugger for its ease of use, simplifying data integration and reporting with intuitive templates and support.
  • Users appreciate Tugger's ease of use and excellent support for seamless Power BI integration and report creation.

What Are Recent G2 Reviews of Tugger?

Veezoo

Veezoo is an Agentic Analytics platform engineered for trust and reliability, purpose-built to empower every business user — regardless of technical background — to ask questions about their data and receive accurate, governed, and auditable answers. Founded in 2016 as a spin-off from ETH Zurich, Veezoo has been building AI-native analytics long before large language models became mainstream, combining Agentic AI with a proprietary Knowledge Graph architecture. At the core of Veezoo is the Knowledge Graph: a semantic layer that captures a company's business ontology, KPI definitions, metrics, governance rules, and authorization logic. Unlike conventional AI analytics tools that allow language models to write SQL directly — leading to hallucinated metrics and inconsistent results — Veezoo's AI translates every natural language question into Veezoo Query Language (VQL), which is then compiled to SQL through a deterministic, rule-based process. This means the AI never touches raw database tables, business logic is always applied consistently, and every result is fully traceable and auditable. Business users interact with Veezoo through a conversational chat interface, asking questions in plain language and receiving instant, verified answers with charts, tables, and dashboards. Veezoo interprets the data, suggests next steps, and summarizes key insights. Monitoring agents can investigate anomalies and alert teams when something requires action. Every chart title, filter, and label is rendered directly from VQL — not generated by an AI — so users can verify exactly what the data shows and hover over any term to see its governed definition. For data teams, Veezoo provides a Knowledge Graph IDE for modeling semantic layers from scratch using AI, leveraging existing documentation. The platform supports version control, BI-as-Code workflows, development branches, and automated tests — following best practices of modern analytics engineering. The Knowledge Graph lives in Git, making it versioned, reviewable, and auditable without vendor lock-in. Veezoo integrates natively with 17+ databases and data warehouses including Snowflake, Google BigQuery, Databricks, Amazon Redshift, PostgreSQL, MySQL, Microsoft SQL Server, Oracle, SAP HANA, and more. It also integrates with dbt Cloud to import models, metrics, and documentation, and delivers scheduled results and alerts directly to Slack and Microsoft Teams. An MCP server allows other AI tools such as Claude, ChatGPT, and Gemini to query the governed Knowledge Graph, and a public REST API enables custom integrations, embedded analytics, and CI/CD automation. Veezoo supports embedded analytics, allowing organizations to integrate the conversational analytics experience directly into their own applications in multi-tenant environments. The platform also features customizable branding, collaborative dashboards, and export capabilities to PDF, PNG, JPEG, SVG, and Excel. Recognized as a 2024 Gartner Cool Vendor in AI Models and Natural Language Technologies, Veezoo is trusted by thousands of users at companies including AXA, Bayer, Baloise, Breitling, Valora, and Air Up. The platform is headquartered in Zurich, Switzerland, and serves organizations ranging from innovative startups to Fortune 500 enterprises across industries including insurance, retail, consumer goods, and financial services.

Average Rating: 5.0/5.0

Total Reviews: 1

How Do G2 Users Rate Veezoo?

  • Has the product been a good partner in doing business?: 10.0/10 (Category avg: 9.0/10)

Who Is the Company Behind Veezoo?

  • Seller: Veezoo
  • Company Website:
  • Year Founded: 2016
  • HQ Location: Zurich, CH
  • LinkedIn® Page: www.linkedin.com
    19 employees on LinkedIn®
Who Uses This Product?

  • Company Size: 100% Small

What Are Recent G2 Reviews of Veezoo?

Versio.io Platform

Versio.io is an enterprise software solution based on historicized IT monitoring data to optimize and support your IT operations. With Versio.io you can historize your IT monitoring data extracting additional value from it. This allows you to reduce IT deployment costs and to use existing IT resources more efficiently. Optimization solutions require information from the history provided by Versio.io. This enables you to reduce hardware and license costs, ensure auditability of your IT, automate governance and compliance rule monitoring, ensure fair distribution of IT cost allocation, and further more.

Average Rating: 5.0/5.0

Total Reviews: 1

Who Is the Company Behind Versio.io Platform?

Who Uses This Product?

  • Company Size: 67% Small, 33% Large

What Are Recent G2 Reviews of Versio.io Platform?

What Are G2 Users Discussing About Versio.io Platform?

Viberate

Viberate Analytics provides structured music data for industry professionals. It enables A&R teams, managers, labels, and artists to discover talent, analyze audiences, track playlists, and evaluate performance across Spotify stats, YouTube analytics, and radio airplay — all connected in one system.

Average Rating: 5.0/5.0

Total Reviews: 1

Who Is the Company Behind Viberate?

  • Seller: Viberate
  • Year Founded: 2015
  • HQ Location: London, GB
  • LinkedIn® Page: www.linkedin.com
    43 employees on LinkedIn®

Who Uses This Product?

  • Company Size: 100% Small

What Are Recent G2 Reviews of Viberate?

Visyond

Turn your Excel into an insights machine anybody can drive. Visualize your spreadsheets as predictive dashboards, automate financial statements, and collaborate on what-if and risk analyses while protecting the model, sensitive data, and controlling exactly how much each and every person can interact with it. Keep the flexibility of a spreadsheet - use the familiar syntax of Excel — including dynamic arrays and XLOOKUPs — and quickly analyze the model, its scenarios, and create interactive visualizations for your team. Be in control - boost your team’s capabilities to get insights from and contribute information to the central spreadsheet in a secure and organized way that you control. Get answers in minutes - establish a visualization layer for your team to ask the central model ‘what-if’ questions, analyze scenarios and risks, and share interactive insights in minutes. Fewer errors, better security - improve data accuracy, reduce the risk of errors, protect sensitive information, and make better decisions, faster.

Average Rating: 4.8/5.0

Total Reviews: 6

How Do G2 Users Rate Visyond?

  • Has the product been a good partner in doing business?: 10.0/10 (Category avg: 9.0/10)

Who Is the Company Behind Visyond?

Who Uses This Product?

  • Company Size: 67% Small, 33% Medium

What Are Recent G2 Reviews of Visyond?

What Are G2 Users Discussing About Visyond?

Bijou Barry
BB
Researched and written by Bijou Barry
Updated June 24, 2026