Top Free Data Visualization Tools - Page 12

How Many Data Visualization Tools Products Does G2 Track?

Total Products under this Category: 697

Category Stats (Nov 2026)

  • Average Rating: 4.44/5 The average rating of products in this category, based on all submitted ratings
  • Top Trending Product: Upsolve AI (+1.75%) - Among all products in this category, Upsolve AI recorded the largest rating increase compared to last month

Last updated: November 01, 2026

How Does G2 Rank Data Visualization Tools Products?

Why You Can Trust G2's Software Rankings:

  • 30 Analysts and Data Experts
  • 20,400+ Authentic Reviews
  • 697+ Products
  • Unbiased Rankings

G2's software rankings are built on verified user reviews, rigorous moderation, and a consistent research methodology maintained by a team of analysts and data experts. Each product is measured using the same transparent criteria, with no paid placement or vendor influence. While reviews reflect real user experiences, which can be subjective, they offer valuable insight into how software performs in the hands of professionals. Together, these inputs power the G2 Score, a standardized way to compare tools within every category.

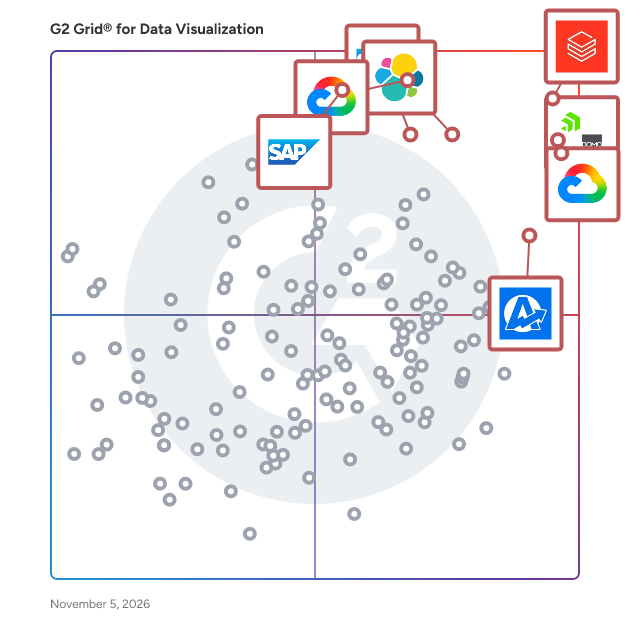
G2 Grid® for Data Visualization Tools

G2 Grid® for Data Visualization Tools plotting products by satisfaction and market presence

Highlighted products: Databricks, Domo, Looker, Data Studio, Elastic Stack, AgencyAnalytics, SAP HANA Cloud, and SAP Analytics Cloud.

Underlying data: [Grid® JSON](https://www.g2.com/categories/data-visualization-tools/grids.json?focus%5B%5D=databricks&focus%5B%5D=domo&focus%5B%5D=looker&focus%5B%5D=data-studio&focus%5B%5D=elastic-stack&focus%5B%5D=agencyanalytics&focus%5B%5D=sap-hana-cloud-2025-10-01&focus%5B%5D=sap-analytics-cloud)

Lumenad

Lumenad is advertising intelligence software that enables hassle-free organization, management and reporting of cross-channel data. Marketing teams can use Lumenad as the source-of-truth to drive performance of digital advertising campaigns. Our software takes the guesswork out of media data analysis, enabling marketers to quickly and accurately draw conclusions and make campaign optimizations. Reporting – whether it’s throughout the campaign or upon its conclusion – is a high-quality, seamless experience and has been built with a marketer in mind.

Average Rating: 4.2/5.0

Total Reviews: 3

How Do G2 Users Rate Lumenad?

  • Has the product been a good partner in doing business?: 10.0/10 (Category avg: 9.0/10)

Who Is the Company Behind Lumenad?

  • Seller: LumenAd
  • Year Founded: 2015
  • HQ Location: Missoula, US
  • LinkedIn® Page: www.linkedin.com
    6 employees on LinkedIn®

Who Uses This Product?

  • Company Size: 100% Small

What Are Recent G2 Reviews of Lumenad?

What Are G2 Users Discussing About Lumenad?

Lumenn AI

Lumenn AI provides a no-code environment for non-technical employees to extract and leverage enterprise data. Through natural language instructions, complex data is transformed into accessible visual graphs with AI-driven insights. Customizable dashboards empower any user to create, manage, and share BI assets.

Who Is the Company Behind Lumenn AI?

Lumenore

Lumenore helps businesses turn data into actionable business intelligence with the power of AI, natural language querying, and predictive analytics. With industry-specific solutions embedded in a powerful BI platform, Lumenore turns your raw data into accurate insights. Ensure seamless data integration, enable modern business storytelling, and encourage advanced insight discovery. Create an all-in-one data universe for effective decision-making across business functions with Lumenore.

Average Rating: 4.5/5.0

Total Reviews: 2

How Do G2 Users Rate Lumenore?

  • Has the product been a good partner in doing business?: 8.3/10 (Category avg: 9.0/10)

Who Is the Company Behind Lumenore?

  • Seller: Netlink
  • Year Founded: 2013
  • HQ Location: Madison Heights, US
  • LinkedIn® Page: www.linkedin.com
    74 employees on LinkedIn®

Who Uses This Product?

  • Company Size: 50% Medium, 50% Small

What Are Lumenore's Pros and Cons?

Pros
  • Analytics (1 reviews)
  • Data Analysis (1 reviews)
  • Data Visualization (1 reviews)
  • Ease of Use (1 reviews)
  • Easy Integrations (1 reviews)
Cons
  • Poor UI (1 reviews)

What Are Recent G2 Reviews of Lumenore?

AI can help you find the answers. G2 helps you trust them.

Connect G2 to Claude or ChatGPT for answers grounded in G2's trusted reviews, comparisons, and pricing from real user insights.

How it works

MachEye

MachEye’s augmented analytics platform transforms the way organizations integrate their data, decisions, and operations. While current business intelligence platforms only answer “what” questions on data, MachEye helps users answer “what, why, and how” scenarios for everyone at an organization. Decision makers at any level can now receive actionable insights and recommendations through a “Google like” search experience and “YouTube like” audio-visual experience, in addition to charts and self-service analytics. MachEye adds an actionable “play” button to data! For more information, visit https://www.macheye.com.

Average Rating: 4.7/5.0

Total Reviews: 10

How Do G2 Users Rate MachEye?

  • Has the product been a good partner in doing business?: 8.9/10 (Category avg: 9.0/10)

Who Is the Company Behind MachEye?

  • Seller: MachEye
  • Year Founded: 2018
  • HQ Location: San Jose, US
  • LinkedIn® Page: www.linkedin.com
    11 employees on LinkedIn®

Who Uses This Product?

  • Company Size: 70% Medium, 20% Small

What Are Recent G2 Reviews of MachEye?

What Are G2 Users Discussing About MachEye?

Mitra

Mitra é uma plataforma unificada de Desenvolvimento Visual que abrange banco de dados, interface e lógica. Com uma interface intuitiva e suporte a SQL, o Mitra integra front-end, back-end e banco de dados, acelerando o desenvolvimento de aplicações em até 10x. A plataforma oferece um construtor de banco de dados completo, permitindo que os usuários criem e gerenciem tabelas, atributos e conexões de forma simplificada. Além disso, o Mitra possibilita a criação de interfaces responsivas para web e dispositivos móveis usando o PageBuilder, que utiliza supercomponentes personalizáveis e otimizados. A camada de lógica é gerenciada por meio de ações visuais e integrações com serviços externos via IPaaS, proporcionando flexibilidade na automação de processos. Por fim, o Mitra simplifica o lançamento de produtos, seja para plataformas B2B, B2C, web ou mobile, com opções white-label e domínios personalizados. Ideal para projetos personalizados, startups ou aplicações corporativas, o Mitra representa uma nova abordagem no desenvolvimento de software baseada em Desenvolvimento Visual.

Who Is the Company Behind Mitra?

  • Seller: Mitra
  • Year Founded: 2018
  • HQ Location: Uberlândia, BR
  • LinkedIn® Page: www.linkedin.com
    269 employees on LinkedIn®

MUI X Data Grid

A fast and extensible React data table and React data grid, with filtering, sorting, aggregation, and more. The MUI X Data Grid is a TypeScript-based React component that presents information in a structured format of rows and columns. It provides developers with an intuitive API for implementing complex use cases; and end users with a smooth experience for manipulating an unlimited set of data.

Average Rating: 4.3/5.0

Total Reviews: 3

Who Is the Company Behind MUI X Data Grid?

  • Seller: MUI
  • Year Founded: 2019
  • HQ Location: Paris, TF
  • LinkedIn® Page: www.linkedin.com
    92 employees on LinkedIn®

Who Uses This Product?

  • Company Size: 100% Medium

What Are Recent G2 Reviews of MUI X Data Grid?

NetMiner

NetMiner 5 is an advanced analytics platform developed by CYRAM Inc. that combines graph theory, machine learning, and AI to analyze, visualize, and interpret network and text data. Designed for researchers, analysts, and decision-makers across academia, government, and industry, NetMiner helps users uncover complex relational and textual patterns without requiring any programming expertise. At its core, NetMiner is built around social network analysis (SNA), enabling the structural exploration of relationships between people, organizations, documents, and concepts. It supports one-mode, two-mode, and multiplex networks, and provides a wide range of SNA metrics from basic to advanced to assess individual centrality, group dynamics, and whole-network structure. NetMiner goes beyond traditional SNA by integrating machine learning (ML) and graph neural networks (GNNs). Users can easily apply supervised and unsupervised learning techniques such as classification, regression, and clustering, as well as GNN models like GCN, GraphSAGE, and GAT, for predictive modeling. In terms of text analysis, NetMiner offers powerful capabilities to extract keywords, build co-occurrence networks, generate word clouds, and perform topic modeling using LDA. This allows users to move beyond frequency-based analysis and explore the latent meaning structure in large text corpora. NetMiner includes a powerful interactive 2D visualization engine that makes network structure exploration intuitive. Nodes and links can be styled by centrality, frequency, or categories, and users can zoom, filter, and drag to explore key actors and patterns. These visualizations are directly linked to the data for accurate interpretation. Even with large datasets, dynamic visual analysis is possible without writing code. The built-in AI Assistant, powered by LLMs like GPT and Gemini, helps interpret results and suggests next steps—making it accessible even to users who are new to network or text analysis. NetMiner is widely used across fields including: - Academic research: sociology, communication, political science, digital humanities, education - Policy analysis and public sector planning: stakeholder mapping, policy network evaluation, community structure detection - Enterprise analysis: internal communication auditing, compliance monitoring, customer segmentation, influencer analysis - Media and social media analysis: opinion leader detection, information diffusion, discourse analysis - Cybersecurity and anomaly detection: email network analysis, abnormal behavior pattern identification NetMiner supports importing and exporting various file formats (CSV, Excel) and integrates with external tools via APIs and scripting. Licenses are available for students, educational institutions (schools), and organizations/corporations. More than just a network visualization tool, NetMiner is a complete analysis environment built on the foundation of network thinking. It helps users move from data to insight to action—faster, smarter, and with greater clarity. To learn more or request a demo, visit www.netminer.com

Average Rating: 4.5/5.0

Total Reviews: 1

Who Is the Company Behind NetMiner?

  • Seller: NetMiner
  • Year Founded: 2000
  • HQ Location: Gyeonggi-do, South Korea
  • LinkedIn® Page: www.linkedin.com
    1 employees on LinkedIn®
Who Uses This Product?

  • Company Size: 100% Small

What Are Recent G2 Reviews of NetMiner?

Nveil AI

Nveil AI is an explainable AI platform that transforms raw data into production-ready, interactive visualizations — without writing a single line of code. Upload a CSV, Excel, JSON, or medical imaging file, describe what you need in plain language, and Nveil generates charts, dashboards, 3D renderings, heatmaps, and more in seconds. Unlike traditional data visualization tools that require mastering Python, R, or complex BI software, Nveil removes the technical barrier entirely. Its natural language interface lets researchers, analysts, healthcare professionals, and business teams go from raw dataset to actionable insight in a single conversation. No setup, no configuration, no learning curve. What sets Nveil apart is its deterministic AI architecture. While most AI-powered analytics tools rely on probabilistic language models prone to hallucinations, Nveil's proprietary engine — Choregraph™ — orchestrates every pipeline with verifiable, reproducible mathematics. Every visualization is explainable and auditable, making it suitable for regulated industries like healthcare, finance, and scientific research. Key capabilities include no-code data visualization with drag-and-drop support for CSV, XLSX, JSON, DICOM, and MHD formats; interactive exploration with pan, hover, and parameter adjustment on charts, maps, networks, scatter plots, volumetric renderings, and surfaces; large-scale data handling for datasets of several gigabytes; export flexibility to images, PDFs, or embeddable HTML; real-time collaboration across devices; and data privacy by design — Nveil never uses your data to train its models. Nveil serves a wide range of use cases: from medical imaging reconstruction and tumor evolution simulation to fraud detection, Benford's Law analysis, and cross-sectional dataset exploration. Backed by years of research from TIMC Lab and Université Grenoble Alpes, the platform bridges the gap between academic rigor and business-ready analytics. Whether you're a data scientist looking to accelerate exploratory analysis, a researcher who needs reproducible visualizations for publication, or a business team tracking KPIs without waiting on IT — Nveil AI delivers instant, trustworthy, and beautiful data storytelling.

Who Is the Company Behind Nveil AI?

  • Seller: Nveil
  • Year Founded: 2023
  • HQ Location: Grenoble, FR
  • LinkedIn® Page: www.linkedin.com
    4 employees on LinkedIn®

Observable

Observable is a data analysis and exploration platform that helps data analysts and their stakeholders understand their business data, build charts and other visualizations, and communicate insights. Built for teams, powered by AI, and backed by a global community of data practitioners, Observable offers a single workspace for data exploration, custom chart creation, and cross-functional data collaboration. Observable's collaborative whiteboard for data analysis, Observable Canvases, helps analysts with exploratory data analysis, advanced chart creation, and data storytelling. It makes the data analysis process more streamlined by bringing querying, chart creation, and sharing all in one platform. Users can choose between code, UI, or AI, and easily move between all three depending on the task at hand. The AI is also deeply integrated and turnkey, operating transparently on the canvas to allow users to understand, interpret, and fine-tune its results and reasoning, building trust in its recommendations. Additionally, whiteboarding features like comments, illustrations, and annotations help bring stakeholders into the data analysis process to reduce frustrating back-and-forths. Sophisticated data visualizations such as beeswarms, Sankey diagrams, choropleths, and more are available out-of-the-box to enable users to easily create and share expressive, interactive charts. Users can embed charts in internal apps, and generate polished, stakeholder-friendly dashboards in just a few clicks.

Average Rating: 4.4/5.0

Total Reviews: 4

How Do G2 Users Rate Observable?

  • Has the product been a good partner in doing business?: 10.0/10 (Category avg: 9.0/10)

Who Is the Company Behind Observable?

  • Seller: Observable
  • Year Founded: 2017
  • HQ Location: San Francisco, US
  • LinkedIn® Page: www.linkedin.com
    23 employees on LinkedIn®

Who Uses This Product?

  • Company Size: 50% Small, 25% Medium

What Do G2 Reviewers Say About Observable?

AI-generated summary from verified user reviews

Pros
  • Users love the seamless data exploration with Observable's reactive programming and effortless D3.js integration.
  • Users value the real-time collaboration of Observable, making teamwork more effective and enjoyable.
  • Users love the seamless data exploration offered by Observable, enhancing collaboration and visual output effortlessly.
  • Users admire the beautiful visual output of Observable, enhancing their data exploration and presentation experience.
  • Users highlight the effortless ease of use with Observable, enabling seamless data exploration and collaboration.
Cons
  • Users often find Observable browser-heavy with large data sets, impacting performance and usability in complex applications.
  • Users find Observable to be browser-heavy when handling large data sets or complex applications, affecting performance.
  • Users find Observable to have slow performance, particularly with large data sets or complex applications.

What Are Recent G2 Reviews of Observable?

Optelos

Optelos is a flexible, scalable and secure cloud-based visual data management and AI analytics platform that transforms geovisual data into actionable insights. Our patented technology geolocates and correlates all types of asset inspection data, organizing vast amounts of unstructured data into an intuitive, contextualized and searchable database ready for analysis and AI implementation. Leveraging computer vision AI, advanced image modeling and APIs for enterprise systems integration, Optelos enables businesses to operationalize and automate their visual asset inspection programs. Optelos is based in Austin, TX.

Average Rating: 4.0/5.0

Total Reviews: 1

Who Is the Company Behind Optelos?

  • Seller: Optelos
  • Year Founded: 2016
  • HQ Location: Deer Park, US
  • LinkedIn® Page: www.linkedin.com
    22 employees on LinkedIn®

Who Uses This Product?

  • Company Size: 100% Small

What Are Recent G2 Reviews of Optelos?

What Are G2 Users Discussing About Optelos?

Papermill

Papermill is the print-native document generation API designed for AI workflows and agents. Replace brittle HTML-to-PDF pipelines with a markup language built for print that makes it easy to generate sophisticated results. You can use Papermill to add professional PDF production to your AI application, workflow, or agent. Integrate via our API or use our agent-first MCP server and send markdown, JSON and other formats to receive high-quality PDFs in real-time. Key Features: - Print-native document language. No reliance on slow and low-quality HTML solutions. Papermill's design-first approach supports complex layouts, advanced features such as bespoke contents pages, multiple content flows, and built-in visualisations. - Robust and adaptive rendering. Features like auto-sizing of text, automatic table layout, intelligent image overlays, and content flow between frames ensure that documents don't break when content changes - ideal for AI applications and products that require consistent premium results. - Support for multiple data sources. Inject markdown into your documents, generate document sections and components directly from data, turn data directly into visualisations. Some example applications of Papermill within our customer base: - Generating property and land intelligence reports based on human and AI analysis of geospatial data. - Compliance audits in medical and financial domains, performed by AI and presented in professional PDF reports using Papermill. - Engineering document generation using mathematics, referencing, and complex layouts. Papermill is best for developer teams shipping AI products that need document output as a first-class deliverable.

Who Is the Company Behind Papermill?

Pointerra

Pointerra3D is a cloud-native end-to-end platform for managing and analyzing geospatial data. Designed as a data-agnostic Common Data Environment (CDE), it enables teams to store, process, visualize, and share massive datasets—instantly and securely—without the need for specialist hardware or software. By transforming complex point clouds, imagery, and vector data into interactive, living digital twins, Pointerra3D gives organizations a real-time understanding of their assets, networks, and environments. The result: faster decisions, improved collaboration, and reduced operational and capital costs across the entire asset lifecycle. *Key Capabilities* Data-Agnostic Management & Hosting Import, organize, and securely host any spatial dataset in the cloud—irrespective of source or format. Pointerra3D supports LAS/LAZ, E57, PTS, GeoTIFF, and more, allowing users to centralize point clouds, imagery, and vector data within a unified Common Data Environment. Flexible Visualization & Sharing Stream and interact with massive 3D datasets directly from your browser. Visualize billions of points in real time, combine multiple data types, and access your projects anywhere—no downloads or desktop software required. Analytics & Automation Derive instant insights from complex datasets through Pointerra3D’s growing suite of AI-powered analytics. From volumetrics and conformance checks to change detection and object extraction, automate spatial intelligence workflows at scale. Data Reliability Work within a true Common Data Environment that connects teams, contractors, and clients to the same, live dataset. Share secure access links, manage permissions, and ensure everyone works from a single source of truth. Open, Scalable, and Connected Built for open integration and enterprise scalability. Pointerra3D connects with other systems and platforms through APIs, ensuring interoperability across data types, tools, and organizations—from local survey firms to global infrastructure operators. *Who Uses Pointerra3D* Trusted by leading organizations in asset intensive industries spanning transport, utilities, mining, oil & gas, defense, construction, and geospatial services, Pointerra3D empowers teams to build and maintain digital twins for inspection, planning, design, and asset management—delivering better decisions, faster. *The Problem Solved* Massive 2D and 3D datasets are notoriously difficult to manage, share, and analyze using traditional desktop tools. Pointerra3D eliminates these bottlenecks by centralizing data in the cloud where it can be visualized, analyzed, and shared instantly. This democratizes access to high-value spatial intelligence, improves efficiency across workflows, and unlocks the full potential of digital twins at scale.

Average Rating: 4.0/5.0

Total Reviews: 1

How Do G2 Users Rate Pointerra?

  • Has the product been a good partner in doing business?: 6.7/10 (Category avg: 9.0/10)

Who Is the Company Behind Pointerra?

Who Uses This Product?

  • Company Size: 100% Medium

What Are Recent G2 Reviews of Pointerra?

Qubole

Qubole is the open data lake company that provides a simple and secure data lake platform for machine learning, streaming, and ad-hoc analytics. No other platform provides the openness and data workload flexibility of Qubole while radically accelerating data lake adoption, reducing time to value, and lowering cloud data lake costs by 50 percent. Qubole’s Platform provides end-to-end data lake services such as cloud infrastructure management, data management, continuous data engineering, analytics, and machine learning with near-zero administration. Qubole is trusted by leading brands such as Expedia, Disney, Oracle, Gannett and Adobe to spur innovation and to transform their businesses for the era of big data. For more information, visit us at www.qubole.com.

Average Rating: 4.0/5.0

Total Reviews: 237

How Do G2 Users Rate Qubole?

  • Has the product been a good partner in doing business?: 8.1/10 (Category avg: 9.0/10)

Who Is the Company Behind Qubole?

  • Seller: Qubole
  • Year Founded: 2011
  • HQ Location: Santa Clara, CA
  • LinkedIn® Page: www.linkedin.com
    23 employees on LinkedIn®

Who Uses This Product?

  • Who Uses This: Software Engineer, Data Scientist
  • Top Industries: Computer Software, Information Technology and Services
  • Company Size: 51% Large, 44% Medium

What Are Recent G2 Reviews of Qubole?

What Are G2 Users Discussing About Qubole?

RentViewer Asset Management Studio for Real Estate

RentViewer is a portfolio reporting platform built for multifamily and manufactured housing owner-operators. RentViewer connects to your property management system - Yardi, AppFolio, Entrata, or Rent Manager - and automatically delivers the dashboards and reports your asset management team needs to run a better portfolio. Many owner-operators managing 2,000 to 20,000 units are stuck in the same place: analysts spending hours rebuilding the same Excel reports every week, leadership reviewing data that's already out of date. RentViewer replaces that process with up-to-date, accurate data in one place - without requiring your team to touch a spreadsheet. Asset Management Studio is our flagship product. It gives your analysts a complete data foundation - occupancy trends, budget vs. actual, leasing performance, and more - all connected to your property management system. Most customers are fully up and running within 30 days. RentViewer is built for owner-operators with a dedicated reporting team and recurring KPI review meetings. If that's your company, we're probably a strong fit. If not, we'll tell you that upfront.

Who Is the Company Behind RentViewer Asset Management Studio for Real Estate?

  • Seller: RentViewer
  • Year Founded: 2018
  • HQ Location: Rochester Hills, US
  • LinkedIn® Page: www.linkedin.com
    3 employees on LinkedIn®

Reochart

Reochart is a web-based animated chart maker that turns raw data into polished, motion-driven visuals in under two minutes. Paste your numbers, pick from 30+ chart types, customize the design, and export as MP4, GIF, PNG, or SVG for presentations, social media posts, investor updates, newsletters, and reports. Most chart tools produce static images. Reochart animates every chart by default. Bar charts climb into place, waterfall charts step through each driver one by one, funnels narrow stage by stage, timelines animate milestones onto the line, and number counters count up to a final value. The result is a visual that holds attention in a LinkedIn feed, a live pitch, or a board deck in a way a static spreadsheet screenshot does not. The chart library covers the formats founders, marketers, consultants, and analysts actually need: bar, line, area, donut, funnel, waterfall, timeline, roadmap, 2x2 matrix, Sankey diagram, KPI scorecard, number counter, bullet chart, lollipop chart, grouped and stacked bar charts, diverging bar charts, bar chart races, pictograms, highlight tables, and more. Each chart type is purpose-built for a specific kind of story rather than a single generic engine stretched across everything. Data entry works directly in the browser. Paste from Excel or Google Sheets, edit in a built-in spreadsheet grid, or use preloaded sample data to explore a chart type before entering your own numbers. Every chart comes with a live preview that updates as you edit, so you see exactly what you are getting before you export. Design customization includes 15+ color themes across light, dark, and seasonal palettes, plus a brand kit where Pro users can upload a custom logo and set brand colors that override the default palette. Export formats cover every common destination: MP4 for presentations and social feeds, GIF for email and Slack, PNG for print and documents, SVG for any screen. Reochart also includes a library of 1,750+ animated icons with 12 animation styles, exportable in the same formats as charts. Icons are free on every plan with no usage limits. The product is built for speed and simplicity. There is no design learning curve, no blank canvas, and no video editing software required. The entire workflow from opening the editor to downloading a finished animated chart takes about two minutes. Reochart offers a free plan with 3 exports per month and a Pro plan starting at $8 per month that removes the watermark, unlocks unlimited exports, and enables brand kit features.

Who Is the Company Behind Reochart?

Bijou Barry
BB
Researched and written by Bijou Barry
Updated June 24, 2026