Obseria.io
Who Is the Company Behind Obseria.io?
- Seller: Obseria.io
- HQ Location: Angers, FR
-
LinkedIn® Page: www.linkedin.com
1 employees on LinkedIn®
Total Products under this Category: 227
Last updated: September 26, 2026
Why You Can Trust G2's Software Rankings:
G2's software rankings are built on verified user reviews, rigorous moderation, and a consistent research methodology maintained by a team of analysts and data experts. Each product is measured using the same transparent criteria, with no paid placement or vendor influence. While reviews reflect real user experiences, which can be subjective, they offer valuable insight into how software performs in the hands of professionals. Together, these inputs power the G2 Score, a standardized way to compare tools within every category.
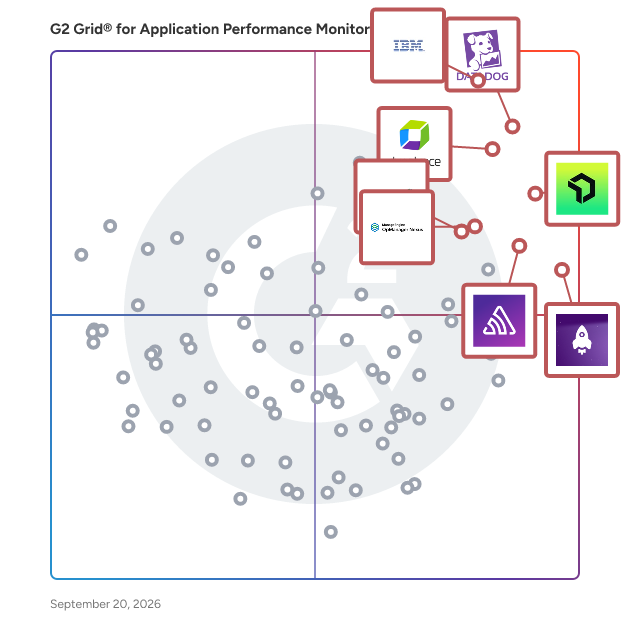
Highlighted products: IBM Instana, Datadog, Dynatrace, New Relic, LogRocket, Sentry, OpManager Nexus, and Site24x7.
Underlying data: [Grid® JSON](https://www.g2.com/categories/application-performance-monitoring-apm/grids.json?focus%5B%5D=ibm-instana&focus%5B%5D=datadog&focus%5B%5D=dynatrace&focus%5B%5D=new-relic&focus%5B%5D=logrocket&focus%5B%5D=sentry&focus%5B%5D=opmanager-nexus&focus%5B%5D=site24x7)
Observe is a modern observability platform with AI SRE, built on a context graph and data lake, for faster search and correlation at lower cost. Observe integrates logs, APM, and infrastructure monitoring into a single platform built for AI-driven investigation. Collect, analyze, and retain all your telemetry in a streaming data lake, without the cost or scale limits of other platforms. Features: - Faster troubleshooting with AI SRE: Correlate signals using natural language. Investigate issues faster with an AI SRE that surfaces root causes and suggests actionable fixes. - Unleash performance at scale with the O11y Context Graph™: Logs, metrics, and traces are structured using semantic relationships, incremental views, and token indexes so you can search faster and correlate instantly. - Scale efficiently with an open data lake: Cut observability costs by up to 60% while maximizing reuse. Store telemetry in open formats with 10x compression on low-cost cloud storage. Observe ingests all data into a data lake based on low-cost cloud storage and open standards like OpenTelemetry and Apache Iceberg, helping you resolve incidents faster, boost engineering efficiency, and scale with a dramatically lower TCO.
Average Rating: 4.8/5.0
Total Reviews: 2
"Ingest and Connect Everything"
Rating: 5.0/5.0 stars
— Jason H.
Rating: 4.5/5.0 stars
— Evan H.
Open source based observability stack featuring logs, traces and metrics – all under one roof. Observe any cloud infrastructure, VM, bare-metal servers, databases, or lambda functions with ObserveNow’s integrations available out of the box. Start observing at scale within minutes.
Simplify OpenTelemetry complexity and eliminate performance overhead with the only platform that can generate distributed tracing across all your applications without code changes.
OneAPM Application Insight is an application performance management platform.
We provide solutions to monitor technological infrastructure is crucial for the success and sustainability of any organization. As a consulting firm specializing in observability solutions, we are committed to driving positive change by helping organizations achieve excellence in their IT operations. Our mission is to empower businesses to operate at peak performance through the evaluation and implementation of top-tier monitoring tools. By optimizing costs and enhancing system performance, we not only help our clients achieve their business goals but also contribute to a more efficient and sustainable use of resources. In a world increasingly reliant on digital technology, the ability to quickly identify and resolve system issues is critical. Our solutions ensure that our clients can maintain high levels of uptime and reliability, reducing the risk of disruptions that can have far-reaching consequences. By fostering more resilient and responsive IT environments, we support the broader goal of technological innovation and stability.
Gain the end-to-end visibility your business needs in a multi-domain, multi-cloud world Get granular data and insights into the performance of network, end user and cloud solutions Identify and remediate issues across environments you don’t control directly. Understand the network performance of your connectivity to the internet Understand and monitor the performance of SaaS apps. Optimise the user experience through monitoring performance and identifying patterns for users. Elevate the customer/ employee experience as they interact with business apps Make data-driven decisions to enhance and support the business
Page Fault Monitor is a page fault viewer that monitors the activity of a program and reports all page faults associated with that program. Page Fault Monitor provides a GUI for the examination of the page fault data. Where possible, we provide DLL, symbol, filename and line number information associated with a page fault address and the number of page faults at that address. Page Fault Monitor can provide symbol information using PDB, TDS, DWARF, STABS, COFF and Metrowerks debug formats. Symbol servers are supported.
Prober is a real-time/active monitoring tool. Powered by Cloudprober, our cutting-edge monitoring solution builds on Google's open-source project. Prober ensures optimal performance and uptime for all of your applications. Prober excels in simplicity and hassle-free setup. With advanced notification support, stay ahead of issues effortlessly.
Riverbed Application Performance Monitoring (APM) is a comprehensive solution designed to provide organizations with deep visibility into their application ecosystems, ensuring optimal performance and user satisfaction. By leveraging Real User Monitoring, Synthetic Monitoring, and OpenTelemetry, Riverbed APM offers a scalable and user-friendly platform that unifies insights across end users, applications, networks, and cloud-native environments. Key Features and Functionality: - High-Definition Visibility: Gain detailed insights into containers and microservices, enabling comprehensive monitoring and observability for transactions running on modern cloud and application infrastructures, including platforms like Docker, Kubernetes, and various cloud services. - AI and Data Analytics: Utilize machine learning algorithms and intuitive queries to proactively surface insights, allowing for the swift resolution of issues before they impact business operations. - Scalability and Data Quality: Capture, store, and index billions of transactions daily without compromising data completeness or granularity, facilitating detailed incident reconstruction and immediate insight into even infrequent or intermittent issues. - Simplified DevOps Administration: Designed to align with modern DevOps requirements, Riverbed APM features lightweight, non-intrusive instrumentation that automatically discovers new code components and container instances, streamlining administration across the enterprise IT ecosystem. Primary Value and Problem Solving: Riverbed APM addresses the complexities of monitoring applications in dynamic, cloud-native environments by providing unified visibility and actionable insights. This empowers IT and DevOps teams to quickly identify and resolve performance bottlenecks, ensuring seamless digital experiences for end users and maintaining high levels of business productivity. By integrating advanced monitoring capabilities with AI-driven analytics, Riverbed APM enables organizations to proactively manage application performance, reduce downtime, and optimize resource utilization across their entire application landscape.
Alluvio AppResponse provides fast packet capture and storage that feeds intelligent network and application analysis with fast troubleshooting workflows to speed problem diagnosis and resolution. AppResponse delivers full stack application analysis—from packets to web pages - enabling you observe all network and application interactions as they cross the wire, whether they are encrypted or not. Using powerful, flexible network and application analytics and workflows, AppResponse speeds problem diagnosis and resolution, helping you get to answers fast.
Robot Monitor is comprehensive application and performance monitoring (APM) software for IBM Power environments running the IBM i (AS/400, iSeries) operating system alone or alongside Virtual I/O Server (VIOS), AIX, and/or Linux on Power partitions or virtual machines (VMs). Robot Monitor features real-time monitoring with drill-down capability for hundreds of built-in metrics, as well as nearly unlimited monitoring options using SQL-based monitoring technology giving you the insight you need into business application data, such as the number of open problems, customer orders, or stock replenishment figures. For the bigger picture, Robot Monitor dashboards make it easy to combine views across multiple systems in your network and integrate exceptions into a single list and prioritize using red/yellow/green color-coding. Robot Monitor is the most comprehensive tool for real-time monitoring on IBM Power servers. This proven technology is backed by the world-class Technical Support team at HelpSystems. A Key Part of Fortra (the new face of HelpSystems) Robot is proud to be part of Fortra’s comprehensive cybersecurity portfolio. Fortra simplifies today’s complex cybersecurity landscape by bringing complementary products together to solve problems in innovative ways. These integrated, scalable solutions address the fast-changing challenges you face in safeguarding your organization. With the help of the powerful protection from Robot Monitor and others, Fortra is your relentless ally, here for you every step of the way throughout your cybersecurity journey.
Average Rating: 4.5/5.0
Total Reviews: 1
Rating: 4.5/5.0 stars
— Verified User in Telecommunications
