Best Statistical Analysis Software - Page 7

How Many Statistical Analysis Software Products Does G2 Track?

Total Products under this Category: 114

Category Stats (Oct 2026)

  • Average Rating: 4.25/5 The average rating of products in this category, based on all submitted ratings
  • Top Trending Product: Rapidminer SLC (+0.61%) - Among all products in this category, Rapidminer SLC recorded the largest rating increase compared to last month

Last updated: October 19, 2026

How Does G2 Rank Statistical Analysis Software Products?

Why You Can Trust G2's Software Rankings:

  • 30 Analysts and Data Experts
  • 8,000+ Authentic Reviews
  • 114+ Products
  • Unbiased Rankings

G2's software rankings are built on verified user reviews, rigorous moderation, and a consistent research methodology maintained by a team of analysts and data experts. Each product is measured using the same transparent criteria, with no paid placement or vendor influence. While reviews reflect real user experiences, which can be subjective, they offer valuable insight into how software performs in the hands of professionals. Together, these inputs power the G2 Score, a standardized way to compare tools within every category.

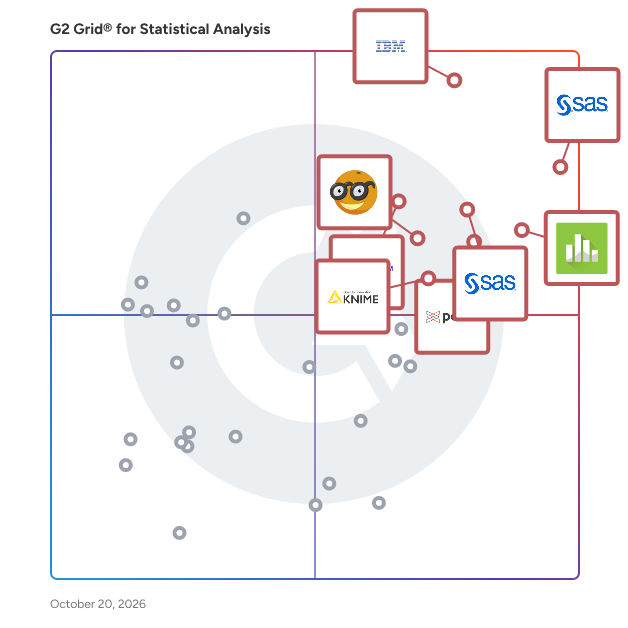
G2 Grid® for Statistical Analysis Software

G2 Grid® for Statistical Analysis Software plotting products by satisfaction and market presence

Highlighted products: SAS Viya, IBM SPSS Statistics, Minitab Statistical Software, Base SAS, Posit Team, Qualtrics Market Research, Orange, and KNIME.

Underlying data: [Grid® JSON](https://www.g2.com/categories/statistical-analysis/grids.json?focus%5B%5D=sas-sas-viya&focus%5B%5D=ibm-spss-statistics&focus%5B%5D=minitab-statistical-software&focus%5B%5D=base-sas&focus%5B%5D=posit-team&focus%5B%5D=qualtrics-market-research&focus%5B%5D=orange&focus%5B%5D=knime-analytics-platform)

Mastercard Test & Learn

Test, analyze, optimize Whether it’s a store remodel or a loyalty offer, Test & Learn® empowers business leaders to improve new and existing initiatives by designing and analyzing in-market business experiments. By using our analytics platform, businesses can understand the overall incremental impact of an initiative, the most effective aspects of the initiative, the types of customers or markets that respond best, and how to target rollout to maximize ROI.

Who Is the Company Behind Mastercard Test & Learn?

  • Seller: Mastercard
  • Year Founded: 1966
  • HQ Location: Purchase, NY
  • Twitter: @Mastercard
    491,448 Twitter followers
  • LinkedIn® Page: www.linkedin.com
    52,021 employees on LinkedIn®
  • Ownership: NYSE - New York Stock Exchange

mathematical calculator

The online computing network provides algebraic calculation, integral and differential calculus, mathematical statistics, matrix, digital calculation, geometric calculation, plane geometry, solid geometry, area and perimeter, trigonometry, volume calculation, analytic geometry, conversion calculation, unit conversion, date and time, color conversion, base conversion, physical calculation, classical physics, electronic circuits, web tools, Html tools, and health calculators.

Who Is the Company Behind mathematical calculator?

Minitab DOE by Effex

Minitab DOE by Effex is an advanced, cloud-based design of experiments (DOE) solution that helps organizations optimize processes, accelerate innovation, and gain deeper insights with fewer experimental runs. Powered by proprietary OMARS® designs, AI-driven model selection, and a comprehensive DOE design catalog, it enables users to efficiently explore complex relationships, build more accurate predictive models, and identify optimal settings across multiple variables. Accessed through the Minitab Solution Center, Minitab DOE by Effex provides a centralized, collaborative environment where teams can design, analyze, and refine experiments from anywhere. By combining advanced DOE capabilities with an intuitive interface, it helps organizations reduce development time, improve product and process quality, and make faster, data-driven decisions with confidence.

Who Is the Company Behind Minitab DOE by Effex?

  • Seller: Minitab
  • Year Founded: 1972
  • HQ Location: State College, Pennsylvania, United States
  • Twitter: @Minitab
    5,017 Twitter followers
  • LinkedIn® Page: www.linkedin.com
    732 employees on LinkedIn®

AI can help you find the answers. G2 helps you trust them.

Connect G2 to Claude or ChatGPT for answers grounded in G2's trusted reviews, comparisons, and pricing from real user insights.

How it works

NWA Quality Analyst

NWA Quality Analyst® is an award winning SPC charting and analysis software solution providing the best combination of power, flexibility, and ease-of-use of any SPC software available. It enables a wide range of users to graphically analyze process behavior and judge the impact of process improvement decisions with minimal training in statistical techniques.

Average Rating: 4.5/5.0

Total Reviews: 1

Who Is the Company Behind NWA Quality Analyst?

Who Uses This Product?

  • Company Size: 100% Large

What Are Recent G2 Reviews of NWA Quality Analyst?

What Are G2 Users Discussing About NWA Quality Analyst?

PASS

Who Is the Company Behind PASS?

Predictive Suite

Predictive Suite is a computational intelligence software for data mining analysis and predictive modeling.

Who Is the Company Behind Predictive Suite?

QC-CALC SPC

QC-CALC SPC is a complete SPC package that analyzes the data collected by QC-CALC Real-Time. Use QC-CALC SPC’s charts and reports to constantly monitor your process and keep it in control.

Who Is the Company Behind QC-CALC SPC?

Q-DAS qs-STAT

Who Is the Company Behind Q-DAS qs-STAT?

  • Seller: avvir
  • Year Founded: 2017
  • HQ Location: New York City, US
  • Twitter: @Avvir_io
    154 Twitter followers
  • LinkedIn® Page: www.linkedin.com
    4 employees on LinkedIn®

R++

Who Is the Company Behind R++?

  • Seller: R++
  • Year Founded: 2016
  • HQ Location: Toulouse, FR
  • LinkedIn® Page: www.linkedin.com
    7 employees on LinkedIn®

RocketML Sparse Logistic Regression

RocketML Sparse Logistic Regression is a high-performance machine learning algorithm designed for binary classification tasks on sparse datasets, such as those in LibSVM format. It enables efficient model training without the need to convert data into other formats, streamlining the workflow for data scientists and engineers. Key Features and Functionality: - Efficient Handling of Sparse Data: Optimized for processing sparse datasets like LibSVM without requiring data format conversion. - Scalable Performance: Utilizes multi-core processing to scale efficiently on a single AWS EC2 instance, enhancing computational speed and resource utilization. - Seamless Integration: Compatible with existing AWS infrastructure, facilitating easy deployment and integration into machine learning pipelines. Primary Value and User Benefits: RocketML Sparse Logistic Regression addresses the challenges of training machine learning models on large, sparse datasets by offering a solution that is both time-efficient and cost-effective. By eliminating the need for data format conversion and leveraging multi-core processing, it significantly reduces training times, allowing data scientists to focus more on model development and less on data preprocessing. This leads to faster insights and more agile decision-making processes.

Who Is the Company Behind RocketML Sparse Logistic Regression?

  • Seller: RocketML
  • Year Founded: 2017
  • HQ Location: Beaverton, US
  • LinkedIn® Page: www.linkedin.com
    6 employees on LinkedIn®

RSD Calculator

RSD Calculator is a free online statistics tool that helps users calculate Relative Standard Deviation, coefficient of variation, standard deviation, variance, mean, range, sum, minimum, and maximum values. The tool supports both sample and population calculations, making it useful for students, teachers, scientists, analysts, laboratories, pharmaceutical analysis, quality control, finance, and research work. It explains RSD formulas, RSD vs CV, data quality thresholds, and common use cases for comparing variability across datasets.

Who Is the Company Behind RSD Calculator?

SQCpack by PQ Systems

SQCpack is a robust Statistical Process Control (SPC) application that will help to analyze, understand, improve, and communicate about quality processes

Average Rating: 4.3/5.0

Total Reviews: 3

Who Is the Company Behind SQCpack by PQ Systems?

  • Seller: Advantive
  • Year Founded: 2022
  • HQ Location: Tampa, FL
  • Twitter: @Advantive_
    55 Twitter followers
  • LinkedIn® Page: www.linkedin.com
    724 employees on LinkedIn®

Who Uses This Product?

  • Company Size: 67% Medium, 33% Large

What Are Recent G2 Reviews of SQCpack by PQ Systems?

Bijou Barry
BB
Researched and written by Bijou Barry
Updated March 3, 2025