miniDBA Desktop
Stand alone Application
Who Is the Company Behind miniDBA Desktop?
- Seller: miniDBA
- Year Founded: 2012
- HQ Location: N/A
-
LinkedIn® Page: www.linkedin.com
1 employees on LinkedIn®
Total Products under this Category: 116
Last updated: September 08, 2026
Why You Can Trust G2's Software Rankings:
G2's software rankings are built on verified user reviews, rigorous moderation, and a consistent research methodology maintained by a team of analysts and data experts. Each product is measured using the same transparent criteria, with no paid placement or vendor influence. While reviews reflect real user experiences, which can be subjective, they offer valuable insight into how software performs in the hands of professionals. Together, these inputs power the G2 Score, a standardized way to compare tools within every category.
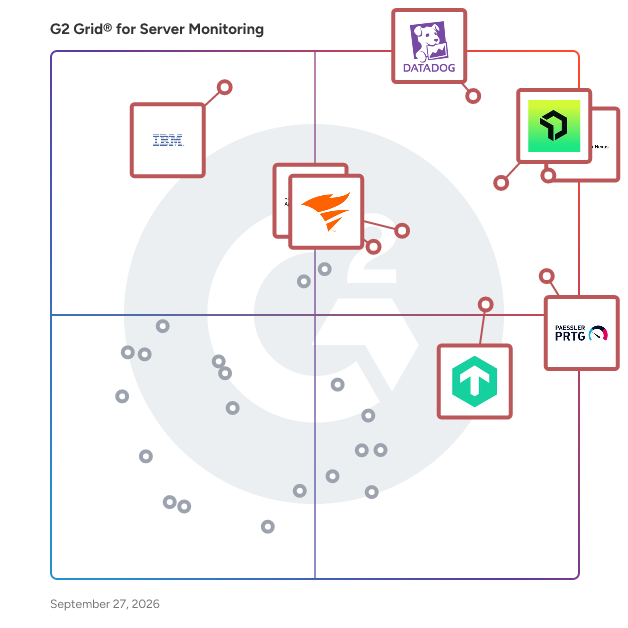
Highlighted products: Datadog, OpManager Nexus, New Relic, Paessler PRTG, Checkmk, SolarWinds Observability, IBM Instana, and ManageEngine Applications Manager.
Underlying data: [Grid® JSON](https://www.g2.com/categories/server-monitoring/grids.json?focus%5B%5D=datadog&focus%5B%5D=opmanager-nexus&focus%5B%5D=new-relic&focus%5B%5D=paessler-prtg&focus%5B%5D=checkmk&focus%5B%5D=solarwinds-worldwide-llc-solarwinds-observability&focus%5B%5D=ibm-instana&focus%5B%5D=manageengine-applications-manager)
Stand alone Application
miniDBA provides a way to monitor and performance tune SQL Servers on the market.
Monitor Free is a VPS monitoring tool offering real-time server metrics and remote management. It updates CPU, memory, disk, load, and network data every 15 seconds. Beyond dashboards, it supports service restarts, process termination, server reboots, log inspection, and SSH user creation directly from the app. Features include a live heartbeat view, network monitoring with port-change alerts, and file watching for critical paths. A root-cause alert timeline consolidates metrics and events, while daily SMART disk checks detect failing drives early. External uptime monitoring covers HTTP, TCP, SSL, and domain expiry, with shareable status pages. Monitor Free integrates an SSH terminal and SFTP browser for file management. Team-sharing features include permission controls for collaboration. Supporting Linux and Windows agents, it installs in under 10 seconds and logs all actions for audits. Alerts are sent via email, Telegram, Slack, and webhooks.
NiTO is an all-in-one IT infrastructure monitoring solution that empowers you to identify and address issues before they become recurring problems. With NiTO you can monitor your entire infrastructure with increased security, minimal configuration, and unmatched real-time detail. Our dashboards provide you with near-time actionable insights and data retention from 24 hours up to 90 days to make it easier to investigate issues in your network. To make sure you never miss an occurrence, you can set alarms to notify you based on severity of the issue by email, phone or SMS.
Infrastructure and endpoint monitoring made easy!
Server & Website Monitoring Made Easy Reliable, real-time monitoring solutions for servers, websites, networks, blacklists and cron jobs. Stay ahead with comprehensive alerts, performance insights, and global monitoring coverage to ensure your systems are always running smoothly.
A Key Part of Fortra (the new face of HelpSystems) Robot is proud to be part of Fortra’s comprehensive cybersecurity portfolio. Fortra simplifies today’s complex cybersecurity landscape by bringing complementary products together to solve problems in innovative ways. These integrated, scalable solutions address the fast-changing challenges you face in safeguarding your organization. With the help of the powerful protection from Robot Network and others, Fortra is your relentless ally, here for you every step of the way throughout your cybersecurity journey.
Sedai goes beyond recommendations. Our platform takes action to autonomously manage and optimize your cloud resources, without manual intervention. It analyzes your production environment to find cost and reliability optimization opportunities in real time — learning from behavior patterns and adapting to new releases. Under the hood, Sedai uses deep reinforcement learning to predict the impact of potential optimizations, enabling the platform to take these actions safely. Sedai's unique approach makes it the only way way to manage and optimize the cloud at scale. Unlike conventional automation, Sedai doesn't follow fixed rules and scripts. Instead, it acts like an experienced SRE: incrementally adjusting the configuration of your resources until the exact point where performance or availability would be impacted. The result? Sedai has executed more than 25 million autonomous actions in production — with 0 incidents. Ready to save 30–50% on your cloud costs? Visit sedai.io to speak with our cloud optimization experts.
Average Rating: 4.5/5.0
Total Reviews: 4
Rating: 4.5/5.0 stars
— dianelys H.
"Easily integrates various monitoring tools available in the environment!"
Rating: 5.0/5.0 stars
— Mindy J.
ServerMonitor is a lightweight server monitoring and remote management app for developers and system administrators. Monitor CPU, memory, disk, and network usage in real time, manage Docker containers, and access servers securely through SSH, all from a simple and modern interface.
ServicePilot is a comprehensive, intelligent observability platform designed to help organizations maintain high‑performing, resilient IT environments. By unifying metrics, traces, logs and topology insights into a single, cohesive solution, ServicePilot enables IT teams to detect issues earlier, troubleshoot faster and prevent outages before they impact users or business operations. Its mission is simple: deliver full‑stack visibility that empowers organizations to ensure the continuity, reliability and performance of their digital services. Modern IT environments are increasingly complex, spanning on‑premise infrastructure, hybrid architectures, cloud‑native applications and legacy systems that still play a critical role. ServicePilot brings clarity to this complexity by consolidating monitoring across: - Servers - Networks - Applications - Websites - Databases - Telephony systems - Mainframes - IT and IoT infrastructure - And more. This unified approach eliminates operational silos and provides a single source of truth for IT operations, DevOps and SRE teams. At the core of the platform is an intelligent analytics engine that correlates data from every layer of the stack. By combining real‑time telemetry with automated detection, dynamic dashboards and contextual insights, ServicePilot helps teams quickly identify root causes, reduce mean time to resolution and optimize performance. Whether the challenge is application latency, network degradation, infrastructure saturation, or service disruptions, ServicePilot equips teams with the visibility and intelligence needed to act decisively. Beyond monitoring, ServicePilot delivers a scalable observability foundation that grows with the organization. Its extensive library of integrations, customizable dashboards and automated discovery capabilities make it easy to adapt to evolving architectures and emerging technologies. With a focus on simplicity, speed and actionable insights, ServicePilot helps IT teams shift from reactive firefighting to proactive service assurance. ServicePilot continues to innovate to meet the demands of modern IT operations, offering a powerful, unified platform that strengthens reliability, improves user experience and supports long‑term digital transformation. ServicePilot is available in both SaaS and On‑Premise deployment models, offering flexibility for organizations with diverse operational, regulatory, or security requirements. Enterprises, government agencies and managed service providers rely on ServicePilot to support mission‑critical environments where uptime, performance and compliance are non‑negotiable.
SimpleObservability is an all-in-one infrastructure monitoring platform. Monitor servers, services, logs, cron jobs, endpoints, and more from a single dashboard. Instead of stitching together several monitoring tools or spending hours configuring a complex platform, SimpleObservability comes with sensible defaults and a clean web interface ready to use from the start. Install it, connect your infrastructure, and start monitoring in seconds.
sMonitor is a powerful network monitoring application for verifying the connectivity of your networked devices to both the LAN and the network. The server uptime monitor is a client-side service.
SysKit Monitor will enable you to monitor user activity, application usage, server performance, and much more. It is an easy to use comprehensive tool that will make your administration tasks far easier. For additional product details or to request a product demo, contact the vendor directly. SysKit Monitor enables users to monitor and administer server environment. It’s an agentless enterprise solution which helps users monitor server performance, track user activity, analyze application usage, document environment, and more. Additionally, it enables users to manage servers remotely with the help of PowerShell, serving as GUI for PowerShell reporting. SysKit Monitors comes with a quick installation containing built-in prerequisites, and its available as a desktop and web interface. Benefits: Track user activity and RDS logging on your servers Analyze application usage for locally used and published applications Monitor all existing services and performance counters and in real-time and historically Document IT assets and server configurations. Compare them over time and different servers Audit security events and automatically block potential threats Remotely manage your servers with PowerShell GUI and advanced scripting features Receive intelligent real-time alerts for all events in your environment Keep track of and enforce critical license compliance requirements
onTune is a System Performance Surveillance Solution. Unlike conventional Server Monitoring Solutions, onTune’s System Performance Surveillance Solution, records system performance metrics from each and every process without selection or configuration of processes. More surprisingly, onTune performs at two seconds collection interval without compromising system performance at all by using less than 1% of system resources. Now, system administrators can finish the day on time as onTune tells what the problems are.
