Best Embedded Business Intelligence Software - Page 7

How Many Embedded Business Intelligence Software Products Does G2 Track?

Total Products under this Category: 177

Category Stats (Oct 2026)

  • Average Rating: 4.45/5 (↑0.01 vs Sep 2026) The average rating of products in this category, based on all submitted ratings
  • Top Trending Product: Cube (+2.46%) - Among all products in this category, Cube recorded the largest rating increase compared to last month

Last updated: October 20, 2026

How Does G2 Rank Embedded Business Intelligence Software Products?

Why You Can Trust G2's Software Rankings:

  • 30 Analysts and Data Experts
  • 18,700+ Authentic Reviews
  • 177+ Products
  • Unbiased Rankings

G2's software rankings are built on verified user reviews, rigorous moderation, and a consistent research methodology maintained by a team of analysts and data experts. Each product is measured using the same transparent criteria, with no paid placement or vendor influence. While reviews reflect real user experiences, which can be subjective, they offer valuable insight into how software performs in the hands of professionals. Together, these inputs power the G2 Score, a standardized way to compare tools within every category.

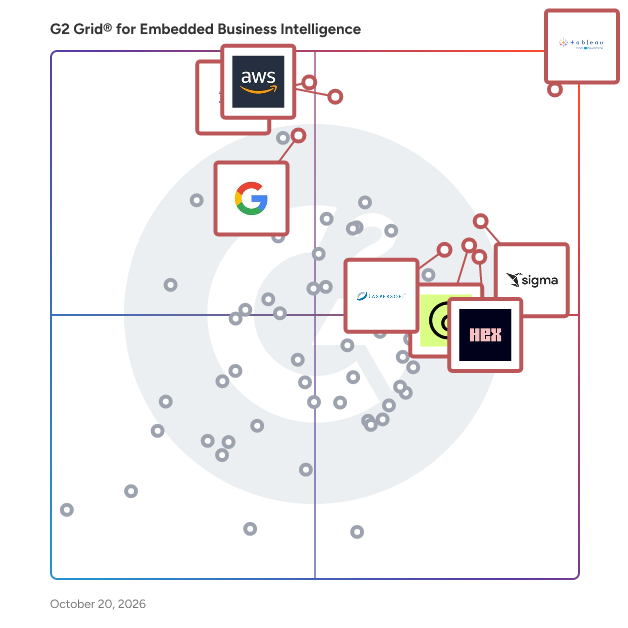
G2 Grid® for Embedded Business Intelligence Software

G2 Grid® for Embedded Business Intelligence Software plotting products by satisfaction and market presence

Highlighted products: Tableau, Sigma, Amazon Quick, IBM Cognos Analytics, Hex, GoodData.AI, Jaspersoft, and Google Chart Tools.

Underlying data: [Grid® JSON](https://www.g2.com/categories/embedded-business-intelligence/grids.json?focus%5B%5D=tableau&focus%5B%5D=sigma-computing-sigma&focus%5B%5D=amazon-quick&focus%5B%5D=ibm-cognos-analytics&focus%5B%5D=hex-tech-hex&focus%5B%5D=gooddata-ai&focus%5B%5D=jaspersoft&focus%5B%5D=google-chart-tools)

Lumenore

Lumenore helps businesses turn data into actionable business intelligence with the power of AI, natural language querying, and predictive analytics. With industry-specific solutions embedded in a powerful BI platform, Lumenore turns your raw data into accurate insights. Ensure seamless data integration, enable modern business storytelling, and encourage advanced insight discovery. Create an all-in-one data universe for effective decision-making across business functions with Lumenore.

Average Rating: 4.5/5.0

Total Reviews: 2

How Do G2 Users Rate Lumenore?

  • Has the product been a good partner in doing business?: 8.3/10 (Category avg: 9.0/10)
  • Steps to Answer: 6.7/10 (Category avg: 8.3/10)
  • Reports Interface: 10.0/10 (Category avg: 8.8/10)
  • Calculated Fields: 8.3/10 (Category avg: 8.6/10)

Who Is the Company Behind Lumenore?

  • Seller: Netlink
  • Year Founded: 2013
  • HQ Location: Madison Heights, US
  • LinkedIn® Page: www.linkedin.com
    74 employees on LinkedIn®

Who Uses This Product?

  • Company Size: 50% Medium, 50% Small

What Are Lumenore's Pros and Cons?

Pros
  • Analytics (1 reviews)
  • Data Analysis (1 reviews)
  • Data Visualization (1 reviews)
  • Ease of Use (1 reviews)
  • Easy Integrations (1 reviews)
Cons
  • Poor UI (1 reviews)

What Are Recent G2 Reviews of Lumenore?

Observable

Observable is a data analysis and exploration platform that helps data analysts and their stakeholders understand their business data, build charts and other visualizations, and communicate insights. Built for teams, powered by AI, and backed by a global community of data practitioners, Observable offers a single workspace for data exploration, custom chart creation, and cross-functional data collaboration. Observable's collaborative whiteboard for data analysis, Observable Canvases, helps analysts with exploratory data analysis, advanced chart creation, and data storytelling. It makes the data analysis process more streamlined by bringing querying, chart creation, and sharing all in one platform. Users can choose between code, UI, or AI, and easily move between all three depending on the task at hand. The AI is also deeply integrated and turnkey, operating transparently on the canvas to allow users to understand, interpret, and fine-tune its results and reasoning, building trust in its recommendations. Additionally, whiteboarding features like comments, illustrations, and annotations help bring stakeholders into the data analysis process to reduce frustrating back-and-forths. Sophisticated data visualizations such as beeswarms, Sankey diagrams, choropleths, and more are available out-of-the-box to enable users to easily create and share expressive, interactive charts. Users can embed charts in internal apps, and generate polished, stakeholder-friendly dashboards in just a few clicks.

Average Rating: 4.4/5.0

Total Reviews: 4

How Do G2 Users Rate Observable?

  • Has the product been a good partner in doing business?: 10.0/10 (Category avg: 9.0/10)
  • Steps to Answer: 8.3/10 (Category avg: 8.3/10)
  • Reports Interface: 8.3/10 (Category avg: 8.8/10)
  • Calculated Fields: 6.7/10 (Category avg: 8.6/10)

Who Is the Company Behind Observable?

  • Seller: Observable
  • Year Founded: 2017
  • HQ Location: San Francisco, US
  • Twitter: @observablehq
    25,314 Twitter followers
  • LinkedIn® Page: www.linkedin.com
    23 employees on LinkedIn®

Who Uses This Product?

  • Company Size: 50% Small, 25% Large

What Do G2 Reviewers Say About Observable?

AI-generated summary from verified user reviews

Pros
  • Users value the seamless data exploration and beautiful visual output offered by Observable's charting features.
  • Users appreciate the real-time collaboration features of Observable, enhancing teamwork and data exploration effortlessly.
  • Users love the seamless data visualization features of Observable, enhancing their exploration and collaboration experience.
  • Users love the beautiful visual output of Observable, making data sharing and embedding effortless and appealing.
  • Users enjoy the ease of use of Observable, allowing for seamless data exploration and effortless coding.
Cons
  • Users find Observable can feel browser-heavy with large data sets, impacting performance and usability.
  • Users find the software browser-heavy with large data sets, impacting performance and usability for complex applications.
  • Users find that Observable can be slow performing with large data sets or complex applications, impacting usability.

What Are Recent G2 Reviews of Observable?

Rill Cloud

Rill is an operational BI tool that provides fast dashboards that your team will actually use. Data teams build fewer, more flexible dashboards for business users, while business users make faster decisions and perform root cause analysis, with fewer ad hoc requests. Rill’s unique architecture combines a last-mile ETL service, an in-memory database, and operational dashboards - all in a single solution. Our customers are leading media & advertising platforms, including Comcast's Freewheel, tvScientific, AT&T's DishTV, and more.

Average Rating: 4.3/5.0

Total Reviews: 2

How Do G2 Users Rate Rill Cloud?

  • Steps to Answer: 10.0/10 (Category avg: 8.3/10)
  • Reports Interface: 10.0/10 (Category avg: 8.8/10)
  • Calculated Fields: 8.3/10 (Category avg: 8.6/10)

Who Is the Company Behind Rill Cloud?

  • Seller: Rill Data
  • Year Founded: 2020
  • HQ Location: San Francisco, US
  • Twitter: @RillData
    1,989 Twitter followers
  • LinkedIn® Page: www.linkedin.com
    30 employees on LinkedIn®

Who Uses This Product?

  • Company Size: 50% Large, 50% Medium

What Do G2 Reviewers Say About Rill Cloud?

AI-generated summary from verified user reviews

Pros
  • Users find Rill Cloud's ease of use to be a game changer, facilitating quick and efficient implementations.
  • Users find implementation easy with Rill Cloud, enabling swift integration and effective utilization across teams.
  • Users appreciate the extensive customization options of Rill Cloud, enhancing efficiency and meeting diverse team needs effectively.
  • Users value the customizable dashboard of Rill Cloud, enhancing efficiency and tailoring the interface to their needs.
  • Users appreciate the easy access of Rill Cloud, allowing effective task completion from any location.
Cons
  • Users are frustrated by access restrictions that limit customization and require constant internet connectivity, affecting user experience.
  • Users find the complexity of Rill Cloud initially overwhelming, though it becomes easier with familiarity.
  • Users find the initial complexity of Rill Cloud overwhelming, though it becomes easier with time and use.
  • Users find limited customization options frustrating, wishing for more flexible features to suit their needs.

What Are Recent G2 Reviews of Rill Cloud?

AI can help you find the answers. G2 helps you trust them.

Connect G2 to Claude or ChatGPT for answers grounded in G2's trusted reviews, comparisons, and pricing from real user insights.

How it works

Supaboard

Supaboard delivers enterprise-grade AI data analysts purpose-built to understand the complexity of your business: your data models, metrics definitions, organizational structure, and decision-making workflows. Rather than relying on traditional BI tools that require dedicated analyst teams to operationalize, Supaboard's trainable domain-specific agents continuously monitor activity across your data estate, proactively surface material changes in performance, diagnose root causes with full analytical context, and recommend the next-best action aligned to your strategic priorities. Built to integrate with your existing data infrastructure across 600+ sources and designed for governance, security, and scale, Supaboard enables leaders across finance, operations, product, and revenue functions to move from reactive reporting to proactive, data-driven decisioning—shortening the path from question to insight to outcome.

Average Rating: 4.8/5.0

Total Reviews: 3

How Do G2 Users Rate Supaboard?

  • Steps to Answer: 5.0/10 (Category avg: 8.3/10)
  • Reports Interface: 8.3/10 (Category avg: 8.8/10)

Who Is the Company Behind Supaboard?

  • Seller: Supaboard
  • Year Founded: 2023
  • HQ Location: San Francisco, US
  • LinkedIn® Page: www.linkedin.com
    8 employees on LinkedIn®

Who Uses This Product?

  • Company Size: 100% Small

What Are Recent G2 Reviews of Supaboard?

ALLOS

ALLOS is an enterprise data operations platform that connects Excel and Word to live enterprise data to support governed reporting, analysis, and document generation. It provides a centralized architecture for accessing, preparing, and using data inside Microsoft Office tools while maintaining security, traceability, and compliance within the organization’s infrastructure. ALLOS is used by finance teams, operational analysts, controllers, and IT departments that rely heavily on Excel and Word for recurring reporting and decision-making. It is designed for organizations where core systems such as ERP platforms, databases, and APIs are tightly governed, but day-to-day reporting and analysis still happen in spreadsheets. This environment often creates challenges such as duplicated calculations, inconsistent definitions, manual consolidation, and data governance risk. The platform introduces controlled access to live enterprise data and standardizes how calculations, filters, and queries are defined and executed. Excel and Word function as user interfaces, while all execution, validation, and logic run through the ALLOS platform inside the customer’s environment. This allows users to work with familiar tools while ensuring that data quality, permissions, and logic are centrally managed. Key capabilities include: Secure Connect: governed access to systems such as SAP, SQL databases, and APIs, including controlled read and write operations. Formulas & Reporting: a formula engine that retrieves governed results into Excel without exporting transactional datasets or duplicating data. Document Generation: automated creation of Word, Excel, and PDF documents using templates linked to live, traceable data sources. Intelligence: optional AI-assisted querying that converts user intent into approved formulas without exposing data to external AI systems. ALLOS is designed for organizations that require flexibility in Excel and Word but must also maintain control over data access and logic. The platform ensures that every value retrieved into a report is traceable to its origin, and every document generated follows consistent rules and definitions. IT teams maintain governance through centrally defined permissions, while business users gain efficient, repeatable reporting processes. Typical use cases include financial reporting, month-end close, management analysis, operational reporting, project documentation, compliance documentation, data validation, and controlled write-back tasks such as postings or corrections in connected systems. ALLOS allows organizations to continue using Excel and Word while introducing the structure and governance normally associated with enterprise platforms, reducing manual effort and ensuring consistency across reporting and documentation.

Average Rating: 5.0/5.0

Total Reviews: 2

How Do G2 Users Rate ALLOS?

  • Reports Interface: 8.3/10 (Category avg: 8.8/10)
  • Calculated Fields: 8.3/10 (Category avg: 8.6/10)

Who Is the Company Behind ALLOS?

Who Uses This Product?

  • Company Size: 100% Small

What Are Recent G2 Reviews of ALLOS?

AnyMap JS Maps

AnyMap JS Maps is an advanced JavaScript/HTML5 charting library, which makes you able to easily create interactive maps that look great on PCs, Macs, iPhones, iPads, Androids and other devices - on any platform and in any browser. AnyMap JS is perfect for interactive dashboards and side-by-side reporting. You can use it to display sales by region, election results, weather forecast, population density, and any other geo-related data. Available map chart types: Choropleth, Flow, Connector, Dot (Point), and Bubble. Fully compatible w/ AnyChart, AnyStock, and AnyGantt JS libraries.

Average Rating: 4.4/5.0

Total Reviews: 5

How Do G2 Users Rate AnyMap JS Maps?

  • Has the product been a good partner in doing business?: 6.7/10 (Category avg: 9.0/10)
  • Steps to Answer: 8.3/10 (Category avg: 8.3/10)
  • Reports Interface: 10.0/10 (Category avg: 8.8/10)
  • Calculated Fields: 8.3/10 (Category avg: 8.6/10)

Who Is the Company Behind AnyMap JS Maps?

  • Seller: AnyChart
  • Year Founded: 2003
  • HQ Location: Saint Augustine, FL
  • Twitter: @AnyChart
    6,364 Twitter followers
  • LinkedIn® Page: www.linkedin.com
    14 employees on LinkedIn®
  • Phone: 1(888) 845-1211

Who Uses This Product?

  • Company Size: 80% Small, 20% Large

What Are Recent G2 Reviews of AnyMap JS Maps?

What Are G2 Users Discussing About AnyMap JS Maps?

Chata

Chata provides an in-the-moment decision intelligence solution to enterprises and their users. Through our AI, enterprises can eliminate reporting and analytical learning curves for users, and get fast, painless implementation and adoption. When every user has direct access to detailed information from their data warehouse there is less demand on the IT & data analyst teams and more data-driven decision-making across the entire organization. Learn more at www.chata.ai.

Average Rating: 3.0/5.0

Total Reviews: 1

Who Is the Company Behind Chata?

Who Uses This Product?

  • Company Size: 100% Small

CVEDIA

CVEDIA is a leader in AI‑powered video analytics and computer vision solutions that turn raw video into actionable intelligence for security, operations, and analytics applications. Unlike many vendors that rely on off‑the‑shelf models, CVEDIA controls the full AI pipeline, from synthetic data generation and model training to deployment and continuous improvement, enabling high accuracy and robust performance even in real‑world conditions where traditional approaches often fail. At the core of CVEDIA’s technology is CVEDIA‑RT, a modular, cross‑platform AI inference engine designed for production deployment across edge devices, servers, and cloud environments. It supports a wide range of use cases including intrusion and perimeter security, object counting, crowd estimation, anomaly detection, traffic flow analysis, and more, with low false positives and real‑time responsiveness that organizations rely on. One of the key differentiators for CVEDIA is its use of proprietary synthetic data, which eliminates the traditional bottleneck of collecting and labeling real‑world datasets. Synthetic data allows the company to generate edge‑case scenarios that are difficult or impossible to capture in reality, resulting in AI models that generalize better, deploy faster, and adapt more reliably across environments. CVEDIA’s technology is hardware‑agnostic and scalable, optimized for everything from low‑power edge devices to enterprise GPU and VPU platforms. Native integrations include plugins for leading video management systems such as Milestone XProtect and Nx Witness, allowing organizations to augment their existing surveillance infrastructure with advanced analytics without requiring costly hardware upgrades. In addition to software solutions, CVEDIA offers turnkey appliances like the CVEDIA AI HUB‑8, a pre‑configured smart camera hub that combines VMS and AI analytics in one box. This appliance supports real‑time detection and alerting for people, vehicles, and other objects with no cloud dependency and no subscription fees, making it ideal for small‑to‑medium deployments where simplicity and cost efficiency matter. The company’s solutions are deployed across a broad spectrum of industries, including physical security, smart cities, transportation, defense, and enterprise environments. CVEDIA’s performance‑proven analytics are especially valued where reliability and accuracy are critical, such as in perimeter breach detection or large‑scale monitoring operations. CVEDIA’s commitment to integration and performance has also led to strategic partnerships with industry leaders in AI hardware and edge computing. Collaborations with companies like Blaize and DeepX have extended the reach of CVEDIA’s analytics to optimized inference platforms, making advanced video intelligence more accessible and cost‑effective at the edge. Beyond technology, customers appreciate CVEDIA’s deployment simplicity and flexibility. Solutions often install and configure in minutes rather than months, and analytics can run on existing camera infrastructure, significantly reducing total cost of ownership. Licensing options are designed to be customer‑friendly, with both subscription and perpetual models available to suit different deployment strategies. Headquartered in Singapore, with a global presence and partnerships spanning hardware OEMs, systems integrators, and AI platform vendors, CVEDIA continues to push the frontier of video analytics, delivering real‑time intelligence that enhances security, drives operational insights, and unlocks new value from visual data.

Average Rating: 4.0/5.0

Total Reviews: 3

Who Is the Company Behind CVEDIA?

  • Seller: CVEDIA
  • Year Founded: 2016
  • HQ Location: Singapore, SG
  • LinkedIn® Page: www.linkedin.com
    21 employees on LinkedIn®

Who Uses This Product?

  • Company Size: 100% Medium

What Do G2 Reviewers Say About CVEDIA?

AI-generated summary from verified user reviews

Pros
  • Users find CVEDIA's AI technology invaluable for quickly developing effective computer vision algorithms with limited real-world data.
Cons
  • Users find the lack of customization in CVEDIA limiting, restricting ability to tailor algorithms to specific needs.
  • Users find the limited customization in CVEDIA restricts their ability to tailor algorithms effectively for their needs.

What Are Recent G2 Reviews of CVEDIA?

Datazip

Discover Datazip, a comprehensive no-code data engineering solution designed for time-conscious analysts and operators. Simplify your data management process by consolidating dispersed data sources, utilizing ETL, data warehousing, and transformation capabilities. With Datazip's intuitive platform, create a dependable, scalable data infrastructure in a mere 45 minutes. Experience swift data connections, robust querying, and smooth exporting to drive insightful decision-making.

Average Rating: 4.7/5.0

Total Reviews: 13

How Do G2 Users Rate Datazip?

  • Has the product been a good partner in doing business?: 9.4/10 (Category avg: 9.0/10)
  • Steps to Answer: 9.2/10 (Category avg: 8.3/10)
  • Reports Interface: 10.0/10 (Category avg: 8.8/10)
  • Calculated Fields: 10.0/10 (Category avg: 8.6/10)

Who Is the Company Behind Datazip?

Who Uses This Product?

  • Company Size: 46% Small, 31% Medium

What Are Recent G2 Reviews of Datazip?

Diver Platform

Dimensional Insight’s Diver Platform is a governed analytics and business intelligence platform that helps organizations turn complex data into trusted, actionable insights and build a reliable foundation for AI-driven decision-making. Designed for industries where accuracy, consistency, and accountability matter, Diver Platform combines data integration, business rules management, analytics, reporting, and self-service exploration in a single environment. Organizations use Diver Platform to connect disparate data sources, standardize definitions and metrics, and deliver secure, role-based access to analytics across teams. Unlike many BI tools that focus primarily on visualization, Diver Platform emphasizes data governance, validation, and explainability — helping organizations trust the numbers behind every decision. The platform supports operational, financial, and strategic analytics and integrates with modern cloud and on-premises data environments including SQL Server, Snowflake, and Databricks. Used across healthcare, manufacturing, distribution, finance, beverage alcohol, and other data-intensive industries, Dimensional Insight helps organizations reduce reporting complexity, improve decision-making, and create trusted, consistent data foundations for enterprise analytics and AI initiatives.

Average Rating: 4.7/5.0

Total Reviews: 3

How Do G2 Users Rate Diver Platform?

  • Reports Interface: 10.0/10 (Category avg: 8.8/10)

Who Is the Company Behind Diver Platform?

  • Seller: Dimensional Insight
  • Company Website:
  • Year Founded: 1989
  • HQ Location: Burlington, US
  • Twitter: @DI_tweet
    3,512 Twitter followers
  • LinkedIn® Page: www.linkedin.com
    77 employees on LinkedIn®

Who Uses This Product?

  • Company Size: 67% Large, 33% Medium

What Are Recent G2 Reviews of Diver Platform?

What Are G2 Users Discussing About Diver Platform?

HYLA

HYLA Mobile exists to provide industry-leading technology, analytics and logistics solutions to help the mobile ecosystem maximize their sustainability efforts in a manner that builds exceptional value for customers and shareholders, while benefiting the environment.

Average Rating: 4.0/5.0

Total Reviews: 1

How Do G2 Users Rate HYLA?

  • Has the product been a good partner in doing business?: 6.7/10 (Category avg: 9.0/10)
  • Steps to Answer: 6.7/10 (Category avg: 8.3/10)
  • Reports Interface: 6.7/10 (Category avg: 8.8/10)
  • Calculated Fields: 6.7/10 (Category avg: 8.6/10)

Who Is the Company Behind HYLA?

  • Seller: HYLA
  • HQ Location: Atlanta, US
  • LinkedIn® Page: www.linkedin.com
    16,971 employees on LinkedIn®

Who Uses This Product?

  • Company Size: 100% Medium

What Are Recent G2 Reviews of HYLA?

icCube

icCube is a Swiss B2B dev2dev embedded analytics and reporting software. It's part of a software or SaaS company long term strategy to seamlessly embed custom analytics into their product. icCube is: - Made for dev teams by dev teams - Pixel-perfect white-labeled dashboards - Advanced multidimensional analytics - Fine-grained on-the-fly security - Unbeatable time-to-market for requested features We understand that each client and company has its very own requirements, and therefore not only, ​provide powerful advanced data analytics and reporting capabilities, but also greatly value the closeness and support we give to our clients.

Average Rating: 4.6/5.0

Total Reviews: 4

How Do G2 Users Rate icCube?

  • Has the product been a good partner in doing business?: 6.7/10 (Category avg: 9.0/10)
  • Steps to Answer: 10.0/10 (Category avg: 8.3/10)
  • Reports Interface: 10.0/10 (Category avg: 8.8/10)
  • Calculated Fields: 10.0/10 (Category avg: 8.6/10)

Who Is the Company Behind icCube?

  • Seller: icCube
  • Year Founded: 2009
  • HQ Location: Ecublens, CH
  • Twitter: @iccube
    4,976 Twitter followers
  • LinkedIn® Page: www.linkedin.com
    8 employees on LinkedIn®

Who Uses This Product?

  • Company Size: 75% Medium, 25% Small

What Are Recent G2 Reviews of icCube?

Kyligence Zen

Welcome to the next generation of business intelligence where your business metrics aren’t just numbers but a powerhouse of intelligent insights at your fingertips. Dive into Kyligence Zen, your centralized metrics hub that transforms data into actionable intelligence. Rooted in the single source of truth of metrics, Kyligence Zen provides everyone with accurate, comprehensive, and intelligent decision support tailored for modern enterprises.

Average Rating: 4.0/5.0

Total Reviews: 1

How Do G2 Users Rate Kyligence Zen?

  • Has the product been a good partner in doing business?: 6.7/10 (Category avg: 9.0/10)
  • Steps to Answer: 8.3/10 (Category avg: 8.3/10)
  • Reports Interface: 8.3/10 (Category avg: 8.8/10)
  • Calculated Fields: 8.3/10 (Category avg: 8.6/10)

Who Is the Company Behind Kyligence Zen?

  • Seller: Kyligence
  • Year Founded: 2016
  • HQ Location: San Jose, US
  • Twitter: @kyligence
    1,196 Twitter followers
  • LinkedIn® Page: www.linkedin.com
    116 employees on LinkedIn®

Who Uses This Product?

  • Company Size: 100% Large

What Are Recent G2 Reviews of Kyligence Zen?

LinceBI

An open source based solution. LinceBI allows you to Customize and Manage your BI Desktop ,Integrate Data, Design Dashboards and reports in a matter of minutes.

Average Rating: 4.3/5.0

Total Reviews: 2

How Do G2 Users Rate LinceBI?

  • Steps to Answer: 8.3/10 (Category avg: 8.3/10)
  • Reports Interface: 8.3/10 (Category avg: 8.8/10)
  • Calculated Fields: 8.3/10 (Category avg: 8.6/10)

Who Is the Company Behind LinceBI?

Who Uses This Product?

  • Company Size: 50% Large, 50% Medium

What Are Recent G2 Reviews of LinceBI?

List & Label

List & Label is a reporting tool for software developers to integrate reporting functions in their web, cloud and desktop applications. Made for development environments such as .NET, C#, Delphi, C++, ASP.NET, ASP.NET MVC, .NET Core etc. And of course, the component supports a variety of data sources. The List & Label report generator extends applications with extensive and convenient print, export and preview functions. Developers retain control over data transfer and create the interface. With the WYSIWYG Report Designer, developers or end users create or edit different print templates for printing information that originates either from a database or another data source. In the Designer, you then have all the data at your disposal and can prepare it for printing in different ways. The additionally included and entirely browser-based Web Report Designer for ASP.NET MVC offers more flexibility in development and is independent from printer drivers. Reports for web applications can be designed anywhere at any time in the browser of your choice. Compared to other reporting and data visualization tools, List & Label is not a suite of different development products. It’s standalone and you don’t have to invest in other components you might not need for your project.

Average Rating: 4.8/5.0

Total Reviews: 2

How Do G2 Users Rate List & Label?

  • Has the product been a good partner in doing business?: 10.0/10 (Category avg: 9.0/10)
  • Steps to Answer: 10.0/10 (Category avg: 8.3/10)
  • Reports Interface: 10.0/10 (Category avg: 8.8/10)
  • Calculated Fields: 10.0/10 (Category avg: 8.6/10)

Who Is the Company Behind List & Label?

  • Seller: Combit
  • Year Founded: 1989
  • HQ Location: Konstanz, DE
  • LinkedIn® Page: www.linkedin.com
    60 employees on LinkedIn®

Who Uses This Product?

  • Company Size: 50% Medium

What Are Recent G2 Reviews of List & Label?

What Are G2 Users Discussing About List & Label?

Bijou Barry
BB
Researched and written by Bijou Barry
Updated October 3, 2024