Best Digital Experience Monitoring (DEM) Software - Page 5

How Many Digital Experience Monitoring (DEM) Software Products Does G2 Track?

Total Products under this Category: 74

Category Stats (Oct 2026)

  • Average Rating: 4.55/5 The average rating of products in this category, based on all submitted ratings
  • Top Trending Product: Insightech (+1.99%) - Among all products in this category, Insightech recorded the largest rating increase compared to last month

Last updated: October 07, 2026

How Does G2 Rank Digital Experience Monitoring (DEM) Software Products?

Why You Can Trust G2's Software Rankings:

  • 30 Analysts and Data Experts
  • 7,900+ Authentic Reviews
  • 74+ Products
  • Unbiased Rankings

G2's software rankings are built on verified user reviews, rigorous moderation, and a consistent research methodology maintained by a team of analysts and data experts. Each product is measured using the same transparent criteria, with no paid placement or vendor influence. While reviews reflect real user experiences, which can be subjective, they offer valuable insight into how software performs in the hands of professionals. Together, these inputs power the G2 Score, a standardized way to compare tools within every category.

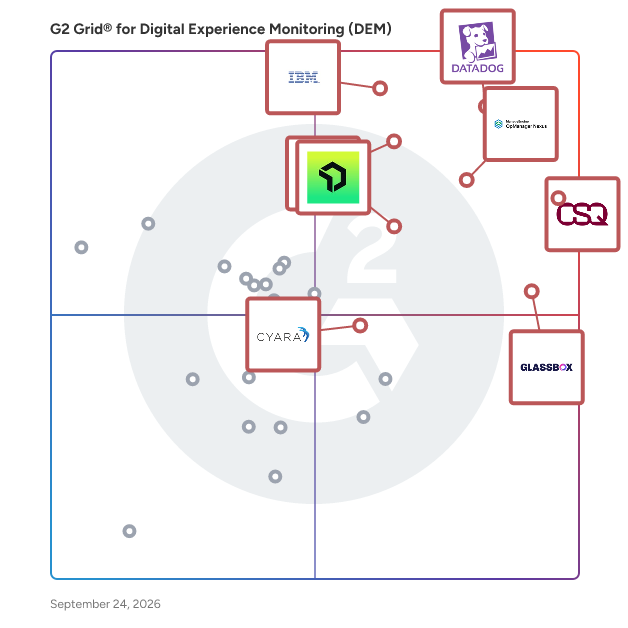
G2 Grid® for Digital Experience Monitoring (DEM) Software

G2 Grid® for Digital Experience Monitoring (DEM) Software plotting products by satisfaction and market presence

Highlighted products: Datadog, Contentsquare, IBM Instana, OpManager Nexus, Dynatrace, Glassbox, New Relic, and Cyara Platform.

Underlying data: [Grid® JSON](https://www.g2.com/categories/digital-experience-monitoring-dem/grids.json?focus%5B%5D=datadog&focus%5B%5D=contentsquare&focus%5B%5D=ibm-instana&focus%5B%5D=opmanager-nexus&focus%5B%5D=dynatrace&focus%5B%5D=glassbox&focus%5B%5D=new-relic&focus%5B%5D=cyara-platform)

Login VSI

Control Your EUC Workspace. Validate Every Change. Login VSI helps enterprise IT teams run and validate digital workspace environments at scale. Hydra is how Windows in the Cloud should be run, across Azure Virtual Desktop (AVD), Windows 365, and hybrid deployments. Built for administrators and MSPs alike, Hydra restores a familiar and streamlined way to transition to and manage modern virtual desktops, without the unnecessary cost, complexity, or operational tradeoffs of native or traditional third-party tooling. Login Enterprise continuously validates mission-critical enterprise performance across applications, infrastructure, and user workflows before and after every change. It catches regressions before rollout, detects drift after go-live, and protects user experience across every environment.

Average Rating: 4.5/5.0

Total Reviews: 3

How Do G2 Users Rate Login VSI?

  • Behavioral Analysis: 8.3/10 (Category avg: 8.2/10)
  • Real-Time Monitoring: 10.0/10 (Category avg: 9.0/10)
  • Alerts: 8.3/10 (Category avg: 8.8/10)

Who Is the Company Behind Login VSI?

  • Seller: Login VSI
  • Year Founded: 2012
  • HQ Location: Boston, US
  • Twitter: @LoginVSI
    5,557 Twitter followers
  • LinkedIn® Page: www.linkedin.com
    72 employees on LinkedIn®

Who Uses This Product?

  • Company Size: 67% Small, 33% Medium

What Do G2 Reviewers Say About Login VSI?

AI-generated summary from verified user reviews

Pros
  • Users appreciate the seamless interface and excellent customer support provided by Login VSI across major VDI platforms.
  • Users value the customer understanding of Login VSI, benefiting from excellent support and comprehensive platform compatibility.
  • Users appreciate the user-friendly interface of Login VSI, making it easy to test system performance and find issues.
  • Users value the easy integrations of Login VSI with various services, enhancing overall usability and automation.
  • Users appreciate the advanced issue detection and automation features of Login VSI, enhancing performance and usability.
Cons
  • Users find the cost of Login VSI to be prohibitively high, especially for smaller organizations with limited budgets.
  • Users find the complex setup process of Login VSI challenging, especially those lacking knowledge in virtual environments.
  • Users find the initial integration process challenging, making it less user-friendly for newcomers and small organizations.
  • Users find poor customer support frustrating, making initial integration and configuration more challenging and resource-intensive.

What Are Recent G2 Reviews of Login VSI?

Mimetic

Find where your site is losing revenue

Who Is the Company Behind Mimetic?

  • Seller: Mimetic
  • Year Founded: 2025
  • HQ Location: New York, US
  • LinkedIn® Page: www.linkedin.com
    2 employees on LinkedIn®

mPulse

Who Is the Company Behind mPulse?

  • Seller: Akamai Technologies
  • Year Founded: 1998
  • HQ Location: Cambridge, MA
  • Twitter: @Akamai
    115,251 Twitter followers
  • LinkedIn® Page: www.linkedin.com
    10,658 employees on LinkedIn®
  • Ownership: NASDAQ:AKAM

AI can help you find the answers. G2 helps you trust them.

Connect G2 to Claude or ChatGPT for answers grounded in G2's trusted reviews, comparisons, and pricing from real user insights.

How it works

NAVINES Beacon

NAVINES Beacon is an AI-powered digital operations intelligence platform that helps businesses detect hidden risks, explain business impact, prioritize action items, and monitor websites, online stores, performance, trust, SEO, and operational health in real time.

Who Is the Company Behind NAVINES Beacon?

  • Seller: Navines
  • Year Founded: 2018
  • HQ Location: Petach Tikva, IL
  • LinkedIn® Page: www.linkedin.com
    8 employees on LinkedIn®

Optus Digital Experience Monitoring

Gain the end-to-end visibility your business needs in a multi-domain, multi-cloud world Get granular data and insights into the performance of network, end user and cloud solutions Identify and remediate issues across environments you don’t control directly. Understand the network performance of your connectivity to the internet Understand and monitor the performance of SaaS apps. Optimise the user experience through monitoring performance and identifying patterns for users. Elevate the customer/ employee experience as they interact with business apps Make data-driven decisions to enhance and support the business

Who Is the Company Behind Optus Digital Experience Monitoring?

  • Seller: Optus
  • Year Founded: 1992
  • HQ Location: Macquarie Park, AU
  • LinkedIn® Page: www.linkedin.com
    11,242 employees on LinkedIn®

PagePulse

Getting the right information, to the right people, at the right time.

Who Is the Company Behind PagePulse?

PanSift

Digital Experience Monitoring for Macs in a remote-first world. Regain your edge and confidently solve current and historical Wi-Fi, DNS, IPv4, IPv6, HTTP, and system issues. Support everyone to Work From Anywhere(WFA) 🌎. Get instant remote troubleshooting to ensure teams stay productive irrespective of their location!

Who Is the Company Behind PanSift?

  • Seller: PanSift
  • Year Founded: 2017
  • HQ Location: Dublin, IE
  • Twitter: @pansifter
    326 Twitter followers
  • LinkedIn® Page: www.linkedin.com
    1 employees on LinkedIn®

QoEtient

Who Is the Company Behind QoEtient?

  • Seller: Tata Elxsi
  • Year Founded: 1989
  • HQ Location: Bangalore, IN
  • LinkedIn® Page: www.linkedin.com
    15,787 employees on LinkedIn®
  • Ownership: NSE: TATAELXSI

RUMvision

RUMvision is a Real User Monitoring (RUM) platform for Core Web Vitals, web performance, and user experience optimization. It helps developers, SEO specialists, performance teams, e-commerce businesses, and digital agencies understand how websites actually perform for real visitors, using real-world browser data instead of relying on synthetic performance scores. RUMvision collects field data using the web-vitals.js library and turns it into actionable performance insights. Teams can continuously monitor Largest Contentful Paint (LCP), Interaction to Next Paint (INP), and Cumulative Layout Shift (CLS) and investigate the pages, templates, devices, interactions, scripts, and other factors behind those metrics. Instead of only showing that a Core Web Vital has become slower, RUMvision helps teams understand where a performance problem occurs, which users are affected, and what is likely causing it. This makes it easier to prioritize optimizations, investigate regressions, evaluate releases, and measure whether performance improvements actually work for real users. RUMvision also offers a web performance MCP server based on the Model Context Protocol (MCP). This connects AI tools such as ChatGPT, Claude, Gemini, and compatible development environments directly to RUMvision’s performance data. Rather than manually searching dashboards, exporting metrics, or uploading screenshots, teams can ask questions in natural language and let their AI retrieve the relevant RUM, Core Web Vitals, CrUX, and performance evidence needed for the investigation. For example, teams can ask why INP became slower, what is causing poor LCP on specific templates, which third-party scripts have the greatest impact, or whether a recent release improved Core Web Vitals. The MCP helps AI move beyond generic web performance advice by grounding its analysis in actual user data. By combining Real User Monitoring, Core Web Vitals monitoring, performance analytics, CrUX data, and AI-powered web performance debugging through MCP, RUMvision helps teams spend less time finding performance problems and more time fixing them.

Who Is the Company Behind RUMvision?

  • Seller: Jordy
  • Year Founded: 2021
  • HQ Location: Groningen, NL
  • LinkedIn® Page: www.linkedin.com
    4 employees on LinkedIn®

Tupcan

Who Is the Company Behind Tupcan?

ZIF Dx+

ZIF Dx+ is an advanced iteration of ZIF Dx+, designed to transcend user experience optimization through innovative Transaction Journey Mapping (TJM). The incorporation of Transaction Journey Mapping showcases an unwavering commitment to operational excellence, seamless experiences, and proactive anomaly detection. By integrating ZIF Dx+ into their workflows, organizations are poised to embrace a new era of responsiveness and reliability, thus setting a new standard in digital experience optimization.

Who Is the Company Behind ZIF Dx+?

  • Seller: Neurealm
  • Year Founded: 1998
  • HQ Location: Princeton, US
  • Twitter: @ZIF_AI
    258 Twitter followers
  • LinkedIn® Page: linkedin.com
    3,635 employees on LinkedIn®

Zscaler Digital Experience (ZDX)

Zscaler Digital Experience Monitoring (ZDX) is designed to optimize digital experiences for end users by breaking traditional monitoring silos and reducing costs and complexity. Integrated into the Zscaler Zero Trust Exchange, ZDX leverages a single lightweight agent for both security and monitoring, eliminating the need for multiple, cumbersome agents and streamlining IT operations. This unified approach simplifies deployment and management while providing end-to-end visibility across devices, networks, and applications. ZDX empowers IT teams to proactively identify and resolve performance issues, minimize downtime, and optimize productivity. By pinpointing root causes—whether it’s high device CPU utilization, ISP latency, long DNS resolution times, or sluggish application response times—ZDX ensures seamless and reliable digital experiences for employees, no matter where they are working or what device or network they are using. With AI-powered capabilities like Zscaler Copilot, IT teams can gain actionable performance insights by simply asking questions—eliminating the need for deep technical expertise. This seamless integration of visibility and intelligence enables organizations to identify and resolve performance challenges faster, significantly reducing Mean Time to Resolution (MTTR). By redefining how IT teams monitor and manage digital experiences, ZDX ensures superior employee productivity and consistent access to SaaS and private apps, setting a new standard for digital experience monitoring. Key Features and Benefits: • End-to-end Visibility: ZDX provides User-to-Application visibility, offering a comprehensive view from the device level all the way to the application, including every hop across ISPs and proxies. This enables IT teams to isolate performance bottlenecks quickly, from packet loss in network hops to slow DNS or application response times, ensuring end-to-end monitoring clarity. • Quantifiable Experience Metrics: With the dynamic user experience score, organizations can measure user satisfaction across regions, departments, or applications. This data helps IT pinpoint problem areas affecting productivity and prioritize remediation. • AI-Powered Intelligence for Simplified Troubleshooting: Zscaler Copilot lets teams investigate performance issues by simply asking natural language questions, while Zscaler Copilot Playbooks deliver guided workflows that automatically diagnose issues across device, network, and application layers—streamlining problem identification and resolution. • Root Cause Insights for Faster Recovery: AI-Powered Root Cause Analysis detects performance issues like high CPU usage, ISP latency, or sluggish app response times, empowering IT teams to resolve them faster and reduce Mean Time to Resolution (MTTR). • Proactive Monitoring to Ensure Reliability: Hosted Monitoring provides 24/7 global synthetic monitoring, simulating application access to validate SLAs and uncover potential risks before users are affected. ISP Insights detect disruptions like brownouts, blackouts, or other degradations in real time, protecting user productivity. • Unified Metrics Across Core Systems: Device Health Metrics monitor critical areas such as CPU, memory, disk usage, Wi-Fi signal, and battery life to identify local device issues, while Hop-by-Hop Network Insights analyze packet loss, latency, and other network performance indicators. Application Monitoring tracks SaaS and private app performance, breaking down page load speeds, DNS times, and more for precise optimization. • Collaboration-Specific Metrics: UCaaS Monitoring ensures high-quality performance for collaboration tools like Zoom, Microsoft Teams, and Webex, tracking vital metrics such as call quality, audio/video clarity, and jitter to enhance user connectivity. • Self-Service Tools to Empower End Users: Guided Self-Service Tools allow employees to troubleshoot problems like low Wi-Fi signal or local device issues quickly—reducing IT workloads and enhancing user satisfaction. • Actionable Insights and Analytics: Data Explorer enables IT teams to generate reports and dashboards for benchmarking trends, analyzing historical patterns, and proactively optimizing future workflows. • Streamlined Incident Response: ServiceNow Integration automates ticket creation and enriches tickets with detailed device, network, or application performance data, reducing manual effort and accelerating issue resolution.

Who Is the Company Behind Zscaler Digital Experience (ZDX)?

  • Seller: Zscaler
  • Company Website:
  • Year Founded: 2008
  • HQ Location: San Jose, California
  • Twitter: @zscaler
    17,676 Twitter followers
  • LinkedIn® Page: www.linkedin.com
    9,150 employees on LinkedIn®
Tian Lin
TL
Researched and written by Tian Lin
Updated April 10, 2026