DiagramDeck
Who Is the Company Behind DiagramDeck?
- Seller: DiagramDeck
- HQ Location: N/A
-
LinkedIn® Page: www.linkedin.com
1 employees on LinkedIn®
Total Products under this Category: 165
Last updated: October 20, 2026
Why You Can Trust G2's Software Rankings:
G2's software rankings are built on verified user reviews, rigorous moderation, and a consistent research methodology maintained by a team of analysts and data experts. Each product is measured using the same transparent criteria, with no paid placement or vendor influence. While reviews reflect real user experiences, which can be subjective, they offer valuable insight into how software performs in the hands of professionals. Together, these inputs power the G2 Score, a standardized way to compare tools within every category.
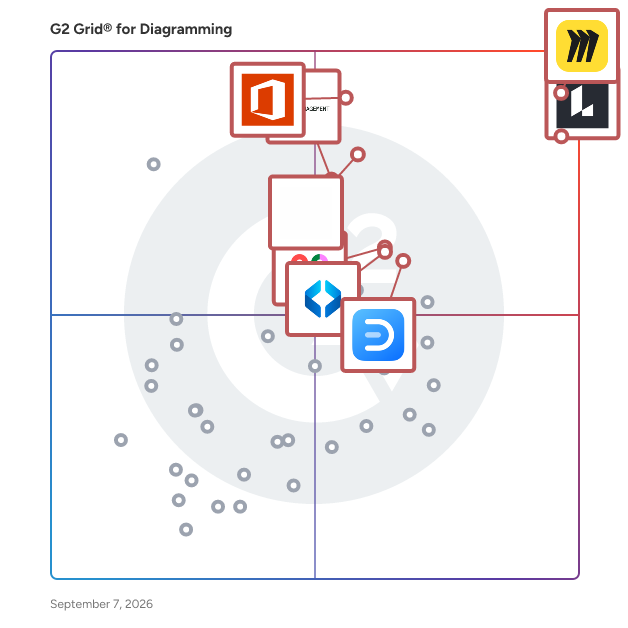
Highlighted products: Miro, Lucid Visual Collaboration Suite, Visio, FigJam, Cvent Event Marketing & Management, Mural, Wondershare EdrawMax, and SmartDraw.
Underlying data: [Grid® JSON](https://www.g2.com/categories/diagramming/grids.json?focus%5B%5D=miro&focus%5B%5D=lucid-software-inc-lucid-visual-collaboration-suite&focus%5B%5D=visio&focus%5B%5D=fig-jam&focus%5B%5D=cvent-event-marketing-management&focus%5B%5D=mural&focus%5B%5D=wondershare-edrawmax&focus%5B%5D=smartdraw)
Diagram Maker Pro is an AI-powered diagram generation solution that helps users create visual diagrams, flowcharts, mind maps, process maps, Gantt charts, and customer journeys from natural language prompts within Microsoft Copilot. The software is designed for business users, project managers, consultants, analysts, and teams that need to transform ideas, processes, and requirements into visual representations without manually building diagrams. Diagram Maker Pro operates within the Microsoft Copilot environment, enabling users to generate diagrams by describing their needs in plain language. Organizations use Diagram Maker Pro for a variety of scenarios, including process documentation, workflow design, project planning, brainstorming sessions, business analysis, customer journey mapping, and strategic planning. The solution helps teams standardize visual communication and convert text-based information into structured diagrams that can be used in reports, presentations, and internal documentation. Key capabilities include: 1. AI-powered diagram generation from natural language descriptions, eliminating the need to manually create diagrams from scratch. 2. Multiple diagram formats, including flowcharts, mind maps, process maps, customer journeys, workflows, timelines, and Gantt charts. 3. Microsoft Copilot integration, allowing users to create diagrams directly from the Copilot interface using conversational prompts. 4. Prompt library and guided templates that help users generate common business diagrams for planning, analysis, and documentation purposes. 5. Export-ready visual outputs that can be incorporated into business documents, presentations, project plans, and operational materials. Diagram Maker Pro is intended for organizations that want to accelerate diagram creation while reducing the effort required to visualize business processes, project timelines, and conceptual ideas. By combining generative AI with structured diagram formats, the software provides a way to convert written information into visual assets that can support collaboration, communication, and decision-making. The platform is hosted within the Microsoft ecosystem and is designed for use with Microsoft Copilot, making it suitable for organizations already working within Microsoft 365 environments. Users can create, refine, and iterate diagrams through conversational interactions while maintaining workflows within their existing productivity tools.
Connect G2 to Claude or ChatGPT for answers grounded in G2's trusted reviews, comparisons, and pricing from real user insights.
diagram.now is a browser-based diagram editor for creating flowcharts, UML diagrams, entity-relationship diagrams, BPMN process diagrams, cloud architecture diagrams, network diagrams, mind maps, and wireframes. It operates directly in web browsers without requiring installation. Users can start with blank canvases or built-in templates for organizational charts, kanban boards, and more. Shape libraries support various diagram types, and imports from Visio, Lucidchart, Gliffy, Mermaid, CSV, and SQL are available. Cloud architecture libraries include AWS, Azure, and Google Cloud shapes. Diagrams can be exported as PNG, SVG, PDF, JPEG, WebP, XML, JSON, or encoded URLs. Features include version control, collaborative tools like commenting and live cursor sharing, and custom shape libraries saved locally. Adaptive color modes adjust for light or dark environments, and Confluence integration allows embedding and editing diagrams directly within pages.
Digs is an AI-powered collaboration software built for homebuilders. From pre-con to aftercare, it keeps your team, trades, and clients aligned with one centralized workspace for decisions, documentation, digital handoff, and ongoing warranty support.
Average Rating: 5.0/5.0
Total Reviews: 5
AI-generated summary from verified user reviews
"We can't imagine building a house without Digs"
Rating: 5.0/5.0 stars
— Paula A.
"Finally, a tech tool that actually makes my life easier"
Rating: 5.0/5.0 stars
— Vincent L.
Quick and easy business process drawing chart with dot chart format. Automatic conversion to BPMN standard and export to Cavemo, Bizagi, Draw.io, Lucidchart.
DrakonHub helps project managers, software developers, and architects to make visual program documentation.
Eraser (eraser.io) is an AI-powered tool to create diagrams and agents. Generate professional diagrams from natural language, code, or images in seconds. Build agents that automatically create and update diagrams based on your rules, policies, and references.
Excalidraw plus brings native Excalidraw whiteboards and Mermaid diagrams directly into Confluence—so your team can create, edit, and reuse diagrams without leaving the documentation workflow. Key benefits: Excalidraw editing inside Confluence: draw, zoom, search, and export/save diagrams in context Mermaid.js import with instant diagram creation: generate flowcharts and UML, then refine them in Excalidraw 220+ reusable libraries: filter, preview, and reuse shapes and templates to document faster Built for teams: consistent diagramming for dev docs, architecture diagrams, and process flows Secure by design: built on Atlassian Forge with no need for external data storage We also has a Excalidraw Diagrams plus Whiteboards for Jira
Flowchart Maker for Excel by Uniform Software Limited is a Microsoft Excel-based app that automatically turns a simple process list into a professional, fully editable flowchart. Instead of manually drawing shapes, positioning boxes, routing connectors, and adjusting labels, you describe your process in an Excel table and let Flowchart Maker generate the diagram for you. Because the resulting flowcharts are made from standard Microsoft Office shapes and stored in standard Excel .xlsx workbooks, your diagrams remain editable, portable, and easy to share across Microsoft 365. Available Through Microsoft Store and Microsoft Marketplace Flowchart Maker is available through the Microsoft Store and Microsoft Marketplace. Purchasing through Microsoft's marketplaces can be convenient for individuals and organizations that already use Microsoft products and prefer to discover, purchase, and manage software through Microsoft's ecosystem. Microsoft marketplace distribution can also make the purchasing process more familiar for organizations that have established Microsoft procurement and account-management workflows. Create Flowcharts from Data Instead of Drawing Them Flowchart Maker takes a different approach to flowchart creation. Rather than manually dragging shapes onto a canvas, you enter your process as rows in an Excel data table. Each row can define: • A step ID • The text displayed inside the shape • The next step or steps • The shape type • Decision branches and their labels Flowchart Maker then automatically creates the corresponding diagram. This approach is particularly useful for processes that change frequently. When your process changes, you can update the data and regenerate the flowchart instead of rebuilding the diagram manually. Automatic Flowchart Layout One of the biggest challenges when creating flowcharts manually is arranging shapes and connectors. Flowchart Maker automatically calculates the positions of shapes and routes connectors for you. The app includes two layout algorithms: • MDS (Multidimensional Scaling) — useful for general-purpose processes, irregular flows, loops, cycles, and complex branching. • Sugiyama — designed for clean, layered diagrams such as approval processes, organizational workflows, and other hierarchical flows. You can also switch between horizontal and vertical orientations. The automatic layout helps reduce overlapping shapes and confusing connector paths, making it easier to create readable diagrams without spending time manually rearranging every element. Fully Editable Native Excel Flowcharts Flowchart Maker does not create a flat image of your flowchart. Every flowchart element is a native Microsoft Excel shape. This means you can continue using Excel's standard formatting and editing tools after the diagram has been generated. You can: • Move, resize, and align shapes • Change colors, borders, and fonts • Apply Excel shape formatting and effects • Edit text directly inside shapes • Modify connectors • Select and format groups of shapes • Copy the diagram into other Microsoft Office applications You can copy a completed flowchart to Microsoft Word, PowerPoint, or Outlook as an editable Office shape object. This makes Flowchart Maker particularly useful when flowcharts need to become part of reports, presentations, procedures, proposals, training materials, or other business documents. Support for 150+ Excel Shape Types Flowchart Maker supports the standard shape types available in Microsoft Excel, including traditional flowchart symbols as well as many other shapes. The visual shape picker makes it easy to select a shape without having to remember the name or appearance of each shape. This gives you the flexibility to create both conventional flowcharts and more specialized process diagrams. Flexible Decision Branches Decision branches are not restricted to labels such as "Yes" and "No." You can use meaningful labels that describe the actual alternatives in your process, such as: • Approved / Rejected • Continue / Stop • Internal / External • Customer / Supplier • Work or School Account / Microsoft Account This makes the resulting diagrams easier for users to understand without having to infer what a generic decision label means. Two-Way Synchronization Between Data and Diagram Flowchart Maker maintains a relationship between the flowchart and its underlying data. You can update the process data and regenerate the diagram. You can also edit descriptions or shape types directly on the flowchart and synchronize those changes back to the flow data. This two-way workflow reduces repetitive data entry and makes it easier to maintain diagrams as processes evolve. Update Existing Flowcharts Instead of Starting Over Flowchart Maker is designed for iterative work. When you modify an existing process, the Create / Update Flowchart command can update the existing diagram rather than requiring you to create a completely new chart. Changes can include: • Adding new steps • Removing deleted steps • Changing shape types • Updating visual templates • Adjusting connector routing • Fixing connector crossings • Updating the diagram layout This makes the application useful for processes that are continuously being developed or documented. Professional Templates and Brand Colors Flowchart Maker includes multiple built-in visual templates so you can change the appearance of a diagram without manually formatting every shape. You can also create your own templates using your organization's colors. The template system allows you to: • Start from an existing template • Define fill colors • Define border colors • Define text colors • Preview the result • Save the design as a reusable template Templates are standard .xlsx files, giving advanced Excel users additional flexibility to customize their diagrams. This is particularly useful for organizations that want flowcharts to follow corporate branding guidelines. Easy Collaboration with Standard Excel Files Flowchart Maker uses standard Excel .xlsx workbooks and native Microsoft Office shapes rather than a proprietary diagram format. This makes flowchart projects easy to store and share using Microsoft 365 services such as: • Microsoft SharePoint • Microsoft Teams • OneDrive for Business • Shared network folders Team members can open and view the workbook using standard Excel, even if they do not have Flowchart Maker installed. When the add-in is available, users can regenerate or update the flowchart from the underlying data. There is no proprietary project format or separate database required. Work with Data and the Diagram Side by Side Flowchart Maker includes a Snap Side by Side feature that automatically arranges the flow data sheet and chart sheet next to each other. This is especially useful on: • Large monitors • Ultra-wide displays • Dual-monitor workstations You can edit the process data on one screen while viewing the corresponding flowchart on another. Tools for Editing Large or Complex Flowcharts Flowchart Maker includes additional tools for working with diagrams after they have been generated. These include: • Select all shapes • Select blocks only • Select connectors only • Select shapes above, below, left, or right of the current selection • Invert selection • Flip charts horizontally or vertically • Rotate charts 90 degrees • Choose automatic, straight, curved, or elbow connectors • Reposition decision labels These tools make it easier to refine and format larger diagrams without selecting individual objects one at a time. Common Use Cases Flowchart Maker can be used for many types of business and technical processes, including: • Business process documentation • Workflow diagrams • Standard operating procedures (SOPs) • Approval workflows • Customer service processes • Sales processes • Onboarding workflows • IT and software processes • System and application workflows • Decision trees • Troubleshooting procedures • Manufacturing processes • Quality control procedures • Project management workflows • Training and educational materials • Compliance documentation • Internal process documentation • Technical documentation Because the process is represented as structured data, Flowchart Maker is also useful when the same workflow needs to be maintained, revised, or regenerated repeatedly. Why Use Flowchart Maker Instead of Drawing Flowcharts Manually? With Flowchart Maker, you can: • Describe the process in an Excel table • Automatically generate the flowchart • Automatically arrange the shapes • Automatically create connectors • Automatically position decision labels • Update the diagram when the process changes • Continue editing everything using standard Excel tools Who Is Flowchart Maker For? Flowchart Maker is a good fit for anyone who needs to create or maintain process diagrams while working primarily in Microsoft Excel. It can be particularly useful for: • Business analysts • Project managers • Process analysts • Consultants • Operations teams • Engineers • Software developers • IT professionals • Quality and compliance teams • Technical writers • Trainers and educators • Small businesses • Enterprise teams
Enterprise-grade Excel-based app that completely automates flowchart and process map creation by converting text lists to diagrams.
