Best Diagramming Software - Page 6

How Many Diagramming Software Products Does G2 Track?

Total Products under this Category: 163

Category Stats (Sep 2026)

  • Average Rating: 4.41/5 (↑0.01 vs Aug 2026) The average rating of products in this category, based on all submitted ratings
  • Top Trending Product: Kumu (+12.5%) - Among all products in this category, Kumu recorded the largest rating increase compared to last month

Last updated: September 01, 2026

How Does G2 Rank Diagramming Software Products?

Why You Can Trust G2's Software Rankings:

  • 30 Analysts and Data Experts
  • 34,300+ Authentic Reviews
  • 163+ Products
  • Unbiased Rankings

G2's software rankings are built on verified user reviews, rigorous moderation, and a consistent research methodology maintained by a team of analysts and data experts. Each product is measured using the same transparent criteria, with no paid placement or vendor influence. While reviews reflect real user experiences, which can be subjective, they offer valuable insight into how software performs in the hands of professionals. Together, these inputs power the G2 Score, a standardized way to compare tools within every category.

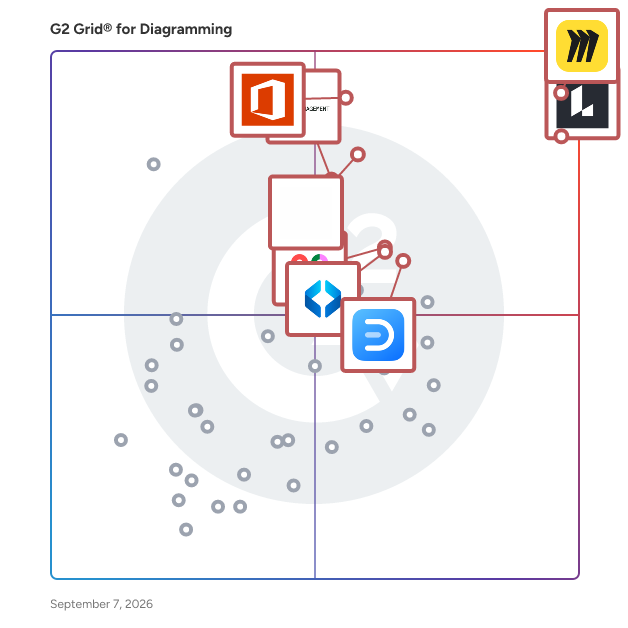
G2 Grid® for Diagramming Software

G2 Grid® for Diagramming Software plotting products by satisfaction and market presence

Highlighted products: Miro, Lucid Visual Collaboration Suite, Visio, FigJam, Cvent Event Marketing & Management, Mural, Wondershare EdrawMax, and SmartDraw.

Underlying data: [Grid® JSON](https://www.g2.com/categories/diagramming/grids.json?focus%5B%5D=miro&focus%5B%5D=lucid-software-inc-lucid-visual-collaboration-suite&focus%5B%5D=visio&focus%5B%5D=fig-jam&focus%5B%5D=cvent-event-marketing-management&focus%5B%5D=mural&focus%5B%5D=wondershare-edrawmax&focus%5B%5D=smartdraw)

Thinkmap

Thinkmap is a dynamic, data-driven visualization software.

Average Rating: 4.8/5.0

Total Reviews: 2

How Do G2 Users Rate Thinkmap?

  • Quality of Support: 8.3/10 (Category avg: 8.7/10)
  • Ease of Use: 9.2/10 (Category avg: 8.7/10)

Who Is the Company Behind Thinkmap?

Who Uses This Product?

  • Company Size: 50% Large, 50% Small

What Do G2 Reviewers Say About Thinkmap?

AI-generated summary from verified user reviews

Pros
  • Users love the collaborative brainstorming capabilities of Thinkmap, enhancing both personal and team creativity.
  • Users value the creativity freedom of Thinkmap, appreciating its customization options for both personal and collaborative brainstorming.
  • Users value the customizability of Thinkmap, enabling personalized brainstorming and team collaboration with design flexibility.
  • Users value the flexibility of Thinkmap, allowing for tailored workflows that enhance productivity and focus.
  • Users value the flexible team collaboration features of Thinkmap, enhancing both personal brainstorming and group projects.
Cons
  • Users find difficult navigation in large, complex maps makes them sluggish and hampers productivity with Thinkmap.
  • Users find performance issues arise when navigating large, complex maps, leading to sluggishness and difficulty in usage.

What Are Recent G2 Reviews of Thinkmap?

yUML

yUML allows to create diagrams without using any visual drawing tools.

Average Rating: 4.3/5.0

Total Reviews: 2

How Do G2 Users Rate yUML?

  • Quality of Support: 7.5/10 (Category avg: 8.7/10)
  • Ease of Use: 7.5/10 (Category avg: 8.7/10)

Who Is the Company Behind yUML?

  • Seller: Pocketworks
  • HQ Location: N/A
  • Twitter: @yuml_app
    444 Twitter followers
  • LinkedIn® Page: www.linkedin.com
    1 employees on LinkedIn®

Who Uses This Product?

  • Company Size: 50% Medium, 50% Small

What Are Recent G2 Reviews of yUML?

Arcentry

Arcentry helps you visualize the full picture of your infrastucture - in realtime and at any scale

Average Rating: 5.0/5.0

Total Reviews: 1

How Do G2 Users Rate Arcentry?

  • Quality of Support: 10.0/10 (Category avg: 8.7/10)
  • Ease of Use: 10.0/10 (Category avg: 8.7/10)

Who Is the Company Behind Arcentry?

  • Seller: Arcentry
  • Year Founded: 2018
  • HQ Location: Newark, US
  • Twitter: @arcentry
    127 Twitter followers
  • LinkedIn® Page: www.linkedin.com
    1 employees on LinkedIn®

Who Uses This Product?

  • Company Size: 100% Small

What Do G2 Reviewers Say About Arcentry?

AI-generated summary from verified user reviews

Pros
  • Users value the integration capabilities of Arcentry, allowing for effective infrastructure management and automation.

What Are Recent G2 Reviews of Arcentry?

Blue J Diagramming

Blue J Diagramming is the intelligent diagramming solution built for law and accounting firms. Blue J Diagramming allows lawyers and accountants to create professional diagrams and organizational charts faster than ever before. *Purpose built for lawyers and accountants* Access a library of standardized shapes, an intuitive interface, and options to add colors, curved lines, and labels make the entire diagramming experience a pleasant and seamless one. *Quick start templates to get a head start* Get started with pre-built structure charts that are ready to be customized. Find professionally-designed org charts involving corporations and partnerships, reorganizations, liquidations, and mergers and acquisitions and more. *Collaborate with Colleagues* Work even faster by sharing and collaborating on diagrams with colleagues. Work with team members in real-time as they respond to notes, review work, and make revisions in a shared space to finalize work efficiently.

Average Rating: 4.5/5.0

Total Reviews: 1

How Do G2 Users Rate Blue J Diagramming?

  • Quality of Support: 6.7/10 (Category avg: 8.7/10)
  • Ease of Use: 5.0/10 (Category avg: 8.7/10)

Who Is the Company Behind Blue J Diagramming?

  • Seller: Blue J
  • Year Founded: 2015
  • HQ Location: Toronto, CA
  • LinkedIn® Page: www.linkedin.com
    93 employees on LinkedIn®

Who Uses This Product?

  • Company Size: 100% Small

What Are Recent G2 Reviews of Blue J Diagramming?

code2flow

Code2Flow is an innovative web-based tool that simplifies the creation of flowcharts and diagrams by converting simple text descriptions into clear, concise visual representations. Designed for both technical and non-technical users, it enables project managers, developers, educators, and other professionals to effortlessly visualize complex processes and workflows. By focusing on the process description, users can generate optimal, readable diagrams without the need for manual chart editing, making it an ideal solution for illustrating software development processes, business workflows, or educational materials. Key Features and Functionality: - Automatic Flowchart Generation: Transforms text-based descriptions into detailed flowcharts within seconds, streamlining the diagram creation process. - User-Friendly Interface: Offers an intuitive platform that requires no prior experience, allowing users to create and share diagrams effortlessly. - Multi-Language Support: Accommodates various programming languages, including Python, JavaScript, TypeScript, Java, C, and C++, ensuring versatility for diverse programming needs. - Interactive Flowcharts: Provides interactive diagrams that enhance code comprehension and analysis, facilitating efficient navigation through complex code structures. - Export and Integration Options: Allows users to download diagrams in multiple formats (PDF, SVG, PNG and integrate them into tools like Google Docs, Microsoft Word, Atlassian Jira, and Confluence, promoting seamless collaboration. Primary Value and User Solutions: Code2Flow addresses the challenge of visualizing and communicating complex processes by offering a straightforward method to create flowcharts from textual descriptions. This capability enhances understanding and collaboration among team members, reduces the time spent on manual diagram creation, and improves productivity. By simplifying the visualization of workflows, algorithms, and procedures, Code2Flow serves as a valuable tool for professionals seeking to convey intricate information clearly and efficiently.

Average Rating: 3.0/5.0

Total Reviews: 1

How Do G2 Users Rate code2flow?

  • Quality of Support: 10.0/10 (Category avg: 8.7/10)
  • Ease of Use: 8.3/10 (Category avg: 8.7/10)

Who Is the Company Behind code2flow?
Who Uses This Product?

  • Company Size: 100% Large

ERD Lab

ERD Lab is an online ER Diagram Tool that allows you to design your database visually. Import existing SQL or develop new database without writing a single line of code. Visualize your schemas to share & collaborate with your team. Export SQL or PDF/Image when done. All for FREE!

Average Rating: 5.0/5.0

Total Reviews: 1

Who Is the Company Behind ERD Lab?

Who Uses This Product?

  • Company Size: 100% Small

What Are Recent G2 Reviews of ERD Lab?

Graham Process Mapping

Graham Process Maps break down business process information flows to INDIVIDUAL documents (forms, records, applications, systems, spreadsheets, email) whatever is used to capture, transmit or store data.

Average Rating: 4.0/5.0

Total Reviews: 1

How Do G2 Users Rate Graham Process Mapping?

  • Quality of Support: 8.3/10 (Category avg: 8.7/10)
  • Ease of Use: 8.3/10 (Category avg: 8.7/10)

Who Is the Company Behind Graham Process Mapping?

Who Uses This Product?

  • Company Size: 100% Medium

What Are Recent G2 Reviews of Graham Process Mapping?

What Are G2 Users Discussing About Graham Process Mapping?

Ilograph

Ilograph is a system architecture diagramming tool designed for developers, architects, DevOps, SecOps, SREs, and engineers. It offers interactive diagrams that allow for comprehensive technical documentation, enabling teams to collaborate effectively and maintain shared understanding of their systems. Available as a web application, desktop app, and integration with Confluence Cloud, Ilograph facilitates onboarding and learning through step-by-step walkthroughs and real-time updates. Trusted by architecture teams worldwide, Ilograph enhances communication and reduces misunderstandings in complex systems.

Average Rating: 5.0/5.0

Total Reviews: 1

How Do G2 Users Rate Ilograph?

  • Quality of Support: 10.0/10 (Category avg: 8.7/10)
  • Ease of Use: 8.3/10 (Category avg: 8.7/10)

Who Is the Company Behind Ilograph?

Who Uses This Product?

  • Company Size: 100% Small

What Do G2 Reviewers Say About Ilograph?

AI-generated summary from verified user reviews

Pros
  • Users commend the responsive customer support of Ilograph, appreciating quick implementation of their feedback and suggestions.
  • Users appreciate the ease of use of Ilograph, finding it intuitive and responsive to their needs.
  • Users value the responsive feedback management of Ilograph, appreciating quick implementations of their suggestions by the founder.
Cons
  • Users find the license costs prohibitive, complicating collaboration and onboarding across the enterprise.
  • Users face sharing issues with Ilograph due to expensive licenses, complicating collaboration among team members.

What Are Recent G2 Reviews of Ilograph?

Netica

Netica is a program for working with belief networks and influence diagrams. The relationships between variables may be entered as individual probabilities or in the form of equations.

Average Rating: 4.0/5.0

Total Reviews: 1

How Do G2 Users Rate Netica?

  • Ease of Use: 3.3/10 (Category avg: 8.7/10)

Who Is the Company Behind Netica?

  • Seller: Norsys
  • Year Founded: 1994
  • HQ Location: Ennevelin, FR
  • LinkedIn® Page: www.linkedin.com
    561 employees on LinkedIn®

Who Uses This Product?

  • Company Size: 100% Medium

What Are Recent G2 Reviews of Netica?

What Are G2 Users Discussing About Netica?

Platforma Flowcharts

Platforma Flowcharts for Web is a collection of cards for early-stage website prototyping in Sketch, Figma and Illustrator.

Average Rating: 5.0/5.0

Total Reviews: 1

How Do G2 Users Rate Platforma Flowcharts?

  • Ease of Use: 8.3/10 (Category avg: 8.7/10)

Who Is the Company Behind Platforma Flowcharts?

Who Uses This Product?

  • Company Size: 100% Small

What Are Recent G2 Reviews of Platforma Flowcharts?

What Are G2 Users Discussing About Platforma Flowcharts?

PRO-Sitemaps.com

PRO-Sitemaps.com enable users to create, host, and maintain sitemaps.

Average Rating: 5.0/5.0

Total Reviews: 1

How Do G2 Users Rate PRO-Sitemaps.com?

  • Quality of Support: 10.0/10 (Category avg: 8.7/10)
  • Ease of Use: 10.0/10 (Category avg: 8.7/10)

Who Is the Company Behind PRO-Sitemaps.com?

Who Uses This Product?

  • Company Size: 200% Small

What Are Recent G2 Reviews of PRO-Sitemaps.com?

What Are G2 Users Discussing About PRO-Sitemaps.com?

Schematics

Schematics.com is a free online schematic editor that allows to create and share circuit diagrams.

Average Rating: 4.5/5.0

Total Reviews: 1

How Do G2 Users Rate Schematics?

  • Quality of Support: 8.3/10 (Category avg: 8.7/10)
  • Ease of Use: 10.0/10 (Category avg: 8.7/10)

Who Is the Company Behind Schematics?

Who Uses This Product?

  • Company Size: 100% Large

What Are Recent G2 Reviews of Schematics?

What Are G2 Users Discussing About Schematics?

Software Ideas Modeler

Software Ideas Modeler is a smart diagram software with UML, SysML, ERD, BPMN, ArchiMate, flowcharts, user stories, wireframe support

Average Rating: 4.5/5.0

Total Reviews: 1

Who Is the Company Behind Software Ideas Modeler?

  • Seller: Dusan Rodina
  • HQ Location: N/A
  • Twitter: @software_ideas
    652 Twitter followers
  • LinkedIn® Page: www.linkedin.com
    1 employees on LinkedIn®

What Are Recent G2 Reviews of Software Ideas Modeler?

What Are G2 Users Discussing About Software Ideas Modeler?

Textografo Diagrams

Textografo allows to automatically generate diagrams like flowcharts, mindmaps, decision tree, organizational charts and more based on a simple textual syntax. Ideal to quickly map your processes or provide a decision tree to customer service or help desks or simply map what you have in mind. Diagrams are interactive and can be animated in one click. You can share them with people. They don't need to create a Textografo account to access the diagram. Finally, you can edit and comment diagrams with your team, clients or partners. Team collaboration is easy.

Average Rating: 4.0/5.0

Total Reviews: 1

How Do G2 Users Rate Textografo Diagrams?

  • Quality of Support: 10.0/10 (Category avg: 8.7/10)
  • Ease of Use: 8.3/10 (Category avg: 8.7/10)

Who Is the Company Behind Textografo Diagrams?

  • Seller: Textografo
  • HQ Location: N/A
  • Twitter: @textografo
    145 Twitter followers
  • LinkedIn® Page: www.linkedin.com
    2 employees on LinkedIn®

Who Uses This Product?

  • Company Size: 100% Medium

What Are Recent G2 Reviews of Textografo Diagrams?

What Are G2 Users Discussing About Textografo Diagrams?

Vexlio

Vexlio allows you to create interactive flowcharts and diagrams with click-to-reveal popups. It's used by engineers, techical writers, educators, product managers, and more to explain systems, processes, and concepts. Your fully interactive finished product can be embedded right in a webpage or knowledge base such as Confluence or Sharepoint. A core capability of Vexlio is support for creating interactive diagrams with popups. Any object in a drawing can host attached popup content that appears on hover or click, making it possible to layer additional explanations, alternative views, or example scenarios without crowding the main diagram. These interactive diagrams can be shared through a link or embedded in other pages while preserving the popup behavior. Key feature areas include: • Interactive popup attachments that let authors nest detailed diagrams, notes, images, or callouts inside objects, enabling multi-level explanations in a single document. • Native live-edit LaTeX equations, suitable for engineering, physics, and mathematics diagrams. • Comprehensive drawing tools for technical diagrams, including snapping, alignment aids, connectors, syntax-highlighted code snippets, and more. Typical usecases include diagrams such as architecture maps, flowcharts, system sketches, math illustrations, and instructional graphics. Users can export or share their creations as static images in PNG, SVG, PDF, or as live, interactive documents.

Average Rating: 5.0/5.0

Total Reviews: 1

How Do G2 Users Rate Vexlio?

  • Quality of Support: 10.0/10 (Category avg: 8.7/10)
  • Ease of Use: 10.0/10 (Category avg: 8.7/10)

Who Is the Company Behind Vexlio?

Who Uses This Product?

  • Company Size: 100% Small

What Do G2 Reviewers Say About Vexlio?

AI-generated summary from verified user reviews

Pros
  • Users value the interactive learning experience Vexlio offers, enhancing online education for teachers and students alike.

What Are Recent G2 Reviews of Vexlio?

Neeraja Prakash
NP
Researched and written by Neeraja Prakash
Updated October 3, 2024