Best Data Visualization Tools - Page 28

How Many Data Visualization Tools Products Does G2 Track?

Total Products under this Category: 478

Category Stats (Aug 2026)

  • Average Rating: 4.43/5 The average rating of products in this category, based on all submitted ratings
  • Top Trending Product: Supersimple (+0.89%) - Among all products in this category, Supersimple recorded the largest rating increase compared to last month

Last updated: August 04, 2026

How Does G2 Rank Data Visualization Tools Products?

Why You Can Trust G2's Software Rankings:

  • 30 Analysts and Data Experts
  • 26,100+ Authentic Reviews
  • 478+ Products
  • Unbiased Rankings

G2's software rankings are built on verified user reviews, rigorous moderation, and a consistent research methodology maintained by a team of analysts and data experts. Each product is measured using the same transparent criteria, with no paid placement or vendor influence. While reviews reflect real user experiences, which can be subjective, they offer valuable insight into how software performs in the hands of professionals. Together, these inputs power the G2 Score, a standardized way to compare tools within every category.

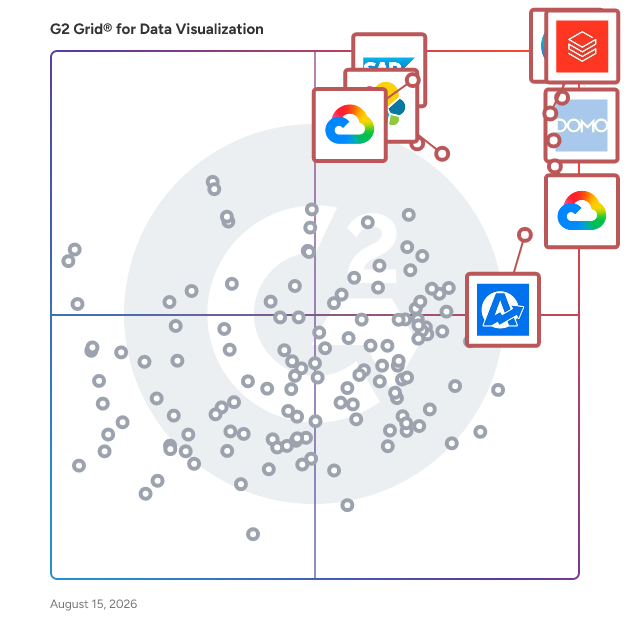
G2 Grid® for Data Visualization Tools

G2 Grid® for Data Visualization Tools plotting products by satisfaction and market presence

Highlighted products: Canva, Databricks, Domo, Looker, Data Studio, Elastic Stack, SAP HANA Cloud, and AgencyAnalytics.

Underlying data: [Grid® JSON](https://www.g2.com/categories/data-visualization-tools/grids.json?focus%5B%5D=canva&focus%5B%5D=databricks&focus%5B%5D=domo&focus%5B%5D=looker&focus%5B%5D=data-studio&focus%5B%5D=elastic-stack&focus%5B%5D=sap-hana-cloud-2025-10-01&focus%5B%5D=agencyanalytics)

Sponsored

Meltwater

Meltwater empowers companies with a suite of solutions that spans media, social, and consumer intelligence. Since 2001, we’ve helped organizations harness the world’s data in real time to fuel smarter decisions, stronger performance and sustainable growth. By analyzing nearly 1 billion pieces of content each day and transforming them into vital insights, Meltwater unlocks the competitive edge needed to drive results. With 27,000 customers, 50 offices across six continents and 2,200 employees, Meltwater is the industry partner of choice for global brands making an impact. We activate the power of data so businesses can make smarter, faster decisions. With the most robust dataset across media, social, consumer trends – and now insights into how large language models (LLMs) shape brand visibility – we give companies a complete view of the conversations, behaviors, and signals influencing their markets. Our powerful AI turns this breadth of data into actionable insights, empowering teams across PR, communications and marketing to confidently drive strategy. -- Mira Studio (AI-Powered Media, Market, and Brand Intelligence Assistant) Key features - Natural language querying - Automated insights - Structured reports - Trend-spotting and explanations with suggested actions - Integrated throughout the full Meltwater Platform - Integrates with Copilot and Slack What is Mira Studio? Mira Studio is Meltwater’s conversational AI teammate for media, market, and brand intelligence. Mira Studio helps PR, comms, and marketing teams cut through complexity and reduce time spent on manual analysis, with prompt-driven reporting, briefing, simplified data exploration, and real-time answers. Who uses Mira Studio? Teams that need quick and shareable insights while reducing manual time spent digging through data. Mira Studio converts Meltwater data into summaries, visuals, and provides explanations through natural language interaction. Get to the why of what’s happening, not just the what. -- Media Intelligence for PR (Media Monitoring and Analysis Platform) Key capabilities - Monitor 6M different media sources - Unlimited search - Real-time alerts - Journalist identification - Competitive benchmarking - Unified, shareable reporting - Predictive analytics for mention forecasting - Brand-level sentiment What is Meltwater Media Intelligence? Meltwater’s media intelligence platform monitors and analyzes earned media coverage through tracking brand mentions and narratives across news, print, broadcast, podcasts, and social media. This enables faster response times to trends or feedback through real-time awareness of message penetration, emerging risks, and consumer sentiment. Who Uses Meltwater Media Intelligence? PR and comms teams use Meltwater Media Intelligence to strengthen PR strategies with accurate measurement of brand impact across media sources. With journalist outreach capabilities within a single platform, PR efforts are streamlined for better results. -- Social Listening and Analytics Key capabilities - Monitoring 200B+ social conversations - Analysis of 300M+ social profiles - Influencer identification - Shareable reporting across earned, owned, and paid social - Brand-level sentiment and predictive analytics for brand measurement and forecasting - AI agents for Boolean search creation and management - AI-powered insights summarize brand and topic narratives - Access to Meltwater API What is Meltwater Social Listening and Analytics? Meltwater social listening and analytics is an integrated platform providing monitoring and AI-powered analysis for billions of social conversations. Connect consumer insights to social strategy and marketing campaigns for a seamless approach to brand promotion, quicker crisis response, and powerful competitor insights without data caps. Who uses Meltwater Social Listening? Marketing and social teams in charge of consumer, competitor, and industry insights. -- Influencer Management (Klear – Influencer Relationship Management Platform) Key capabilities - Database of 30M+ global creator profiles - AI-driven influencer discovery and recommendations - Influencer vetting and brand safety analysis - AI-driven outreach and relationship management - Campaign management and creator collaboration tools - Performance benchmarking and ROI tracking - Competitive influencer intelligence What is our influencer management solution? Klear is Meltwater’s influencer discovery and influencer relationship management solution. Vet, manage, and measure influencers and campaigns at scale from within a single tool. AI-powered influencer recommendations improves targeting accuracy, providing better matches and influencing better ROI. Who uses our influencer management solution? Marketing, PR, and Influencer teams use Klear for implementing and scaling their influencer campaigns. Outreach, gifting, payment, analysis and reporting can all be managed through our platform. -- Enterprise and Professional Services Key capabilities - Analyst-led insights and reporting - Custom data configurations - Enterprise-grade support and delivery What is Meltwater Enterprise and Professional Services? Customized intelligence solutions and professional services from Meltwater experts supports large enterprises with advanced or bespoke requirements. This service provides complex data analysis and reporting that go beyond standard product workflows, and ensures fast and accurate delivery for high-stakes or large-scale intelligence needs.

Visit website

Foursquare Spatial Studio

Foursquare Spatial Studio is a comprehensive geospatial tool that lets you conduct powerful geospatial data analysis from your browser. With Studio, you can: - Visualize large amounts of location data in your browser. - Perform geospatial analytics by grouping and joining your data. - Gain insights by filtering and correlating your location data. - Quickly publish and share your results.

Average Rating: 4.9/5.0

Total Reviews: 4

How Do G2 Users Rate Foursquare Spatial Studio?

  • Has the product been a good partner in doing business?: 10.0/10 (Category avg: 9.0/10)

Who Is the Company Behind Foursquare Spatial Studio?

  • Seller: Foursquare
  • Year Founded: 2009
  • HQ Location: New York, NY
  • Twitter: @foursquare
    22,906 Twitter followers
  • LinkedIn® Page: www.linkedin.com
    523 employees on LinkedIn®

Who Uses This Product?

  • Company Size: 75% Small, 25% Large

What Are Recent G2 Reviews of Foursquare Spatial Studio?

Franc Technologies

Franc, a Digitization company, builds a Big Data SaaS habit for enterprises to solve their data problems at massive global scale. With our platform, enterprises can unlock the value of digitizing their operations, production pipelines, financial transactions, employee on-boarding, case management and more

Who Is the Company Behind Franc Technologies?

Fusedash - AI Data Visualization Platform for Dashboards

Fusedash is an AI data visualization platform for building interactive dashboards, charts, maps, and storytelling reports in one workspace. Connect CSVs and APIs, monitor real-time KPIs, and share consistent views with your team or stakeholders. Use AI Chat to ask questions in plain language and get answers backed by your data, including charts, tables, breakdowns, and summaries.

Who Is the Company Behind Fusedash - AI Data Visualization Platform for Dashboards?

GraphAsk - Chat with your Data using AI

GraphAsk is an AI-powered tool that transforms your data into interactive dashboards and visual insights with just a few simple queries. Whether your data comes from Excel, CSV, or databases, GraphAsk makes it easy to understand and visualize complex information without needing technical skills. Just upload your data or connect to your database, ask your questions in plain language, and receive instant, actionable results. GraphAsk suggests the best charts and graphs based on your data — whether it's trends over time, comparisons across regions, or other patterns — and helps you make smarter, data-driven decisions faster.

Who Is the Company Behind GraphAsk - Chat with your Data using AI?

Graphy HQ

Graphy HQ uses AI to analyze data, charts, and graphs, providing valuable insights for better decision-making.

Who Is the Company Behind Graphy HQ?

Hookshot

Tour de Force BI is a business intelligence software that provides analytics, reporting, and dashboards.

Who Is the Company Behind Hookshot?

i-net Clear Reports

i-net Clear Reports is a web-based reporting platform that helps organizations and software vendors create, manage, automate, and distribute professional reports, dashboards, and business documents. Designed for enterprise reporting environments as well as embedded reporting scenarios, the platform combines powerful reporting tools with flexible integration options for business applications and software products. Organizations use i-net Clear Reports to centralize reporting processes, improve access to business information, and automate the generation and distribution of reports and documents. The platform supports operational reporting, management reporting, financial reporting, compliance reporting, and customer-facing reporting requirements across a wide range of industries. The integrated Report Designer enables users to create pixel-perfect reports, forms, labels, invoices, statements, and other business documents through a visual design environment. Business users can create and customize reports through ad hoc reporting capabilities, reducing reliance on development teams while improving access to data and analytics. In addition to traditional reporting, i-net Clear Reports provides interactive dashboards and data visualization features that help users monitor key performance indicators and explore business data. Reports and dashboards can be accessed through a browser-based interface and shared across teams and departments. A key differentiator of i-net Clear Reports is its embedded reporting functionality. Software vendors, SaaS providers, and development teams can integrate reporting, dashboards, and document generation directly into their own applications using APIs and web-based components. This allows organizations to deliver reporting capabilities to end users without building and maintaining a reporting framework internally. The platform supports connectivity to a wide variety of data sources, including relational databases, files, web services, and enterprise applications. Data from multiple sources can be combined within a single report, enabling organizations to create comprehensive reporting solutions across distributed systems and business processes. To reduce manual effort, i-net Clear Reports includes scheduling and automation capabilities for report execution and distribution. Reports can be generated automatically and delivered through email, file systems, printers, or integrated workflows. Organizations can also use the platform for large-scale document generation and recurring reporting processes. i-net Clear Reports supports flexible deployment models, including on-premises installations, private cloud environments, public cloud infrastructures, and embedded SaaS applications. The platform is used by enterprises, government organizations, software vendors, and technology providers that require scalable reporting, document generation, and dashboarding capabilities. By combining enterprise reporting, ad hoc reporting, dashboards, document generation, and embedded reporting within a single platform, i-net Clear Reports helps organizations streamline reporting workflows, improve data accessibility, and deliver business information where it is needed most.

Who Is the Company Behind i-net Clear Reports?

  • Seller: i-net software GmbH
  • Year Founded: 1996
  • HQ Location: Berlin, DE
  • Twitter: @inetsoftware
    31 Twitter followers
  • LinkedIn® Page: www.linkedin.com
    3 employees on LinkedIn®
  • Phone: +49 30 252 993 50

Inevisual

Hay muchísimos datos públicos en España. El problema no es la falta de información, sino todo lo contrario: acceder a ella, interpretarla y compararla sigue siendo complicado incluso para usuarios avanzados. Ahí es donde nace Inevisual.es.

Who Is the Company Behind Inevisual?

InfoCaptor Dashboard

Versatile dashboard that allows chart building. InfoCaptor allows for data upload from multiple sources.There are multiple visualization options and a drag and drop tool for developing dashboards.

Who Is the Company Behind InfoCaptor Dashboard?

infographicAI

infographicAI is an AI infographic generator that turns text, reports, research notes, and data-heavy content into polished visual stories. It reads the source content first, identifies key metrics, relationships, and narrative structure, then automatically matches the layout, typography, charts, and visual style to the message. Unlike image generators that can produce garbled text, infographicAI renders real HTML/CSS, so every word is accurate, selectable, editable, and resolution-independent. Users can refine the result with plain-language instructions, such as changing a headline, emphasizing a metric, adjusting the layout, or shifting the color palette. It supports single-image infographics and social carousel formats, with JPG and high-definition PNG exports. infographicAI is built for content marketers, founders, researchers, educators, consultants, and small teams that need clear visual content for blogs, social media, presentations, newsletters, and reports.

Who Is the Company Behind infographicAI?

InstaCharts

InstaCharts is a powerful online chart maker designed to transform complex spreadsheets into professional, interactive visualizations in seconds. Built for businesses, web publishers, and researchers, it eliminates the learning curve of complex BI tools, offering a streamlined, no-code solution for data storytelling. Whether you are looking to embed live data into a website or generate high-resolution reports, InstaCharts bridges the gap between raw data and actionable insights. Some key features include: * Instant Data Import & Sync - Stop manually updating static images. InstaCharts supports CSV, Excel, and JSON uploads, but its standout feature is its Google Sheets integration. Connect a sheet once, and your published charts will automatically update whenever you modify your data source. * Smart Visualization Engine - The platform uses intelligent algorithms to analyze your dataset and recommend the best visualization type. Choose from over 10 varieties, including Bar, Line, Area, Scatterplot, Pie, Radar, and Heatmap charts. * Fully Interactive Embeds - Engage your audience with interactive charts rather than flat pictures. When you embed an InstaChart on your website (via a simple Iframe or script), users can hover to see exact values, toggle legends to filter data series, and zoom in on specific timelines. All charts are fully responsive, ensuring they look perfect on mobile and desktop devices. * Deep Customization - Maintain brand consistency with ease. InstaCharts allows you to customize color palettes, fonts, axis labels, and tooltips. You can also create reusable chart templates to speed up your workflow for recurring reports. * Versatile Sharing Options : Embed: Copy-paste code for WordPress, Ghost, or any HTML site. Export: Download high-quality PNG or SVG files for presentations and PDFs. Public/Private: Share public links for broad distribution or secure, password-protected links for internal stakeholders. Why Choose InstaCharts? Unlike traditional spreadsheet software that produces static, clunky graphs, InstaCharts is built for the modern web. It combines the power of a data visualization tool with an easy to use interface. With features like Zapier automation and Google Drive integration, it is the ideal tool for anyone needing to visualize data fast.

Who Is the Company Behind InstaCharts?

Intrace

Intrace is one platform for protective risk intelligence and OSINT investigations, built for executive protection, due diligence, law enforcement, and other security teams. Collect and analyze open-source data, then turn it into actionable reports in minutes.

Who Is the Company Behind Intrace?

  • Seller: Intrace
  • HQ Location: N/A
  • Twitter: @intraceintel
  • LinkedIn® Page: www.linkedin.com
    1 employees on LinkedIn®

Isometric Technologies (ISO)

Isometric Technologies (ISO) is freight transportation performance management software that streamlines the data reconciliation process between manufacturers, transportation providers, and other 3rd party stakeholders in the supply chain. ISO acts as a single source of truth to measure the hidden costs of performance. By associating costs from chargebacks and service level failures to the responsible parties, ISO surfaces actionable insights that help optimize complex business relationships and identify negative trends in the supply chain.

Who Is the Company Behind Isometric Technologies (ISO)?

Who Uses This Product?

  • Company Size: 25% Small

ITLytics

ITLytics is a cost-effective data visualization platform that can be used by any business that has data of different types in a disparate form. ITLytics comes with easy-to-use charts and reports generation features that can be leveraged by the key stakeholders of the business to understand the aspects of their organization that need more attention. Users can quickly create data visualization on the ITLytics platform to analyze and make informed decisions.

Who Is the Company Behind ITLytics?

Bijou Barry
BB
Researched and written by Bijou Barry
Updated June 24, 2026