Ojin
Who Is the Company Behind Ojin?
- Seller: Journee Technologies GmbH
- HQ Location: Berlin, DE
-
LinkedIn® Page: www.linkedin.com
16 employees on LinkedIn®
Total Products under this Category: 597
Last updated: September 01, 2026
Why You Can Trust G2's Software Rankings:
G2's software rankings are built on verified user reviews, rigorous moderation, and a consistent research methodology maintained by a team of analysts and data experts. Each product is measured using the same transparent criteria, with no paid placement or vendor influence. While reviews reflect real user experiences, which can be subjective, they offer valuable insight into how software performs in the hands of professionals. Together, these inputs power the G2 Score, a standardized way to compare tools within every category.
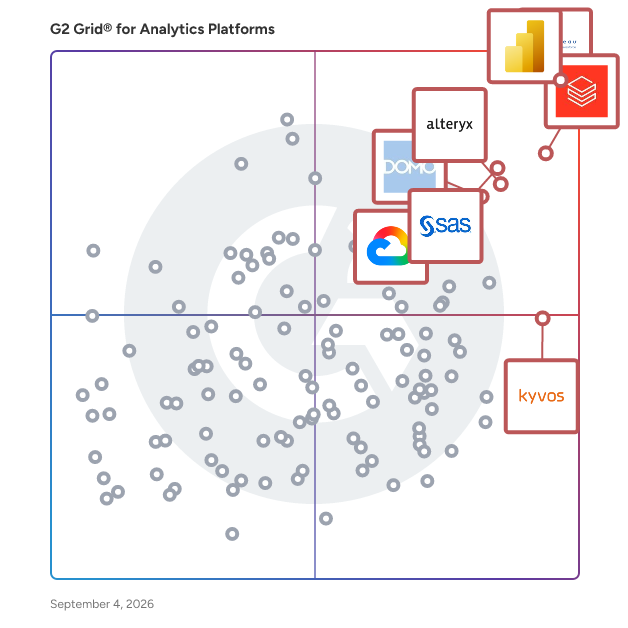
Highlighted products: Microsoft Power BI, Tableau, Databricks, SAS Viya, Alteryx, Domo, Looker, and Kyvos Semantic Layer.
Underlying data: [Grid® JSON](https://www.g2.com/categories/analytics-platforms/grids.json?focus%5B%5D=microsoft-microsoft-power-bi&focus%5B%5D=tableau&focus%5B%5D=databricks&focus%5B%5D=sas-sas-viya&focus%5B%5D=alteryx&focus%5B%5D=domo&focus%5B%5D=looker&focus%5B%5D=kyvos-semantic-layer)
Omnicontext™ Complete Analytic Platform for Digital Productivity and Technology Operations. Omnicontext™ is designed to collect, integrate, and analyse a wide range of distributed data sources to create a comprehensive view and detailed understanding of events, activities, and structures in organizations of any size. Data collection, consolidation and reporting to the users is fully automated. It can also operate as middleware, processing data for use by other applications. The OmniContext™ software produces numerous key indicators for productivity and operational performance.
Education Analytics is a cloud-based platform designed to provide actionable insights into critical performance metrics for educational institutions. It enables users to track and analyse data related to education and training (E&T) performance, apprenticeship provisions, and AAF metrics, offering real-time updates and customisable reporting. With its modern, user-friendly interface, the platform simplifies data management and supports evidence-based decision-making. Education Analytics is particularly suited for institutions looking to transition to scalable, secure cloud solutions. It offers features like online data imports, performance comparisons to national rates, and tools to identify at-risk metrics, ensuring institutions can proactively address challenges. By integrating AI-driven capabilities and fostering collaboration through dashboards and reports, the platform empowers education providers to optimise learning outcomes and streamline operations. With its focus on accessibility, innovation, and data-driven insights, Education Analytics is a valuable tool for modernising education management.
Open Architects is the integrated decision-making platform built specifically for K-12 school districts. We unify your student, HR, and finance data into a single source of truth, giving superintendents, business officials, HR directors, principals and educators the clarity they need to lead with confidence. Unlike point solutions that silo student outcomes from the operational decisions that drive them, Open Architects connects the dots across your entire district. Want to know whether your highest-need schools are also your most experienced-teacher schools? Whether your special education staffing aligns with enrollment trends? Whether your budget projections hold up against your five-year staffing plan? Open Architects answers these questions in minutes, not months. What's included: - Pre-built dashboards for student achievement, attendance, enrollment, staffing, finance, HR, and operations — designed by former district leaders who know what questions actually matter. Customizations are available. - MTSS intervention tools that unify academic, attendance, and behavior data to help teams identify at-risk students, plan interventions, and monitor progress across tiers - Archie, our K-12 AI assistant, who answers natural-language questions about your district's data and surfaces insights you didn't know to ask for - The Family Report, a school-to-home communication tool that gives parents transparent, actionable views of their child's progress - True data integration across your SIS, ERP, HRIS, assessment platforms, and state reporting systems Why districts choose Open Architects: Founded in 2017, we're family-owned and investor-free. Our founders are former district practitioners, and we serve 200+ districts across 12 states, growing primarily through word of mouth from superintendents who trust us. Our three uniques: 1. True Partner: we work alongside your team, not just sell you a license 2. All Your Data in One Place: student, HR, and finance, finally connected 3. Focus on Action: dashboards and insights designed to drive decisions, not just display data Who we serve: K-12 public school districts, charter schools, and regional/collaborative organizations ranging from small rural districts to large urban systems. We support districts in 12 states — including MA, CT, NJ, NY, CA, TX, IL, and WA — with new districts joining every quarter. If you're tired of stitching together spreadsheets, waiting weeks for a report, or making decisions on stale data — let's talk. Open Architects helps district leaders move from reactive reporting to proactive, integrated decision-making. Data to lead with clarity.
OpenText™ Magellan™ Integration Center offers the data integration capabilities neccesary to exchange data between all systems in an organization's IT environments and provides a basis for analyzing all enterprise information. With Magellan Integration Center, companies can access and consolidate disparate data and systems to feed data warehouses, operational data stores and analytic applications alongside corporate content repositories and new Web 2.0 technologies.
AI-powered commercial intelligence platform that unifies marketing, sales, and business data to deliver actionable insights and optimize business performance.
Papermap is an AI-native data platform that empowers CPG, D2C, and logistics brands to master their complex, data-intensive workflows, without writing a single line of SQL or Excel formulas. Unlock enterprise-grade analytics, real-time insights, and seamless decision-making for small teams.
Parable is a metrics and reporting platform built for Planning Center churches. It syncs data nightly across People, Giving, Check-Ins, Groups, Services, Registrations, and more — bringing everything into one unified dashboard so leaders can see attendance, giving, and engagement together for the first time. Parable's AI assistant lets staff ask questions in plain language: who hasn't returned after a visit, which small groups are growing, how giving this month compares to last year. Answers appear instantly — no exports, no filters, no spreadsheets required. Additional features include year-over-year comparisons, cohort tracking, engagement scoring, and forecasting. Multi-campus support is available on higher tiers. Power users get full SQL access and direct connections to Tableau, Power BI, and Google Sheets. Parable sits on top of Planning Center without replacing it. Setup takes about ten minutes. Built by people who've worked inside churches.
ParseBase: AI-Powered Client Reporting and CSV Analysis Software for Marketing Agencies, PPC Consultants, and Ecommerce Operators. ParseBase is an AI data analysis and client reporting platform that turns CSV, XLSX, JSON, and TSV files into branded presentations and trackable shared links, all in one workflow. It is a file-first alternative to Supermetrics, Looker Studio, AgencyAnalytics, Whatagraph, and Julius AI, built for non-technical users who need to analyze marketing and ecommerce data, build client-ready reports, and track viewer engagement without SQL, OAuth connectors, or stitching five tools together. The Problem ParseBase Solves Most marketing agencies and PPC consultants stitch together four or five tools to deliver one client report: a data connector to pull the numbers, a dashboard tool to visualize them, a spreadsheet for the analysis the dashboard cannot handle, a slide builder to make it client-ready, and a separate link tracker. The stack costs $300 to $500 per month, the numbers never reconcile across tools, and it consumes 3 to 8 hours per client per month. ParseBase replaces that stack with one flat workflow: Upload a CSV, XLSX, JSON, or TSV file Ask any question about your data in plain English Build a branded presentation with drag-and-drop Export as PDF or publish as a secure shared link Track which slides your client actually read No SQL. No OAuth connectors. No copy-paste between tools. Four Jobs, One Tool Analyze. Ask any question about your data in natural language. ParseBase writes the SQL for you and handles files up to 2GB with millions of rows. Built-in pattern detection for Google Ads, Meta Ads, TikTok Ads, Shopify, Stripe, and Amazon Seller exports. Report. Auto-generated insights run the moment you upload. 20+ pre-built insights each for Google Ads and Meta Ads, plus TikTok Ads, Shopify Orders, Shopify Transactions, Stripe Payments, and Amazon Settlement reports. Present. Drag-and-drop presentation builder. Pull charts and tables from multiple uploaded files into a single deck. Export to PDF or publish as a shared link. No copy-paste into Canva, Google Slides, or PowerPoint. Share and Track. Send a secure shared link instead of emailing a static PDF. OTP email authentication, password protection, and domain-restricted access gate the report to the right people. Slide-level analytics show who opened it, how long they spent on each slide, and where they dropped off. Key Features and Differentiators Append once, refresh forever. When next month's data arrives, append the new CSV to your existing file. Every chart, insight, KPI, presentation, and shared link updates automatically. What took 3 hours the first month takes 30 seconds every month after. No rebuilding, no reformatting, no resending links. Full white-label on every paid plan. Upload your logo, set your brand colors, pick your fonts. Every presentation and shared link goes out fully branded as your agency. No "Powered by ParseBase" watermarks on Pro. No white-label upcharge. No enterprise tier gate. Viewer analytics on every shared link. Slide-level time spent, drop-off tracking, and per-viewer session drill-downs, retained for 24 months. No other client reporting tool in this price range offers this depth. File-first, not API-first. Upload the CSV exports you already download from Google Ads, Meta Ads Manager, Shopify, Stripe, or Amazon Seller Central. No OAuth flows. No broken connectors. No API rate limits. Privacy by design and NDA-friendly. Only column structure and column names are sent to the AI model. Your row data never leaves ParseBase. Built for NDA-bound agency client work. Flat pricing, no scaling fees. Free plan (500MB, 25 AI queries). Starter $12.99/month (5GB, 150 queries). Pro $29.99/month (30GB, 1,500 queries, full white-label). No per-user, per-client, per-connector, or per-data-source fees. Costs do not scale with your client count. Free 14 days Pro account Trial. No credit card required. Built for real files. Millions of rows per file. Files up to 2GB. No 2MB upload caps. No 6-minute query timeouts. Who ParseBase Is For PPC consultants delivering monthly Google Ads, Meta Ads, and TikTok Ads reports to clients. Small and mid-size marketing agencies that need white-label client reporting without enterprise pricing. Ecommerce operators reconciling Shopify orders, Stripe payments, and Amazon Seller settlement data. Finance and operations teams analyzing exported data without bothering the data team. Anyone tired of rebuilding the same client report every month from scratch. ParseBase as an Alternative To ParseBase is commonly evaluated as an alternative to Supermetrics, Looker Studio, AgencyAnalytics, Whatagraph, DashThis, NinjaCat, Swydo, Julius AI, ChatGPT Advanced Data Analysis, and traditional BI tools for marketing agency reporting and ecommerce data analysis.
Add a sales-minded agent to your content. It gives each visitor a tailored demo, answers questions, and books next steps. It can even train your team.
