Best Agentic Analytics Software - Page 4

How Many Agentic Analytics Software Products Does G2 Track?

Total Products under this Category: 66

Category Stats (Oct 2026)

  • Average Rating: 4.56/5 The average rating of products in this category, based on all submitted ratings
  • Top Trending Product: Synopsis (+1.34%) - Among all products in this category, Synopsis recorded the largest rating increase compared to last month

Last updated: October 29, 2026

How Does G2 Rank Agentic Analytics Software Products?

Why You Can Trust G2's Software Rankings:

  • 30 Analysts and Data Experts
  • 8,800+ Authentic Reviews
  • 66+ Products
  • Unbiased Rankings

G2's software rankings are built on verified user reviews, rigorous moderation, and a consistent research methodology maintained by a team of analysts and data experts. Each product is measured using the same transparent criteria, with no paid placement or vendor influence. While reviews reflect real user experiences, which can be subjective, they offer valuable insight into how software performs in the hands of professionals. Together, these inputs power the G2 Score, a standardized way to compare tools within every category.

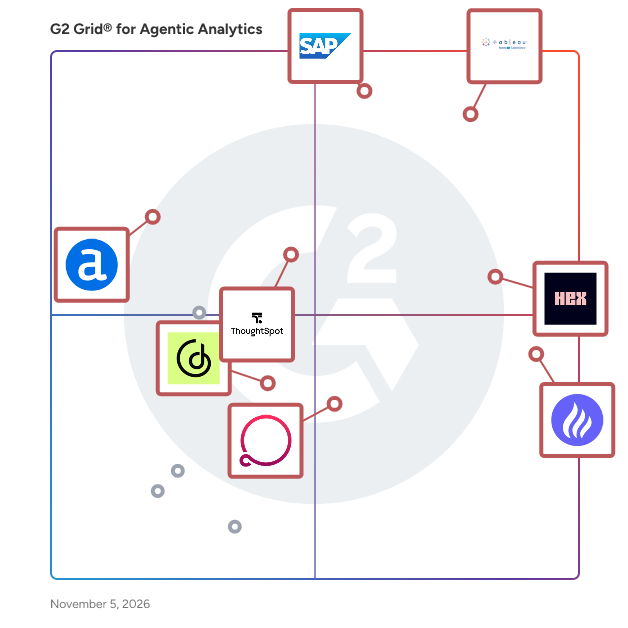
G2 Grid® for Agentic Analytics Software

G2 Grid® for Agentic Analytics Software plotting products by satisfaction and market presence

Highlighted products: Tableau, Joule, Hex, BlazeSQL, ThoughtSpot, Alteryx, Unsupervised, and GoodData.AI.

Underlying data: [Grid® JSON](https://www.g2.com/categories/agentic-analytics/grids.json?focus%5B%5D=tableau&focus%5B%5D=joule&focus%5B%5D=hex-tech-hex&focus%5B%5D=blazesql&focus%5B%5D=thoughtspot&focus%5B%5D=alteryx&focus%5B%5D=unsupervised&focus%5B%5D=gooddata-ai)

Integly.cloud

Integly.cloud is an AI business intelligence platform that transforms your connected data into actionable insights through natural language conversations. Instead of building reports or searching through dashboards, simply ask questions like "Why did traffic drop?" or "Which products generated the highest profit last month?" and receive clear, contextual answers. Connect Google Analytics 4, e-commerce platforms, CRMs, ERP systems, and other business tools to monitor performance, detect anomalies, and automate reporting—all in one place.

Who Is the Company Behind Integly.cloud?

  • Seller: Integly
  • Year Founded: 2026
  • HQ Location: Stalowa Wola, PL
  • LinkedIn® Page: www.linkedin.com
    1 employees on LinkedIn®

Kater

Kater is an AI-powered platform designed to transform complex data into actionable insights, enabling businesses to make informed decisions efficiently. By integrating structured decision trees with a unified data model, Kater guides users through data analysis processes, eliminating the need for static dashboards and reducing reliance on data teams. This approach ensures that stakeholders can interpret data effectively and take decisive actions based on clear insights. Key Features and Functionality: - Data Playbooks: Structured decision trees that guide users through insights, highlighting what matters and suggesting next steps, thereby eliminating guesswork in data interpretation. - Butler AI: An AI assistant that provides self-serve answers to follow-up questions, capturing business logic as an analyst would explain, reducing ambiguity and back-and-forth with data teams. - Unified Data Model: Ensures consistency and trustworthiness by using a shared semantic layer, so all users work off the same definitions and logic, preventing discrepancies in data interpretation. - Business Question Mapping: Intuitive navigation through Playbooks structured like business conversations, mirroring natural problem-solving approaches without requiring extensive data knowledge. - Security Measures: Enterprise-scale security with SOC 2 compliance, ISO 27001 certification, encrypted data in transit and at rest, and secure credential storage, ensuring data privacy and compliance. Primary Value and Problem Solved: Kater addresses the common challenge where businesses know what is happening through data but struggle to interpret it to drive actions. By providing structured decision trees and an AI assistant, Kater empowers stakeholders to ask the right questions, interpret data accurately, and make proactive decisions without constant reliance on data teams. This leads to more efficient decision-making processes, reduced delays, and a clearer path from data insights to actionable outcomes.

Who Is the Company Behind Kater?

  • Seller: Kater
  • Year Founded: 2023
  • HQ Location: Los Angeles, US
  • LinkedIn® Page: www.linkedin.com
    5 employees on LinkedIn®

Mitzu

Mitzu is an agentic analytics platform that connects directly to your data warehouse and answers business questions autonomousl. No SQL, no tickets, no waiting. Ask anything in plain English and Mitzu generates and executes the query live on your Snowflake, BigQuery, Redshift, or Databricks instance, then returns explainable answers with full SQL transparency. Beyond answering ad-hoc questions, Mitzu proactively monitors your KPIs and delivers anomaly alerts via email or Slack. Product, marketing, and revenue teams can explore funnels, cohorts, retention, and user journeys without involving a data analyst. Enterprise-ready with self-hosting, SSO, and GDPR/HIPAA compliance. From connection to first insight in under 10 minutes.

Average Rating: 4.8/5.0

Total Reviews: 8

Who Is the Company Behind Mitzu?

  • Seller: Mitzu
  • Year Founded: 2022
  • HQ Location: San Francisco, US
  • LinkedIn® Page: www.linkedin.com
    7 employees on LinkedIn®

Who Uses This Product?

  • Company Size: 88% Small, 13% Medium

What Do G2 Reviewers Say About Mitzu?

AI-generated summary from verified user reviews

Pros
  • Users love the intuitive interface and efficient analytics capabilities of Mitzu, making insights accessible for everyone.
  • Users value the seamless analytics integration of Mitzu, enabling efficient data handling and insightful self-service capabilities.
  • Users commend Mitzu's exceptional customer support, highlighting prompt, empathetic responses that enhance their experience significantly.
  • Users appreciate the easy integrations of Mitzu, enhancing data management without disrupting existing workflows.
  • Users value Mitzu's insights-driven approach, enabling self-service and seamless integration for effective decision-making and data management.
Cons
  • Users find that the usability can be confusing, wishing for a more straightforward experience with Mitzu.
  • Users feel that Mitzu's display issues detract from its overall user experience compared to competitors like Mixpanel.
  • Users note that event listing and user profile features are missing, though updates are being released weekly.
  • Users feel that Mitzu's user experience is not intuitive, lacking the polish of competitors like Mixpanel or Amplitude.
  • Users feel that Mitzu lacks clear usability, making it fall short compared to competitors like Mixpanel and Amplitude.

What Are Recent G2 Reviews of Mitzu?

AI can help you find the answers. G2 helps you trust them.

Connect G2 to Claude or ChatGPT for answers grounded in G2's trusted reviews, comparisons, and pricing from real user insights.

How it works

Nakisa Decision Intelligence

Nakisa Decision Intelligence (NDI) is an enterprise-grade agentic AI platform that transforms fragmented enterprise data into confident decisions and executable actions in minutes. Combining explainable, business-aware AI with natural-language interaction, NDI removes decision bottlenecks, giving leaders instant answers, context, and recommended actions without technical barriers or lengthy analysis cycles. The result is lower costs, reduced risks, and stronger organizational performance. NDI unifies, interprets, and analyzes internal and external data in real time, enabling leaders to ask complex questions and explore what-if simulations, forecasts, and interactive analytics via text or voice. It delivers prioritized recommendations grounded in benchmarks, internal policies, financial rules, and strategic goals, supported by transparent, auditable decision logic and enterprise-grade governance. Approved decisions can be executed via Nakisa AI agents connected to ERP and HCM systems.

Who Is the Company Behind Nakisa Decision Intelligence?

  • Seller: Nakisa
  • Year Founded: 1990
  • HQ Location: Montreal, CA
  • Twitter: @NakisaInc
    1,587 Twitter followers
  • LinkedIn® Page: www.linkedin.com
    310 employees on LinkedIn®

Narrative BI

Whether you're a small startup or a large enterprise, Narrative BI provides a comprehensive solution to transform complex data into compelling narratives that drive informed decision-making. Narrative BI goes beyond traditional BI tools by transforming data into understandable narratives. By contextualizing complex data points, we empower our users to grasp insights quickly and make data-driven decisions confidently. It is designed for growth, marketing, product teams, and marketing agencies. With Narrative BI, you can: - Save significant time and resources spent on manual report generation with automated reporting capabilities. - Share dashboards, reports, and visualizations with colleagues, clients, or stakeholders, fostering a collaborative and data-driven decision-making culture. - Compare marketing data at a glance to identify patterns and predict consumer behavior. - Monitor ad performance to identify the best-performing acquisition channels.

Who Is the Company Behind Narrative BI?

Navi

Navi OS is a self-correcting AI analyst that turns natural language questions into complete data analyses — charts, calculations, and written insights — in seconds. Unlike generic AI chatbots, Navi runs a structured execution engine: it writes Python code for your specific question, runs it, catches any errors, and fixes them automatically without you doing anything. Ask a question, get a verified answer. Built for data analysts, founders, and financial professionals who have data and need access to insights quickly. Upload a CSV or Excel file and ask anything — trend analysis, cohort breakdowns, revenue forecasting, risk assessment. Connect your AWS S3 bucket for persistent data access. Create specialized AI analysts (subagents) with custom personas for recurring workflows. Access the full analysis engine programmatically via the developer API. No SQL required. No dashboards to configure. Just ask.

Who Is the Company Behind Navi?

Olakai

Olakai is an enterprise AI analytics and governance platform that gives organizations vendor-neutral visibility into AI usage, measurable ROI, and governance controls across chatbots, copilots, autonomous agents, and AI-enabled SaaS applications. It provides a unified view where individual AI vendor dashboards — from OpenAI to Microsoft to Google — only show siloed data for their own tools. Enterprises today use dozens of AI tools simultaneously, each with its own analytics (or none at all). This fragmentation makes it impossible to answer basic questions: What's our total AI ROI? What risks are we exposed to? Which tools should we scale and which should we cut? Olakai consolidates this data into a single platform that both technical and business teams can use. The platform covers two categories of enterprise AI through dedicated product modules: - Agent IQ provides real-time analytics for agentic AI — autonomous agents, multi-step workflows, and custom automations — including execution metrics, cost-per-execution analysis, success/failure rates, and custom KPIs tied to specific business outcomes. - Assistive IQ delivers analytics and governance for assistive AI — chatbots, copilots, and AI features embedded in SaaS — covering productivity measurement, shadow AI detection, adoption tracking, and content policy enforcement. - Kai, the platform's conversational intelligence layer, lets any user ask questions about their AI program in natural language and receive data-backed answers with transparent reasoning, scenario modeling, and actionable recommendations. - Shadow AI detection discovers unauthorized AI tool usage across the organization before it becomes a security or compliance risk. - Custom KPIs allow teams to define application-specific or workflow-specific metrics that connect AI activity directly to business outcomes like time saved, cost reduced, or revenue influenced. Olakai deploys through a Chrome browser extension for enterprise-wide assistive AI monitoring, SDKs (TypeScript and Python) for instrumenting custom agents and workflows, a CLI for developer tool integration, and a dashboard designed for CIO and CAIO-level reporting. The platform is used by enterprise IT leaders, CISOs, CFOs, and AI program managers to prove AI value, govern risk without blocking adoption, control costs across vendors, and make data-driven decisions about which AI investments to scale.

Who Is the Company Behind Olakai?

  • Seller: Olakai
  • Year Founded: 2024
  • HQ Location: Mountain View, US
  • LinkedIn® Page: www.linkedin.com
    10 employees on LinkedIn®

Omni

Who Is the Company Behind Omni?

  • Seller: Omni Analytics, Inc
  • Year Founded: 2022
  • HQ Location: San Francisco, CA
  • Twitter: @omni
    4,282 Twitter followers
  • LinkedIn® Page: www.linkedin.com
    920 employees on LinkedIn®

PlotStudio AI

PlotStudio AI is a desktop application for agentic data analysis. Users upload a dataset and ask questions in plain English, and the software uses a set of coordinated AI agents to carry out the analysis. The agents handle distinct roles, including routing the query, planning the analytical approach, writing and executing Python code, and synthesizing the results into a written report. The system runs multiple iterations, self-correcting its code until the analysis completes, and produces output that includes visualizations, statistical tests, tables, and a narrative interpretation of the findings. When a dataset is uploaded, PlotStudio profiles it, scores its data quality, and generates a cleaning plan describing what to drop or preserve. Each question a user asks produces a structured analysis page that is saved in the workspace, remains accessible over time, and can be referenced by the AI when answering later questions. A Verification Mode lets users review the AI's analysis plan before it runs, ask why a particular method was chosen, propose an alternative methodology, edit the plan in plain English, view a summary of changes, and undo edits. PlotStudio includes domain-specific capabilities across 12 specializations and can detect the relevant field from the data or accept up to two domains selected by the user, applying methods such as instrumental variable estimation, GARCH, and Cox proportional hazards where appropriate. The application also provides an interactive data explorer, suggested questions, multiple analysis modes, cross-analysis insights, and data lineage tracking. Analysis runs on the user's own machine, and PlotStudio does not see, store, or access the underlying data; AI calls are sent directly from the user's device to the model provider's API. Enterprise users can connect their own Azure OpenAI instance. Completed analyses can be exported as PDF reports with embedded charts and equations or as Jupyter notebooks containing the code and outputs. PlotStudio supports a range of file formats, does not require knowledge of Python or SQL, and is built by AR5 Labs LLC.

Who Is the Company Behind PlotStudio AI?

  • Seller: AR5 Labs
  • Year Founded: 2026
  • HQ Location: San Fracisco, CA
  • LinkedIn® Page: www.linkedin.com
    1 employees on LinkedIn®

Prompt

Prompt Studio is an AI-powered platform designed to democratize data analysis and visualization within organizations. By enabling users to interact with data through natural language queries, it eliminates the need for complex coding, making data insights accessible to individuals regardless of their technical expertise. This approach allows teams to swiftly address complex, ad hoc questions without relying on static dashboards. Key Features and Functionality: - Promptbooks: Create AI-first, smart notebooks that facilitate collaborative data analysis. Users can input data questions in natural language and receive immediate insights and visualizations. - Data Integration: Connect directly to databases or upload data files, allowing real-time access and the ability to combine multiple data sources for comprehensive analysis. - Interactive Visualizations: Generate dynamic visual representations of data without writing code, simplifying the process of interpreting complex datasets. - Semantic Model Building: Utilize AI-supported workflows to construct semantic models efficiently, reducing the time and effort typically required. - Process Transparency: Review the AI's thought process, including generated code and SQL queries, ensuring transparency and reliability in data analysis. Primary Value and Problem Solved: Prompt Studio addresses the challenge of making data analysis accessible to all team members, regardless of their technical background. By allowing users to pose questions in natural language and receive immediate, accurate insights, it empowers organizations to make data-driven decisions swiftly. This capability reduces dependence on predefined dashboards and technical personnel, fostering a more agile and informed decision-making process.

Who Is the Company Behind Prompt?

PushMetrics

Scalable Reporting Workflows. Data-driven Alerting. Automate all your recurring reports and send the right insights at the right time. From simple bursting to complex alerting workflows: Deliver pixel perfect reports via email or Slack to audiences of any size.

Average Rating: 4.3/5.0

Total Reviews: 14

Who Is the Company Behind PushMetrics?

Who Uses This Product?

  • Company Size: 64% Small, 29% Medium

What Are Recent G2 Reviews of PushMetrics?

Pyramid Analytics

One unified analytics platform — everything built-in, for every user, and ready for what’s next.

Who Is the Company Behind Pyramid Analytics?

  • Seller: Pyramid Analytics
  • Year Founded: 2008
  • HQ Location: Amsterdam
  • Twitter: @PyramidAnalytic
    10,219 Twitter followers
  • LinkedIn® Page: www.linkedin.com
    100 employees on LinkedIn®

Qlik Cloud Analytics

Qlik Cloud Analytics is a comprehensive, cloud-based analytics platform designed to empower organizations to make data-driven decisions efficiently. Built on Qlik's unique Associative Engine, it enables users to explore and analyze data from multiple sources, uncovering insights that traditional query-based tools might miss. The platform supports self-service analytics, interactive dashboards, and advanced AI capabilities, facilitating a collaborative and informed decision-making process across the enterprise. Key Features and Functionality: - Interactive Analytics: Users can interact with data, ask questions, and search freely to understand relationships within their datasets. - Agentic AI Assistant: Provides contextually relevant answers to open-ended questions through unique agentic reasoning, enhancing productivity and decision-making. - Predictive AI: Empowers business teams to transform historical data into predictive insights, enabling proactive strategies. - Data Preparation: Offers no-code data preparation tools, simplifying the process of bringing together data from various sources. - Embedded Analytics: Allows embedding of AI assistants directly into applications and workflows, delivering insights where work happens. - Reporting and Automation: Facilitates automated report generation and distribution, as well as workflow automation to drive action across applications. Primary Value and Solutions Provided: Qlik Cloud Analytics addresses the challenge of disparate data silos by offering centralized access to data and analytics tools, enhancing data-driven decision processes. It reduces the manual effort required to find critical information, accelerates decision-making, and prepares organizations to seamlessly adopt advanced AI capabilities. By integrating data from various sources and providing real-time insights, it enables businesses to unlock new opportunities, streamline operations, and maintain a competitive edge in their respective industries.

Who Is the Company Behind Qlik Cloud Analytics?

  • Seller: Qlik
  • Year Founded: 1993
  • HQ Location: Radnor, PA
  • Twitter: @qlik
    64,130 Twitter followers
  • LinkedIn® Page: www.linkedin.com
    4,399 employees on LinkedIn®
  • Phone: 1 (888) 994-9854

RevForge OS

RevForge OS is the Predictive Intelligence Platform for Contractors. It brings marketing, sales, operations and finance into one business context so owners and teams can see what changed, understand what it affects, anticipate risks and opportunities, and decide what to do next. Rev, the platform's intelligence operator, connects signals across the company. A shift in demand can inform lead priorities, property scope, pricing, crew capacity, margin and cash—not just produce another report. Depending on the package and permissions, Rev recommends for approval, prepares work, or carries out authorized actions within owner-defined limits. Outcomes inform the next decision. Owner Core provides the whole-business view. Marketing, Sales, Operations and Finance Forges organize specialized IQs for demand, campaigns, customers, pipeline, TrueScale property intelligence, quoting, teams, dispatch, inventory, job margins, collections, cash and business value. Customer records, communications, scheduling, estimates, jobs, invoicing and payments support that intelligence throughout the workflow. Built around 21 contractor trades, RevForge OS serves solo operators, growing teams and multi-location businesses. It is not limited to predictive analytics, CRM or field-service management: those capabilities work together inside a contractor-specific predictive intelligence platform. Your company. Built to think ahead.

Who Is the Company Behind RevForge OS?

Shalaka Joshi
SJ
Researched and written by Shalaka Joshi
Updated January 28, 2026