Best Diagramming Software - Page 11

How Many Diagramming Software Products Does G2 Track?

Total Products under this Category: 163

Category Stats (Sep 2026)

  • Average Rating: 4.41/5 (↑0.01 vs Aug 2026) The average rating of products in this category, based on all submitted ratings
  • Top Trending Product: Kumu (+12.5%) - Among all products in this category, Kumu recorded the largest rating increase compared to last month

Last updated: September 01, 2026

How Does G2 Rank Diagramming Software Products?

Why You Can Trust G2's Software Rankings:

  • 30 Analysts and Data Experts
  • 34,300+ Authentic Reviews
  • 163+ Products
  • Unbiased Rankings

G2's software rankings are built on verified user reviews, rigorous moderation, and a consistent research methodology maintained by a team of analysts and data experts. Each product is measured using the same transparent criteria, with no paid placement or vendor influence. While reviews reflect real user experiences, which can be subjective, they offer valuable insight into how software performs in the hands of professionals. Together, these inputs power the G2 Score, a standardized way to compare tools within every category.

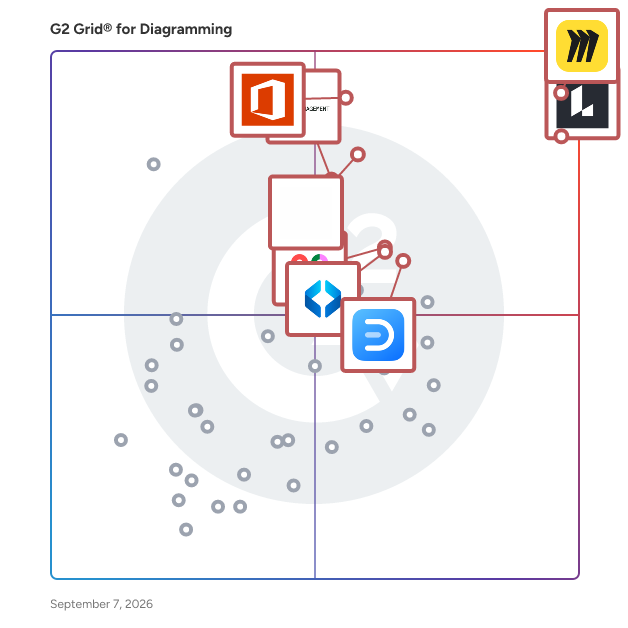
G2 Grid® for Diagramming Software

G2 Grid® for Diagramming Software plotting products by satisfaction and market presence

Highlighted products: Miro, Lucid Visual Collaboration Suite, Visio, FigJam, Cvent Event Marketing & Management, Mural, Wondershare EdrawMax, and SmartDraw.

Underlying data: [Grid® JSON](https://www.g2.com/categories/diagramming/grids.json?focus%5B%5D=miro&focus%5B%5D=lucid-software-inc-lucid-visual-collaboration-suite&focus%5B%5D=visio&focus%5B%5D=fig-jam&focus%5B%5D=cvent-event-marketing-management&focus%5B%5D=mural&focus%5B%5D=wondershare-edrawmax&focus%5B%5D=smartdraw)

Sankey Flow Show

Sankey Flow Show is a modern webapp for drawing flow diagrams and Sankey diagrams directly in your browser.

Who Is the Company Behind Sankey Flow Show?

Simulaction

Simulaction is a browser-based animated diagram and flowchart maker for software teams. Create diagrams visually or import Mermaid and D2, then animate requests, decisions, state changes, camera movement, and data flow along connections. Present architecture, processes, incidents, and onboarding scenarios as guided step-by-step walkthroughs. Free accounts can save, present, and export PNG or SVG diagrams; Pro adds video and GIF export plus hosted, revocable share links.

Who Is the Company Behind Simulaction?

StructureFlow

Effortless visualization for business professionals. Transform the way you create structure charts, step plans, timelines, and process maps to help you navigate complexity with confidence and precision.

Who Is the Company Behind StructureFlow?

Sysonaut Draw

Sysonaut is a cloud and data center architecture diagramming tool built for Solution Architects, Cloud Architects, Presales Engineers, Consultants, and Enterprise IT teams. Create professional architecture diagrams using a consistent visual language across AWS, Azure, Google Cloud, Kubernetes, VMware, networking, and on-premises infrastructure. Build reusable custom components, standardize diagrams across projects, and produce presentation-ready visuals for documentation, workshops, proposals, and technical design. Unlike infrastructure discovery tools, Sysonaut is designed for human-created diagrams that communicate architecture clearly to customers, stakeholders, and engineering teams. Sysonaut supports local-first workflows, allowing sensitive diagrams to remain on your device while still offering cloud synchronization when needed.

Who Is the Company Behind Sysonaut Draw?

Timblee

Timblees user flow diagrams (in beta) and visual sitemaps (not in beta) will help you design better user experience from day one of your web or mobile project long before you create a single design, or start development.

Who Is the Company Behind Timblee?

  • Seller: Timblee
  • Year Founded: 2015
  • HQ Location: Sydney, AU
  • LinkedIn® Page: www.linkedin.com
    1 employees on LinkedIn®

ToDiagram

ToDiagram is a data visualization tool and an editor that transforms complex data formats like JSON, CSV, YAML, and XML into interactive, easy-to-navigate diagrams in seconds. It offers users an intuitive way to explore, edit, and understand their data visually, without getting lost in raw code.

Who Is the Company Behind ToDiagram?

Vecta

Vecta is a web-based collaborative diagramming tool.

Who Is the Company Behind Vecta?

  • Seller: Vecta
  • HQ Location: Sheffield, England
  • Twitter: @Vectaio
    137 Twitter followers
  • LinkedIn® Page: www.linkedin.com
    1 employees on LinkedIn®

Who Uses This Product?

  • Company Size: 100% Small

What Are G2 Users Discussing About Vecta?

Visible Analyst

Whether you are designing e-business applications, developing a data warehouse, or integrating your legacy systems with new enterprise applications; Visible Analyst has all the power you need. Visible Analyst enables true enterprise application engineering by storing and documenting data, processes, business requirements, and objects that can be shared by application developers throughout an organization. The result: you can more easily design and control enterprise software for quality, consistency, and reusability in business applications through the managed sharing of meta-data. All editions support concurrent multi-user access. Learn more about Visible Analyst at: https://visiblesystemscorp.com/Products/Analyst/index.htm

Who Is the Company Behind Visible Analyst?

  • Seller: VISIBLE Systems
  • Year Founded: 2019
  • HQ Location: Boston, US
  • Twitter: @VISIBLECorp
    58 Twitter followers
  • LinkedIn® Page: www.linkedin.com
    8 employees on LinkedIn®

WireFlow

WireFlow is cloud-based diagram software for audio-visual and live event preproduction planning. It enables the creation of signal flow diagrams, rack elevations, LED wall layouts, and cable schedules in one workspace. Connection-aware validation prevents setup errors by ensuring compatible cable types and accurate port matching for HDMI, SDI, XLR, RJ45, USB, DMX, DisplayPort, Dante, NDI, and fiber connections. Devices can be positioned and connected port-to-port with automatic validation. WireFlow generates exportable cable schedules, bills of materials, and PDF documentation. Features include an LED wall builder for cabinet grids, pixel mapping, and power planning, plus a rack elevation tool with labeled front and rear views. Zone mapping designates stage and control areas. Cloud autosave syncs work across devices, while share links allow read-only project viewing. Team workspaces enable shared editing, project chat, and inventory tracking.

Who Is the Company Behind WireFlow?

Neeraja Prakash
NP
Researched and written by Neeraja Prakash
Updated October 3, 2024