TapTarget
Who Is the Company Behind TapTarget?
- Seller: TapTarget
- Year Founded: 2019
- HQ Location: Poeldijk, NL
-
LinkedIn® Page: www.linkedin.com
19 employees on LinkedIn®
Total Products under this Category: 762
Last updated: November 01, 2026
Why You Can Trust G2's Software Rankings:
G2's software rankings are built on verified user reviews, rigorous moderation, and a consistent research methodology maintained by a team of analysts and data experts. Each product is measured using the same transparent criteria, with no paid placement or vendor influence. While reviews reflect real user experiences, which can be subjective, they offer valuable insight into how software performs in the hands of professionals. Together, these inputs power the G2 Score, a standardized way to compare tools within every category.
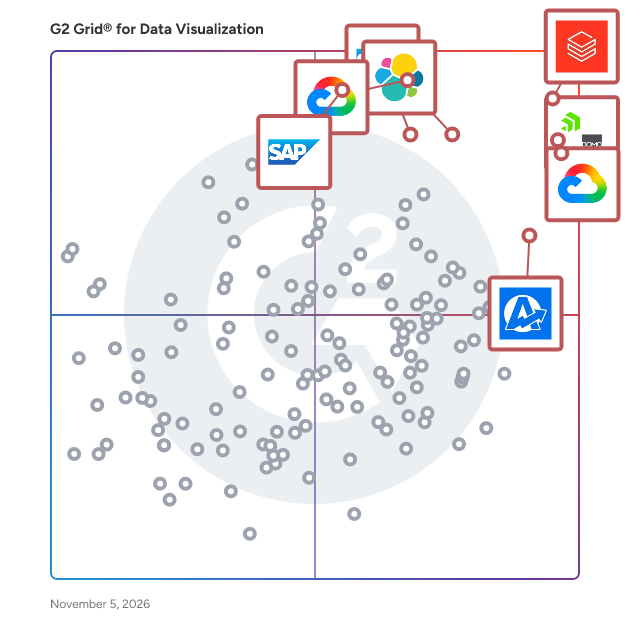
Highlighted products: Databricks, Domo, Looker, Data Studio, Elastic Stack, AgencyAnalytics, SAP HANA Cloud, and SAP Analytics Cloud.
Underlying data: [Grid® JSON](https://www.g2.com/categories/data-visualization-tools/grids.json?focus%5B%5D=databricks&focus%5B%5D=domo&focus%5B%5D=looker&focus%5B%5D=data-studio&focus%5B%5D=elastic-stack&focus%5B%5D=agencyanalytics&focus%5B%5D=sap-hana-cloud-2025-10-01&focus%5B%5D=sap-analytics-cloud&segment=all)
Create and share all kinds of highly visual and customizable charts directly on your Confluence pages.
Uniting data from marketing, sales, operations and finance systems and gluing it together with public datasets to create an enriched, trustworthy single view; Used by the next generation of British ecommerce retailers, The Data Refinery is designed to help everyone in ecommerce understand what is driving good and bad performance, and make better decisions in a really simple way.
Average Rating: 5.0/5.0
Total Reviews: 1
"transforming and enriching data to improve its quality and facilitate its analysis."
Rating: 5.0/5.0 stars
— Serkan V.
Connect G2 to Claude or ChatGPT for answers grounded in G2's trusted reviews, comparisons, and pricing from real user insights.
The Owl Solutions offers a comprehensive supply chain analytics platform tailored for mid-sized manufacturers, enabling enhanced visibility, risk reduction, and financial gains through actionable insights derived from data-driven approaches.
ThingWorx is an industrial intelligence platform that helps manufacturers transform industrial data into intelligent action. It connects and contextualizes data from machines, systems, and enterprise applications to create a trusted foundation for real-time visibility, faster decisions, and scalable innovation. Key capabilities include: • Connecting and contextualizing industrial data • Providing real-time operational visibility • Accelerating application development • Optimizing performance with advanced analytics • Deploying AI-ready solutions with confidence • Scaling industrial innovation across the enterprise Purpose-built solutions support connected work, production performance monitoring, asset monitoring and utilization, digital performance management, and connected field assets. By bringing operational data, workflows, analytics, and applications together, ThingWorx helps industrial teams improve productivity, uncover performance opportunities, and turn insights into action across the enterprise.
Average Rating: 3.9/5.0
Total Reviews: 22
AI-generated summary from verified user reviews
"Rapid App Development with Strong OT/IT Connectivity and Real-Time Analytics"
Rating: 4.0/5.0 stars
— Vishal D.
"Review for Thingworx Asset Monitoring and Utilization"
Rating: 4.5/5.0 stars
— Chirag P.
Think Blue Data is a software development company specializing in transforming complex datasets into intuitive and insightful visualizations. Established in 2012, the company offers tailored solutions that integrate seamlessly with clients' existing data and document management systems, ensuring alignment with their unique branding and style. Key Features and Functionality: - Insightful Visualizations: Utilizes interactive maps, charts, and diagrams to simplify and explore large datasets. - Engaging Storytelling: Employs customized views and animated transitions to highlight key insights. - Streamlined Workflows: Develops well-defined UX/UI designs and prototypes to enhance data preparation and management. - Data Migration: Facilitates easy migration and export of data into desired formats. - Simplified Views: Transforms raw data into user-friendly interfaces. - Custom Branding: Applies clients' brand identities to all solutions. Primary Value and Solutions: Think Blue Data addresses the challenges of managing and interpreting complex, data-rich information by providing interactive and customized software solutions. Their services enhance productivity, offer deeper insights, and increase the impact of data through user-friendly visualizations and efficient workflows. By aligning solutions with clients' branding and operational needs, Think Blue Data ensures that organizations can effectively harness their data for informed decision-making and strategic planning.
Timegate is a global workforce management solution by TEAM Software that improves performance while reducing cost and risk for security, cleaning and facilities management companies. Improve time and attendance and workforce data through telephone solutions and biometric tools, and offer flexible scheduling and rostering options with real-time data, dashboards and reporting. With employee engagement, recruitment, finance, insights and service delivery packs available, manage contracts and employees while delivering on the agreed upon points of your customers' service-level agreements. Learn more at https://teamsoftware.com/software/timegate/.
Average Rating: 5.0/5.0
Total Reviews: 1
"Auditing and Staff Management"
Rating: 5.0/5.0 stars
— Carl T.
Timetoast is a timeline maker for teams, educators, and professionals who need to turn events, milestones, and plans into clear, shareable timelines. Create project timelines, roadmaps, historical overviews, research timelines, and visual plans using structured data, custom fields, a spreadsheet-style grid, and multiple views, including horizontal timeline, vertical timeline, and grid view. Timetoast is simple enough for quick timelines, but flexible enough for business planning, education, research, and public-facing storytelling.
TinyKPI puts your business numbers in one tiny dashboard around your Mac’s notch. Connect Stripe, Google Analytics, Clerk, PostHog, your databases and more. See revenue, traffic, customers and the KPIs you care about without jumping between dashboards. 100% Local, Your data stays on your Mac. Big picture. Tiny space.
Dashboards from natural-language questions. The AI only generates the query and never sees your data: schema-only or on-premise, GDPR-compliant. Every figure comes from the database, no hallucinated values.
TolaData is a monitoring and evaluation (M&E) software for NGOs and Social Enterprises. Built by a team of experienced NGO professionals, data scientists and tech innovators, TolaData harnesses the latest in technology to make M&E simpler, effective and accessible for all. Our versatile tools enable organisations to manage the complete indicator workflow in one platform - from data collection, management and analysis to designing a results framework and indicator plan to reporting progress in real time. Organisations are thus empowered to measure project performance, demonstrate results on the ground and create positive impact.
View all your KPIs in one dashboard. Overlay graphs and see correlations.
Beautiful dashboards using AI Tower generates dashboards for you using AI. Just point it to your data and see the magic happen. You can chat with your charts to modify them or generate new charts. You can also add and modify the data for the charts by just chatting. No need to memorize complex formulae. Powered by a modern Gen AI tech stack, Tower is fast and dependable so that you can get the reports you need when you need them.
