PracticePro 365
Who Is the Company Behind PracticePro 365?
- Seller: PracticePro 365
- HQ Location: N/A
-
LinkedIn® Page: www.linkedin.com
1 employees on LinkedIn®
Total Products under this Category: 762
Last updated: November 01, 2026
Why You Can Trust G2's Software Rankings:
G2's software rankings are built on verified user reviews, rigorous moderation, and a consistent research methodology maintained by a team of analysts and data experts. Each product is measured using the same transparent criteria, with no paid placement or vendor influence. While reviews reflect real user experiences, which can be subjective, they offer valuable insight into how software performs in the hands of professionals. Together, these inputs power the G2 Score, a standardized way to compare tools within every category.
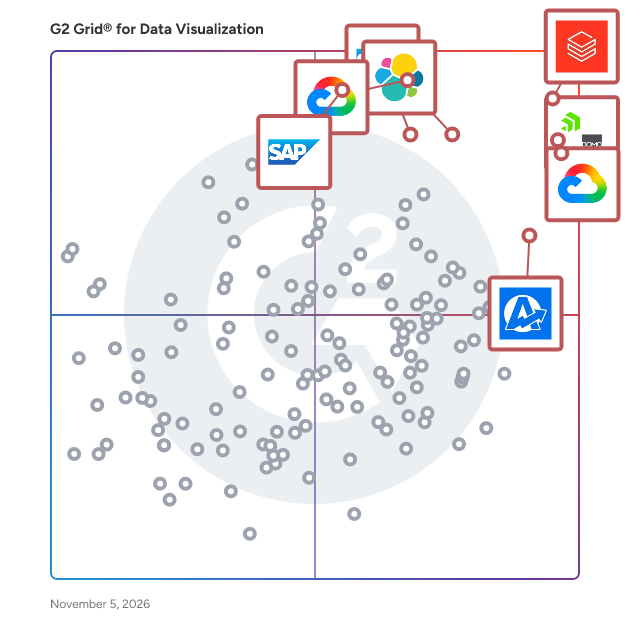
Highlighted products: Databricks, Domo, Looker, Data Studio, Elastic Stack, AgencyAnalytics, SAP HANA Cloud, and SAP Analytics Cloud.
Underlying data: [Grid® JSON](https://www.g2.com/categories/data-visualization-tools/grids.json?focus%5B%5D=databricks&focus%5B%5D=domo&focus%5B%5D=looker&focus%5B%5D=data-studio&focus%5B%5D=elastic-stack&focus%5B%5D=agencyanalytics&focus%5B%5D=sap-hana-cloud-2025-10-01&focus%5B%5D=sap-analytics-cloud&segment=all)
A solution that continuously analyses key operational data in real-time against your predetermined metrics. Instantly alerting business prior to any customer impact.
ProfilelyAI is an AI-powered customer insights platform that simplifies market understanding by turning real-time data into actionable strategies. It provides tailored, role-specific intelligence to help businesses make smarter, faster decisions. ProfilelyAI makes understanding customers and market trends easy, fast, and affordable. It’s designed for teams without large research budgets, offering clear, strategic insights instead of just raw data. The platform uses AI and Large Language Models to analyze up-to-date information from across the web, generating comprehensive, personalized reports. It’s a practical, modern alternative to traditional market research, helping business owners, marketers, and consultants prepare for what’s next with confidence. How It Works? Tell Us Who You Are Select your role and objective (e.g., Business Owner – Grow my business) via intuitive dropdowns. This helps tailor the experience to your specific needs. Customize Your Inputs Refine your report with filters like industry, target audience, company size, and region — ensuring insights are directly relevant to your business. Get Real-Time Insights ProfilelyAI uses advanced deep research tech and Large Language Models to analyze live data across the web, delivering up-to-date, high-quality market intelligence. Act with Confidence Use the report’s strategic recommendations to make smarter decisions, improve customer engagement, and grow your business with clarity.
Connect G2 to Claude or ChatGPT for answers grounded in G2's trusted reviews, comparisons, and pricing from real user insights.
Profitbase InFront is a web-based dashboard solution that enables users to view, explore, and analyze data directly from a browser on any device, including mobile phones, desktops, and tablets. Designed with an intuitive interface, it requires no training and can be customized to align with a company's visual identity. Key Features and Functionality: - Web-Based Accessibility: Access dashboards from any device with a web browser, ensuring flexibility and convenience. - User-Friendly Interface: Navigate and interact with data effortlessly, without the need for specialized training. - Customization: Tailor the dashboard's appearance to match the company's branding and visual preferences. Primary Value and Problem Solved: Profitbase InFront addresses the challenge of complex and inaccessible data analysis tools by providing a straightforward, web-based dashboard that simplifies data exploration and visualization. This empowers users across the organization to make informed decisions quickly, without the barriers of technical complexity or extensive training.
PureSpectrum is a premier market research technology company. PureSpectrum empowers insights professionals to make faster, more confident decisions through innovative solutions. PureSpectrum's core offering is a programmatic Marketplace and sample management platform that streamlines the online survey process, facilitating millions of high-quality interviews annually. Researchers leverage PureSpectrum's comprehensive suite and professional services to quickly gather reliable data, supported by PureScore™, the industry’s leading respondent-level scoring system that ensures data quality. PureSpectrum's commitment to talent density and core values of Simplicity, Transparency, Innovation, and Quality drive its success. The company's achievements include being named MR Supplier of the Year, a three-time GRIT Top 50 Most Innovative honoree, and a Deloitte & Inc. Fastest Growing Company since 2020. PureSpectrum is a trusted partner for businesses leveraging market research for informed decision-making.
Average Rating: 4.7/5.0
Total Reviews: 12
AI-generated summary from verified user reviews
"User-Friendly UI, Strong Performance, and Excellent Support"
Rating: 5.0/5.0 stars
— Milos R.
"Straightforward UI and Consistently High-Quality Responses"
Rating: 4.5/5.0 stars
— Gaurav K.
QCEO visualizes your business data and tracks the health of your business by measuring revenue trends, growth, and operational cash flow. For many CEOs, their dashboards are mission control and a window into understanding the daily operations and growth of their businesses. Busy executives are looking for quick and high-level visibility into their businesses, the ability to pinpoint areas of improvement, and actionable data to help drive business actions. With all these high-level metrics in place, CEOs are better equipped to drive the business forward.
qrunchin is an instant data analysis tool. It turns any spreadsheet into business insights and analytics. Drag a spreadsheet to generate charts, KPIs, and commentary on the fly. Edit analyses in natural language. Then share your work with your team.
Average Rating: 4.1/5.0
Total Reviews: 8
"Simplified tool for your insights"
Rating: 4.5/5.0 stars
— Anderson B.
"qrunchin help to transform and designed data into actionable business insights quickly and easily."
Rating: 4.5/5.0 stars
— June Rey P.
Qubole is the open data lake company that provides a simple and secure data lake platform for machine learning, streaming, and ad-hoc analytics. No other platform provides the openness and data workload flexibility of Qubole while radically accelerating data lake adoption, reducing time to value, and lowering cloud data lake costs by 50 percent. Qubole’s Platform provides end-to-end data lake services such as cloud infrastructure management, data management, continuous data engineering, analytics, and machine learning with near-zero administration. Qubole is trusted by leading brands such as Expedia, Disney, Oracle, Gannett and Adobe to spur innovation and to transform their businesses for the era of big data. For more information, visit us at www.qubole.com.
Average Rating: 4.0/5.0
Total Reviews: 237
"Qubole is an amazing data lake platform for analytics"
Rating: 5.0/5.0 stars
— Parth C.
"Great and easy to implement tool to manage big data"
Rating: 5.0/5.0 stars
— Muhammad D.
QuickChart is a chart API that lets you display image charts anywhere, including email and reports. Use QuickChart to generate image charts, PDFs, QR codes, and more.
Quick Filters for Jira Dashboards turns static dashboards into interactive, insight‑driven control centers. Teams can instantly slice and refine any chart, table, or diagram with powerful real‑time filters - no admin rights or duplicate dashboards needed. It’s a fast, intuitive way to surface the right data at the right moment and keep every team aligned on what matters most. Why Teams Love It: - See only what matters: Instantly narrow any dashboard to the projects, people, or work items you care about. - Work faster with less noise: One dashboard adapts to every audience - no more cluttered or duplicated views. - Find answers on the fly: Real‑time filters help you spot bottlenecks, trends, and priorities in seconds. - Empower everyone: Anyone can explore data interactively without admin rights or complex setup. Perfect For: - Teams that want dashboards to adjust to their workflow, not the other way around - Leaders who need quick drill‑downs during reviews or status updates - Cross‑project teams looking for a single, flexible source of truth - Anyone who wants clearer insights without building endless dashboards
Quiriz for Google Docs turns a question into the chart or table it asks for. Type a question where the answer belongs, such as "Sessions and revenue by channel, last 3 months", select it, press Chart or Table, and the answer replaces the words, computed from your data in Quiriz so every figure in the document can be traced. Connect Shopify, Stripe, HubSpot, QuickBooks, Google Analytics and ad platforms, or upload files, with metric definitions set once in Company Context. Free trial inside the add-on. Part of Quiriz, the AI business analyst.
Quiriz for Google Sheets puts a =QUIRIZ function in the grid: ask a business question and the answer lands in the cell, calculated from a dataset you imported and can refresh, so the same question gives the same answer next month with the new data. A sidebar handles charts and longer questions. A Google Sheet can itself be a dataset that refreshes daily, weekly or monthly. Connect Shopify, Stripe, HubSpot, QuickBooks, Google Analytics, Google Ads, Meta Ads and more, with metric definitions set once in Company Context. Free trial inside the add-on. Part of Quiriz, the AI business analyst.
Average Rating: 4.0/5.0
Total Reviews: 1
"A Convenient Tool for Simplifying Google Sheets Workflows"
Rating: 4.0/5.0 stars
— Dinesh R.
